Contents Investment highlights and update General presentation 2 - - PowerPoint PPT Presentation

contents
SMART_READER_LITE
LIVE PREVIEW

Contents Investment highlights and update General presentation 2 - - PowerPoint PPT Presentation

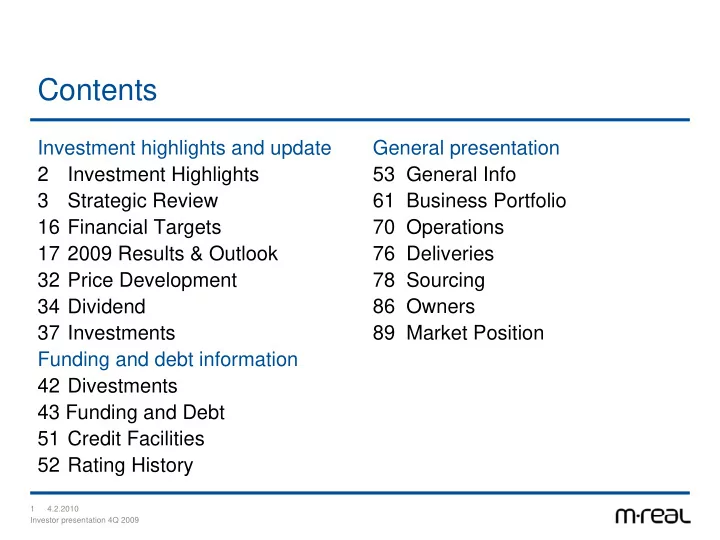
Contents Investment highlights and update General presentation 2 Investment Highlights 53 General Info 3 Strategic Review 61 Business Portfolio 16 Financial Targets 70 Operations 17 2009 Results & Outlook 76 Deliveries 32 Price


slide-1
SLIDE 1

4.2.2010 Investor presentation 4Q 2009 1

Contents

General presentation 53 General Info 61 Business Portfolio 70 Operations 76 Deliveries 78 Sourcing 86 Owners 89 Market Position Investment highlights and update 2 Investment Highlights 3 Strategic Review 16 Financial Targets 17 2009 Results & Outlook 32 Price Development 34 Dividend 37 Investments Funding and debt information 42 Divestments 43 Funding and Debt 51 Credit Facilities 52 Rating History

slide-2
SLIDE 2

4.2.2010 Investor presentation 4Q 2009 2

Investment Highlights

  • Strong core in high-quality cartonboards

– M-real the European market leader in folding boxboard

  • Significant net debt reduction in recent years
  • Strategic review ongoing

– M-real the forerunner in paper merchanting and coated papers industry restructuring in Europe – Asset divestments – Extensive cost savings and cash flow improvement programmes

slide-3
SLIDE 3

Strategic Review

slide-4
SLIDE 4

4.2.2010 Investor presentation 4Q 2009 4

M-real Strategic Review

  • M-real’s Response to the Changes in Business Environment
  • In March 2006, M-real's Board of Directors initiated a strategic review
  • M-real was the first major paper company to emphasize the need for industry

consolidation and extensive restructuring

  • M-real successfully took the leading role in uncoated fine paper and folding

boxboard price increases

  • M-real took the leading role in European paper merchanting restructuring in

2007

  • M-real also took the leading role in European coated paper industry

restructuring in 2008

  • And the journey continues…
slide-5
SLIDE 5

4.2.2010 Investor presentation 4Q 2009 5

Significant Steps Taken in M-real Strategic

  • Review. The Review Continues

Step 1: Extensive restructuring programme announced in Oct 2006 Step 2: Extension of the October programme through Finnish restructuring, Feb 2007 Step 3: Divestment of Map Merchant Group, July 2007 Step 4: New profit improvement and complexity reduction programme, Nov 2007 Step 5: Self-sufficiency in pulp – Botnia Uruguay mill in full speed, 2Q 2008 Step 6: Divestment of Graphic Papers, September 2008 Step 7: Divestment of Botnia’s Uruguayan operations 4Q 2009

slide-6
SLIDE 6

4.2.2010 Investor presentation 4Q 2009 6

Step 1: Extensive restructuring programme announced in Oct 2006

“Restructuring went better than originally planned”

Step 2: Extension of the October programme through Finnish restructuring, Feb 2007

  • Capacity closed more than 500 ktons/a
  • Original 100 m€ cost savings target exceeded (150 m€)
  • Asset divestment target of 500 m€ clearly exceeded (700 m€)
  • Clear ONWC reduction
  • Significant net debt reduction

Excellent fighting spirit throughout M-real’s organization

slide-7
SLIDE 7

4.2.2010 Investor presentation 4Q 2009 7

Step 3: Divestment of Map Merchant Group, July 2007

“The Divestment of Map was a Strategic Decision to Clarify the Distribution Channels”

  • The divestment enabled M-real to further develop its business

relations with selected European paper merchants

  • M-real the biggest supplier to the biggest paper merchant in

Europe

  • More potential to develop other distribution channels
  • Divestment and consolidation of European paper merchanting

supports overall targets to reduce business complexity

slide-8
SLIDE 8

4.2.2010 Investor presentation 4Q 2009 8

Step 4: New EUR 100 million profit improvement and complexity reduction programme, Nov 2007

  • Original 100 m€ profit improvement target exceeded (150 m€)
  • Kangas PM 2 and Lielahti BCTMP mill closed
  • Simplification of business concepts

– Galerie Customer Programme – Consumer Packaging’s Lite4U Programme

  • Reduction of variable and fixed costs
  • Divestments of New Thames divestment (82 m€) and 100 000

B2 shares in PVO (80 m€)

slide-9
SLIDE 9

4.2.2010 Investor presentation 4Q 2009 9

Step 5: Self-sufficiency in pulp – Botnia Uruguay mill in full speed, 2Q 2008

  • Mill started up in November 2007
  • World record start up – 145 days to

reach full production

  • Secured wood sources and very

low production costs guarantee high profitability

  • M-real’s pulp demand and

production to balanced situation

slide-10
SLIDE 10

4.2.2010 Investor presentation 4Q 2009 10

Step 6: Divestment of Graphic Papers, September 2008

  • Transaction included Biberist, Kangas, Kirkniemi and Stockstadt mills
  • Extensive long-term commercial agreements

– Pulp and BCTMP supply – Sales and distribution contract for Husum PM8 and Äänekoski PM2 production – Number of other smaller service and supply agreements

  • EV 750 m€

– Cash and assumed debt 480 m€ – Vendor loan note of 220 m€ – Newly issued shares in Sappi worth 50 m€

  • As a long-term shareholder in Sappi M-real shall benefit from synergies and

improving operating environment of the industry

slide-11
SLIDE 11

4.2.2010 Investor presentation 4Q 2009 11

Step 7: Divestment of Metsä-Botnia’s Uruguayn operations, December 2009

  • Eucalyptus pulp no longer strategic raw material for M-real

– Not used in cartonboard

  • M-real’s pulp consumption and production to balanced situation
  • M-real’s net debt reduction 500 M€ compared with end 3Q

– 300 M€ cash – 150 M€ MB deconsolidation impact – 50 M€ 3-year vendor note from Metsäliitto Cooperative

  • New Metsä-Botnia ownership structure: Metsäliitto Cooperative 53%,

M-real 30%, UPM-Kymmene 17%

slide-12
SLIDE 12

4.2.2010 Investor presentation 4Q 2009 12

Strategic Review of the Paper Business Proceeds

  • Succesfull divestments of Map Merchants and Graphic Papers
  • M-real in strong position in participating restructuring of the European

uncoated fine paper business

  • After efficiency improvements Husum with own strong brands very competitive
  • Alizay the leading European mill with own brands in fast growing recycled business
  • M-real is seeking innovative structural options to improve WFU business
  • M-real Zanders is the leading European speciality paper producer
  • New measures needed to reduce complexity and improve efficiency
  • After completion of these changes it is the time to participate in the European

speciality paper consolidation

slide-13
SLIDE 13

4.2.2010 Investor presentation 4Q 2009 13

Main Internal Profit Imporvement Measures in 2010

  • A plan to permanently shut down the Alizay pulp mill
  • Planned closures of two speciality paper machines in Reflex (capacity

80 ktons/a) and streamlining of M-real Zanders organizations

  • EUR 22 million investment at Husum mill to improve energy efficiency
  • New EUR 20 million internal profit improvement programme covering

all M-real’s business areas

slide-14
SLIDE 14

4.2.2010 Investor presentation 4Q 2009 14

2010 Result Expected to Be Boosted by EUR 100 million Due to Own Measures

Cumulative Profit impact vs. 2009, m€ total target 2010 2011 1 Profit improvement programme 2010 80 40 80 2 Rollover impact of 2009 programme 60 50 60 3 Rollover impact of 2008 programme 20 10 20 Total 160 100 160

  • Profit improvement in 2010 expected to be somewhat emphasised to 2H 2010
  • Final cash costs determined later on when negotiations with employee unions finalized
slide-15
SLIDE 15

4.2.2010 Investor presentation 4Q 2009 15

M-real Is a Responsible Company

Completed closures in 2007

– Sittingbourne: coated fine paper 210 ktons/a – Gohrsmühle PM6 and PM7: coated fine paper 100 ktons/a – Wifsta: uncoated fine paper 175 ktons/a – Tako BM2: folding boxboard 70 ktons/a

Closures in 2008

– Kangas PM2: coated magazine paper 100 ktons/a – Lielahti: BCTMP 105 ktons/a – New Thames: uncoated fine paper (divestment, grade conversion) 230 ktons/a

Closures in 2009

– Hallein paper mill: coated fine paper 310 ktons/a – Gohrsmühle: standard coated fine paper * 250 ktons/a Total paper capacity 1 385 ktons/a Total board capacity 70 ktons/a Total pulp (incl. BCTMP) capacity 105 ktons/a

*In Gohrsmühle the speciality paper and uncoated fine paper reel and folio sheet production expanded after the discontinuation of the standard coated fine paper production. In 2010 M-real is planning to close Alizay pulp mill (310 ktons/a) and two speciality paper machines in Reflex (80 ktons/a)

slide-16
SLIDE 16

Financial Targets

slide-17
SLIDE 17

4.2.2010 Investor presentation 4Q 2009 17

Financial Targets

  • ROCE target set at a minimum of 10% on average over the business cycle
  • Net gearing not to exceed 100%

Minimum ROCE 10%* Maximum net gearing 100%

13,5% 6,2% 2,1%1,6%0,5%0,9% 2,8%

  • 0,5%
  • 5,6%

10,2% 7,6%

99 00 01 02 03 04 05 06 07 08 09

Minimum target of 10% 184% 119% 137% 82% 95% 126% 99% 90% 84% 83% 145%

99 00 01 02 03 04 05 06 07 08 09

Maximum level of 100%

* Excluding non-recurring items

slide-18
SLIDE 18

2009 results and Outlook

slide-19
SLIDE 19

4.2.2010 Investor presentation 4Q 2009 19

Key Events in 2009

  • Operating cash flow 137 M€ in 2009
  • Demand recovered during 2H 2009
  • Consumer Packaging’s EBIT 13% of sales during 2H 2009
  • Price increases for linerboard and for FBB
  • Successfully completed profitability measures and a new 80 M€

programme focusing on boosting paper business’ results

  • Major rebuild of Husum pulp mill recovery boilers
  • Change in Metsä-Botnia’s ownership structure

19

slide-20
SLIDE 20

4.2.2010 Investor presentation 4Q 2009 20

Key Figures – Annual Comparison

*from continuing and discontinued operations

  • 178
  • 230
  • 300
  • 200
  • 100

100 2008 2009

  • 204
  • 358
  • 400
  • 300
  • 200
  • 100

100 2008 2009

  • 61
  • 267
  • 300
  • 200
  • 100

100 200 2008 2009

Operating result

M€

Result before taxes

M€

  • 35
  • 150
  • 200
  • 150
  • 100
  • 50

50 2008 2009

Operating result, excl. non-

  • rec. items

Result before taxes, excl. non-rec. items

M€ M€

Sales

3236 2432 1000 2000 3000 4000 2008 2009 M€

ROCE*

  • 1,3
  • 8,9
  • 10
  • 5

5 10 2008 2009 %

Board of Directors is proposing to the AGM that dividend will not be paid for the financial year 2009

slide-21
SLIDE 21

4.2.2010 Investor presentation 4Q 2009 21

Operating Cash Flow 137 M€ in 2009

M€ EBITDA*, excluding non-recurring items +44 Change in ONWC** +241 Net investments

  • 73

Net financial costs

  • 75

Operating cash flow +137

Big part of ONWC reduction is based on structural improvements

*Includes about EUR 30 million extraordinary operating costs related mainly to production portfolio changes and restructuring ** Inventories, trade accounts receivables and trade accounts payables including implemented restructuring measures

slide-22
SLIDE 22

4.2.2010 Investor presentation 4Q 2009 22

Key Figures – Quarterly

Operating result excl. non-rec. items Sales

623 585 618 606 859 829 826 722 250 500 750 1000 I II III IV I II III IV M€ M€ M€

Result before taxes excl. non-rec. items

2009 2008

  • 65

7 14

  • 22
  • 70

3

  • 1
  • 51
  • 75
  • 50
  • 25

25 50 I II III IV I II III IV

  • 21
  • 36
  • 34
  • 87
  • 62
  • 83
  • 70
  • 15
  • 100
  • 75
  • 50
  • 25

25 I II III IV I II III IV

slide-23
SLIDE 23

4.2.2010 Investor presentation 4Q 2009 23

Consumer Packaging’s Result Improved Further

250 255 100 200 300 3Q 2009 4Q 2009

Sales

M€

  • Profitability improved by increased delivery volumes

and implemented profit improvement measures

  • Prices for FBB and linerboard increasing slightly

during the coming months

  • Demand seems to continue good in 1Q 2010
  • Due to the still challenging macroeconomic situation

ability to forecast is weak

EBIT, excl non-recurring items

31 34 10 20 30 40

M€

3Q 2009 4Q 2009

23

slide-24
SLIDE 24

4.2.2010 Investor presentation 4Q 2009 24

Office Papers Result Improved and Reached Break-Even

  • 13
  • 20
  • 10

10 20

EBIT, excl non-recurring items

M€

133 132 50 100 150 200

Sales

M€

3Q 2009 4Q 2009 3Q 2009 4Q 2009

  • Profitability improved mainly by lower production

input costs

  • Prices stabilized and demand gradually improved

in 4Q 2009

  • Demand expected to be good in 1Q 2010
  • WFU price increase of 8% announced in main

markets to come into effect from 1 March

24

slide-25
SLIDE 25

4.2.2010 Investor presentation 4Q 2009 25

Structural Change of Speciality Papers Proceeding

  • 11
  • 6
  • 20
  • 10

10 20

EBIT, excl non-recurring items

M€

80 73 25 50 75 100

Sales

M€

3Q 2009 4Q 2009 3Q 2009 4Q 2009

  • Profitability improved by increased average sales

price and implemented profit improvement actions

  • Operating rates expected to improve thanks to own

measures and gradually improving market demand

  • Stable speciality paper pricing expected, rising pulp

price increases the need for price increases

  • Plan for new profit improvement measures

announced in December

25

slide-26
SLIDE 26

4.2.2010 Investor presentation 4Q 2009 26

Better Pulp Cycle Improving Market Pulp and Energy’s Profitability

  • 14
  • 9
  • 20
  • 10

10 20

EBIT, excl non-recurring items

M€

132 126 50 100 150 200

Sales

M€

3Q 2009 4Q 2009 3Q 2009 4Q 2009

  • Profitability improved by increased pulp price and

higher delivery volumes

  • Pulp price increase expected to continue and

demand to remain good in 1Q 2010

  • Hallein and Kaskinen operating rates improving

due to own actions

26

slide-27
SLIDE 27

4.2.2010 Investor presentation 4Q 2009 27

Other Operations - Cost Base Decreasing

  • Other operations is mainly including costs related to IT, sales network and

general head office costs. Hedge accounting result is also booked in Other

  • perations
  • Other operations average EBIT was about -17 M€ per quarter in 2009
  • In 2010 costs reported under Other operations expected to clearly decrease
  • Forecasting is difficult due to the material share of hedge accounting result,

that is volatile in nature

slide-28
SLIDE 28

4.2.2010 Investor presentation 4Q 2009 28

Impact of Metsä-Botnia Transaction and the Change in Consolidation Method

  • Metsä-Botnia ownership consolidated as an associated company

according to IAS 28 from 8 December 2009 onwards

– 30 % of Metsä-Botnia net result to M-real EBITDA

  • In segment reporting Metsä-Botnia net result allocated based on usage of

Metsä-Botnia pulp

– Currently roughly two thirds in Consumer Packaging and the rest almost in full in Market Pulp and Energy

  • Annual sales expected to reduce in total by EUR 250 million

– In segment reporting impacts Market Pulp and Energy sales

  • The profit of the Metsä-Botnia Uruguay in M-real 4Q 2009 operating result

was not material

slide-29
SLIDE 29

4.2.2010 Investor presentation 4Q 2009 29

Significant Efficiency Improvements Boosting Profitability

  • M-real has implemented major internal

profit improvement actions in recent years

  • Capacity per board, paper and pulp

employee ratio has improved by 45 %

  • Plans announced in December 2009

will further improve the ratio

687 823 995 876

300 600 900 1 200 2006 2007 2008 2009

tonnes/a/person

Capacity per M-real board, paper and pulp employee

slide-30
SLIDE 30

4.2.2010 Investor presentation 4Q 2009 30

Main Recent Measures Expected to Improve Results from 2010 Onwards

  • Renewed IT service contract
  • Planned permanent closure of Alizay pulp mill
  • Planned streamlining of M-real Zanders organizations and closure of two

Reflex speciality paper machines

  • Husum energy efficiency investment and agreed headcount reduction
  • Internal actions to increase pulp mill operating rates
  • New internal continuous improvement programme covering all M-real’s

business areas

slide-31
SLIDE 31

4.2.2010 Investor presentation 4Q 2009 31

Profitability Outlook

  • M-real’s 1Q 2010 operating result, excluding

non-recurring items expected to improve from 4Q 2009

  • Full year 2010 operating result excluding non-

recurring items, is expected to be positive, if the operating environment does not materially weaken from the current situation

slide-32
SLIDE 32

4.2.2010 Investor presentation 4Q 2009 32

Folding Boxboard Market Price in Europe 2000 – 2009

EUR / tn Three month moving average 400 600 800 1000 1200 2000 2001 2002 2003 2004 2005 2006 2007 2008 2009

Source: M-real

slide-33
SLIDE 33

4.2.2010 Investor presentation 4Q 2009 33

Paper and Pulp Market Price in Europe 1998 – 2009

EUR / tn Coated fine paper (100 g) Uncoated fine paper (B-copy, 80 g) Softwood pulp NBSK Coated magazine paper LWC (60g)

Source: Foex, Reuters

EUR/USD EUR/USD

400 500 600 700 800 900 1000 1100 1998 1999 2000 2001 2002 2003 2004 2005 2006 2007 2008 2009

0,8 0,9 1 1,1 1,2 1,3 1,4 1,5 1,6 1,7

slide-34
SLIDE 34

Dividend

slide-35
SLIDE 35

4.2.2010 Investor presentation 4Q 2009 35

Dividend Policy

  • Future dividends will take into account the need to achieve and

maintain sufficient financial flexibility

  • The Company remains committed to an attractive and

competitive dividend M-real's dividend policy is stable and rewarding to shareholders, and aims at paying a dividend of at least 1/3 of the Company's EPS on average over the business cycle, nonetheless taking into account the Company's gearing target

slide-36
SLIDE 36

4.2.2010 Investor presentation 4Q 2009 36

Dividend Yield

0,50 1,09 1,13 1,85 0,46 0,30

  • 0,79
  • 1,58
  • 1,09

0,26 0,37 0,38 0,51 0,51 0,51 0,25 0,00 0,00

  • 0,59
  • 1,21
  • 0,25
  • 0,43

0,23 0,06 0,06 0,14 0,12 0,12

0,0% 4,3% 0,0% 1,3% 1,4% 2,1% 2,8% 3,3% 4,1% 5,6% 5,5% 6,9% 8,6% 7,2%

  • 2
  • 1,5
  • 1
  • 0,5

0,5 1 1,5 2 2,5 3 1996 1997 1998 1999 2000 2001 2002 2003 2004 2005 2006 2007 2008 2009* € per share

  • 8 %
  • 6 %
  • 4 %
  • 2 %

0 % 2 % 4 % 6 % 8 % 10 % 12 % Dividend yield, % Earnings per share Dividend per share Dividend yield

* Board of directors dividend proposal to the AGM Dividend yield calculated from annual average B-share volume weighted price

slide-37
SLIDE 37

Investments

slide-38
SLIDE 38

4.2.2010 Investor presentation 4Q 2009 38

Capital Investments

Capital Investments about 70 m€ in 2010

  • 1 500
  • 1 000
  • 500

500 1 000 1 500 2 000 2 500 1 9 9 6 1 9 9 7 1 9 9 8 1 9 9 9 2 2 1 2 2 2 3 2 4 2 5 2 6 2 7 2 8 2 9 2 1 E Million €

Disposals Acquisitions Capital expenditure on fixed assets *Indicative level for 2010

slide-39
SLIDE 39

4.2.2010 Investor presentation 4Q 2009 39

Capital Base Well Invested - Main investments

2004: Kaskinen BCTMP plant 60 m€ 2005: Kaskinen BCTMP plant 120 m€ Metsä-Botnia’s Uruguay project 80 m€ Kemi board mill coating unit 7 m€ 2006: Metsä-Botnia’s Uruguay project 220 m€ Simpele Board mill 60 m€ Alizay paper machine former 8 m€ Kemi board machine former 7 m€ 2007: Metsä-Botnia’s Uruguay project 100 m€

slide-40
SLIDE 40

4.2.2010 Investor presentation 4Q 2009 40

Future Investments

  • Future investments are subject to strict investment criteria
  • Investments improving cost-competitiveness and product

quality

  • No plans to invest in capacity increases
  • No significant acquisitions in near- to medium-term
  • Maintenance capex about 50-60 m€
slide-41
SLIDE 41

Funding and debt information

slide-42
SLIDE 42

4.2.2010 Investor presentation 4Q 2009 42

Significant Divestments

  • EUR 3.4 billion in assets divested since 2001

Year Divestiture Enterprise Value

300* 2009 Metsä-Botnia’s Uruguayn operations 750 2008 Graphic Papers 80 2008 100 000 B2 shares in PVO 82** 2008 New Thames mill 382 2007 Map Merchant Group 60 2007 Folding carton plants EUR millions 240 2007 Botnia (9%) 164 2005 Botnia (8%) 163 2005 Forestia (95%) 20 2005 Savon Sellu 570 2004 Metsä Tissue 235 2002 Papierfabrik Albbruck 300 2001 MD Papier Noviant (19%) 2001 41 3,387

* Cash portion **Incl. pension liabilities

slide-43
SLIDE 43

4.2.2010 Investor presentation 4Q 2009 43

Loans and Interest Rate

At the end of 2009

  • Average maturity of long term loans

2,4 years

  • Average interest rate of loans (including derivatives)

6,0 %

  • Interest rate maturity of loans (including derivatives)

6,4 months

  • Of the loans about 84 per cent was subject to variable interest

rates and 16 per cent to fixed interest rates

slide-44
SLIDE 44

4.2.2010 Investor presentation 4Q 2009 44

Long-term Interest Bearing Liabilities

4 % 4 % 2 % 7 % 7 % 76 % MTN Programme Bonds Pension premium loans Loans from financial institutions Finance leases Other interest bearing liabilities

Total 1 349 m€ 31.12.2009

slide-45
SLIDE 45

4.2.2010 Investor presentation 4Q 2009 45

Short term interest bearing liabilities

Total 61 m€ 31.12.2009

Short-term Interest Bearing Liabilities

10 % 90 % Metsäliitto Group Short-term bank loans and other

slide-46
SLIDE 46

4.2.2010 Investor presentation 4Q 2009 46

Interest bearing net liabilities 31.12.2003

Interest Bearing Net Liabilities 31.12.2009

  • Long-term

1 349

  • Short-term

61

  • Total interest bearing liabilities

1 410

  • Liquidity and other interest bearing receivables

634

  • Interest bearing net liabilities

777

slide-47
SLIDE 47

4.2.2010 Investor presentation 4Q 2009 47

Major Net Debt Reduction in Recent Years

777 1254 2183 3109 3019 3482 3693 2205 2403 1867 500 1000 1500 2000 2500 3000 3500 4000 2000 2001 2002 2003 2004 2005 2006 2007 2008 2009

Net Debt, M€

  • Current net debt 777 M€ and net

gearing 84 %

  • M-real made an early redemption of

2010 bonds worth 250 M€

  • Liquidity continues good-

497 M€ at the end of 2009

  • Financing costs in 2010 about 70 M€,

investments about 70 M€ and depreciations about 130 M€

slide-48
SLIDE 48

4.2.2010 Investor presentation 4Q 2009 48

Maturity Profile 31.12.2009

406 94 148 582 96 1 21 100 200 300 400 500 600 700 2010 2011 2012 2013 2014 2015 2016 >2 016

Long-term interest bearing liabilities, EUR, million

slide-49
SLIDE 49

4.2.2010 Investor presentation 4Q 2009 49

Liquidity

Committed credit facilities Liquid funds

200 400 600 800 1000 1200 1400 1600 I/08 II/08 III/08 IV/08 I/09 II/09 III/09 IV/09

M€

slide-50
SLIDE 50

4.2.2010 Investor presentation 4Q 2009 50

Non-interest Bearing Liabilities

Total 723 m€ 31.12.2009

22 % 27 % 8 % 7 % 20 % 16 % Deferred tax liability Accounts payable Accrual and deferred income Other long-term non-interest-bearing liabilities Other short-term non-interest-bearing liabilities Provision for liabilities and charges

slide-51
SLIDE 51

4.2.2010 Investor presentation 4Q 2009 51

Debt Programs

M-REAL GROUP BORROWINGS 31.12.2009 The following table sets forth the significant debt securities issued and outstanding of M-real as at Dec. 31, 2009: Average Long-term borrowings Total amount Outstanding Interest Rate Maturity USD 350 million Private Note Issue USD 350 USD 224 5.5% (1) 2012–2014 EUR 500 million Bond I ssue EUR 500 EUR 500 7.1% (1) 2013 EUR 400 million Bond I ssue EUR 400 EUR 340 6,0% (1) 2010 Global Medium-Term Note Program EUR 1 500 EUR 192 million private placements EUR 52 3,1% (1) 2011 EUR 151 million bilateral loans EUR 151 EUR 151 1,4 % 2010–2013 EUR 31 million finance leases EUR 31 EUR 31 4,9 % 2010–2014 EUR 378 million pension loans EUR 378 EUR 99 6,9 % 2010–2017 S hort-term funding programmes EUR 350 million domestic C P-program EUR 350 EUR – – EUR 150 milj. Belgian CP-program EUR 150 EUR – – Average interest rate of all M-real Group interest bearing liabilities including interest rate derivatives per 31.12.2009 is 6,0 %. The following table sets forth M-real´ s principal long-term liquidity reserves as at December 31, 2009: Average Liquidity reserves Total amount Outstanding Interest Rate Maturity Syndicated credit line 500 million matured in 2009 – 2009 Pension loan facilities EUR 378 EUR 99 6,9 %

  • (1) The average interest rates take into account outstanding interest rate swaps and amortised arrangement fees.

(currency in millions) (EUR in millions)

slide-52
SLIDE 52

4.2.2010 Investor presentation 4Q 2009 52

Ratings’ History

2000 S&P: Short term ratings lowered to A3, Long term ratings placed to credit watch negative Moody’s: Long and short term ratings

  • utlook changed from stable to negative

2001 S&P: Long term ratings lowered to BBB-, stable outlook Moody’s: Long and short term ratings lowered to Baa3/P3, negative outlook 2003 S&P: Downgrade to BB+, stable outlook Moody’s: Downgrade to Ba1, negative

  • utlook

2004 S&P: Outlook changed from stable to negative, ratings affirmed Moody’s: Downgrade to Ba2, stable outlook 2005 S&P: Downgrade to BB, stable outlook Moody’s: Outlook changed from stable to negative, ratings affirmed 2006 S&P: Downgrade to BB-, negative outlook Moody’s: Downgrade to Ba3, negative outlook Moody’s: Downgrade to B2, negative outlook S&P: Downgrade to B+, negative outlook 2007 Moody’s: Downgrade to B3, negative outlook S&P: Downgrade to B, negative outlook S&P: Downgrade to B-, stable outlook 2008 S&P: Outlook to negative 2009 S&P: Downgrade to CCC+, negative outlook Moody’s: Downgrade to Caa1, outlook negative:

slide-53
SLIDE 53

General presentation

slide-54
SLIDE 54

4.2.2010 Investor presentation 4Q 2009 54

M-real in Brief

  • Annual sales about EUR 2.5 billion.
  • Approximately 5,000 employees.
  • Present in over 70 countries.
  • 13 production units in 5 European

countries.

  • Part of Metsäliitto Group and listed on

the NASDAQ OMX Helsinki Ltd.

  • Metsäliitto Group is one of the largest

forest industry groups in the world,

  • wned by a cooperative of 130.000

private Finnish forest owners.

Consumer Packaging 40% Paper 40% Market pulp and energy 20%

Sales breakdown 2009

slide-55
SLIDE 55

4.2.2010 Investor presentation 4Q 2009 55

Offering for consumer packaging, communications and advertising

  • Cartonboards and white-top kraftliners for packaging

beautycare, healthcare, cigarettes, food, consumer durables etc.

  • Graphic boards e.g. for book covers, postcards, greeting

cards, CD or DVD covers

  • Office papers from high-volume copying and printing to high-

quality color presentations

  • Speciality papers for advertising and corporate materials,

flexible packaging, creative designs, labeling, self-adhesive laminates and for wallcovering industry

slide-56
SLIDE 56

4.2.2010 Investor presentation 4Q 2009 56

M-real’s Customers

Publishers Office product resellers Brand owners Printers and converters Paper merchants Office paper users Advertising and design agencies

slide-57
SLIDE 57

4.2.2010 Investor presentation 4Q 2009 57

Focus on Core Businesses

17 % 32 % 12 % 9 % 12 % 6 % 9 % 3 % Paper Pulp Paperboard Packaging Tissue Mechanical Forest Products Merchanting Chemicals

40 % 40 % 20 %

1995 Sales €2.3 billion 2009 Sales ~ €2.5 billion 8 Businesses 3 Businesses

slide-58
SLIDE 58

4.2.2010 Investor presentation 4Q 2009 58

M-real Restructuring Story

Acquisitions

Modo Paper Biberist Paper Mill

1997 1996 2000 1998

Simpele Mill

1995 1999

Divestments

Kyro Board Mill UK Paper Zanders Sawn Goods & Building Materials Chemicals Business Botnia Wood Corrugated Packaging MD Papier Metsä Tissue

2001 2002 2003 2004

Kemiart Liners (53 %) Albbruck

2005

Savon Sellu Forestia 8% in Botnia

2006 2007

PSM 9% in Botnia Carton plants

Map

100 000 B2 shares in PVO

2009 2008

New Thames MB Uruguay Graphic Papers

slide-59
SLIDE 59

4.2.2010 Investor presentation 4Q 2009 59

Annual Sales Development

2432 3236 4440 5624 5241 5460 6044 6564 6923 5898 3319 3014 2313 4044 1000 2000 3000 4000 5000 6000 7000 8000 1996 1997 1998 1999 2000 2001 2002 2003 2004 2005 2006 2007 2008 2009 EUR, million

slide-60
SLIDE 60

4.2.2010 Investor presentation 4Q 2009 60

Profitability Development

  • 18

18 49

  • 150
  • 35
  • 200
  • 150
  • 100
  • 50

50 100 2005 2006 2007 2008 2009 EBIT, excluding non-recurring items. Data not available beyond 2005 (Map restatement)

EUR, million

273 295 516 279

  • 95
  • 125
  • 81
  • 340
  • 250
  • 170
  • 331

337

  • 400
  • 300
  • 200
  • 100

100 200 300 400 500 600 1998 1999 2000 2001 2002 2003 2004 2005 2006 2007 2008 2009 Net profit from continuing operations. 1998-2003 nubers profit before taxes and minority interests.

EUR, million

slide-61
SLIDE 61

Business Portfolio

slide-62
SLIDE 62

4.2.2010 Investor presentation 4Q 2009 62

Business Portfolio

Consumer Packaging Office Papers Speciality Papers Market Pulp and Energy

slide-63
SLIDE 63

4.2.2010 Investor presentation 4Q 2009 63

Consumer Packaging

Mainly Folding Boxboard and Linerboard

  • Fibre-based high value-added packaging solutions for global brand
  • wners in beautycare, healthcare, cigarette, food and consumer

electronics industries as well as for graphical end-uses

  • Relatively high earnings stability
  • High segment consolidation
  • Competitive folding boxboard mills with end use specified production

Capacity Share (%) 7 % 8 % 10 % 27 % 30 % 0 % 5 % 10 % 15 % 20 % 25 % 30 % 35 % IP Cascades Holmen Stora Enso M-real

  • No. 1 Folding Boxboard Producer in Europe
slide-64
SLIDE 64

4.2.2010 Investor presentation 4Q 2009 64

Office Papers

Mainly Uncoated Fine Paper

Capacity Share (%)

8 % 9 % 11 % 14 % 15 % 0 % 5 % 10 % 15 % 20 % M-real UPM-Kymmene Mondi Stora Enso Portucel

  • No. 5 Uncoated Fine Paper Producer in Europe
  • High quality uncoated fine papers for printing and photocopying as

well as for forms, envelopes, manuals and communication purposes

  • Diversified customer base, e.g. merchants, retail chains, office

equipment manufacturers and corporations

  • Leading European office paper brands like DataCopy and Evolve

*

* Stora Enso has indicated to potentially close ~500 ktons/a by the end of 2010

slide-65
SLIDE 65

4.2.2010 Investor presentation 4Q 2009 65

Speciality Papers

  • Innovative speciality papers e.g. for special magazines, supplements,

sales promotion, corporate communication, annual reports, art books, brochures

  • Uncoated fine papers mainly in the form of folio sheets and reels
  • Zanders, the best known speciality paper brand in Europe
  • Many successful product innovations based on close cooperation with

customers and an in-depth understanding of their business

slide-66
SLIDE 66

4.2.2010 Investor presentation 4Q 2009 66

Sales by Business Area

M€

80 133 132 250 126 73 132 255 50 100 150 200 250 300 Consumer Packaging Office Papers Speciality Papers Market Pulp and Energy

3Q 2009 4Q 2009

slide-67
SLIDE 67

4.2.2010 Investor presentation 4Q 2009 67

Operating Result by Business Area*

M€

* excl. non-recurring items

  • 11
  • 13
  • 14

31

  • 9
  • 6

34

  • 20
  • 10

10 20 30 40 50 Consumer Packaging Office Papers Speciality Papers Market Pulp and Energy

4Q 2009 3Q 2009

slide-68
SLIDE 68

4.2.2010 Investor presentation 4Q 2009 68

Sales by Business Area

622 804 644 1061 508 352 543 968 250 500 750 1000 1250 Consumer Packaging Office Papers Speciality Papers Market Pulp and Energy

2009 2008

M€

slide-69
SLIDE 69

4.2.2010 Investor presentation 4Q 2009 69

Operating Result by Business Area*

M€

  • 15
  • 29

32 29

  • 54
  • 51
  • 48

69

  • 80
  • 60
  • 40
  • 20

20 40 60 80 Consumer Packaging Office Papers Speciality Papers Market Pulp and Energy

2008 2009

* excl. non-recurring items

slide-70
SLIDE 70

Operations

slide-71
SLIDE 71

4.2.2010 Investor presentation 4Q 2009 71

Production Capacity

1 800 1 200 2 450 500 1 000 1 500 2 000 2 500 3 000 3 500 4 000 Paper Board Pulp and BCTMP 1000 tons/a

slide-72
SLIDE 72

4.2.2010 Investor presentation 4Q 2009 72

M-real Production Locations

Consumer Packaging:

  • Simpele
  • Äänekoski board and paper
  • Kyro
  • Tako
  • Kemi
  • Joutseno

Office Papers:

  • Alizay paper and pulp
  • Husum paper and pulp

Speciality Papers:

  • Gohrsmühle
  • Reflex

Additionally, Kaskinen BCTMP and Hallein Pulp mills

Alizay Hallein Husum Gohrsmühle and Reflex Äänekoski Simpele Joutseno Kemi Tako Kyro Kaskinen

slide-73
SLIDE 73

4.2.2010 Investor presentation 4Q 2009 73

Paper and Board Capacity by Grade

BOARD M I LLS Board Mill Country Machines Folding Boxboard Liner Total

Tampere Finland 2 205 205 Kyröskoski Finland 1 160 160 Äänekoski Finland 1 210 210 Simpele Finland 1 215 215 Kemi Finland 1 375 375

Total 6 790 375 1165 PAPER MI LLS Paper Mill Country Machines Coated Coated Uncoated Magazine Fine Fine Specialty Paper Paper Paper Paper Total

Äänekoski Finland 1 200 200 Simpele Finland 1 55 55 Kyröskoski Finland 1 100 105 Bergisch Gladbach Germany 2 200 70 270 Düren* Germany 4 100 100 Husum Sweden 3 275 435 710 Alizay France 1 310 310

Total 13 275 200 945 325 1750

* two machines planned to be closed (80 ktons/a in total)

(1000 t/a)

slide-74
SLIDE 74

4.2.2010 Investor presentation 4Q 2009 74

Pulp Capacity

PULP MI LLS Pulp Mill Country Chemical Pulp BCTMP Total

Husum Sweden 690 690 Alizay* France 310 310 Hallein Austria 160 160 Joutseno Finland 270 270 Kaskinen Finland 300 300

Total 1160 570 1730

* planned to be permanently closed

BOTNI A * Mill Country Chemical Pulp Total

Äänekoski Finland 500 500 Kemi Finland 575 575 Rauma Finland 630 630 Joutseno Finland 650 650

Total 2355 2355

* M-real share is 30% of the capacity

(1000 t/a)

slide-75
SLIDE 75

4.2.2010 Investor presentation 4Q 2009 75

Personnel Development

4904 6546 9508 14125 15154 16490 20372 21070 22237 17351 13885 12637 11463 15572 5000 10000 15000 20000 25000 1996 1997 1998 1999 2000 2001 2002 2003 2004 2005 2006 2007 2008 2009

slide-76
SLIDE 76

Deliveries

slide-77
SLIDE 77

4.2.2010 Investor presentation 4Q 2009 77

Annual Deliveries*

Uncoated fine paper Cartonboard

32 % 6 % 18 % 44 % Western- Europe Eastern- Europe Americas Asia & Pacific

8 % 86 % 5 % 1 %

* Indicative numbers

slide-78
SLIDE 78

Sourcing

slide-79
SLIDE 79

4.2.2010 Investor presentation 4Q 2009 79

M-real Cost Structure 2008*

(total annual costs in industrial operations ~ EUR 2.5 Billion)

Wages and salaries 16 % Other fixed 15 % Delivery costs 14 % Wood 21 % Chemicals, pigments and fillers 17 % Other variables 6 % Energy 11 %

Fixed costs Variable costs

* Percentage of annual costs in industrial operations

slide-80
SLIDE 80

4.2.2010 Investor presentation 4Q 2009 80

Electricity Sourcing 2008 (total 4 300 GWh)

Associated company (PVO) 24 % Outsourced generation 1 % Own generation 46 % Purchased energy 29 %

slide-81
SLIDE 81

4.2.2010 Investor presentation 4Q 2009 81

Fuels Used 2008 (total 24,7 TWh)

Wood- based 60 % Natural gas 13 % Coal 9 % Oil 4 % Peat 1 % Hydropower 4 % Nuclear power 9 %

slide-82
SLIDE 82

4.2.2010 Investor presentation 4Q 2009 82

Wood Sourcing

1 000 m3 2008 2007 Finland 5043 5520 Sweden 2639 2402 Russia 1246 1154 France 1066 1161 Austria 870 577 Germany 460 704 Latvia 425 417 Uruquay 118 574 Estonia 230 208 Lithuania 169 194 Spain 9 Total 12266 12920

slide-83
SLIDE 83

4.2.2010 Investor presentation 4Q 2009 83

Development of Softwood Pulpwood

Cost at Mill, Wood for Chemical Pulping

1980 – 3Q 2009

Source: Pöyry

10 20 30 40 50 60 1 9 8 1 9 8 1 1 9 8 2 1 9 8 3 1 9 8 4 1 9 8 5 1 9 8 6 1 9 8 7 1 9 8 8 1 9 8 9 1 9 9 1 9 9 1 1 9 9 2 1 9 9 3 1 9 9 4 1 9 9 5 1 9 9 6 1 9 9 7 1 9 9 8 1 9 9 9 2 2 1 2 2 2 3 2 4 2 5 2 6 2 7 2 8 2 9 q 3 EUR/m

3sob, nominal

Finland, south, pine Sweden, south, pine Germany, south, pine Chile, radiata pine USA South, SYP Canada East, SPF

slide-84
SLIDE 84

4.2.2010 Investor presentation 4Q 2009 84

Development of Softwood Pulpwood

Cost at Mill, Wood for Mechanical Pulping

1980 – 3Q 2009

Source: Pöyry

10 20 30 40 50 60 70 1 9 8 1 9 8 1 1 9 8 2 1 9 8 3 1 9 8 4 1 9 8 5 1 9 8 6 1 9 8 7 1 9 8 8 1 9 8 9 1 9 9 1 9 9 1 1 9 9 2 1 9 9 3 1 9 9 4 1 9 9 5 1 9 9 6 1 9 9 7 1 9 9 8 1 9 9 9 2 2 1 2 2 2 3 2 4 2 5 2 6 2 7 2 8 2 9 q 3 EUR/m

3sob, nominal

Finland, south, spruce Sweden, south, spruce Germany, south, spruce Austria, spruce Canada East, SPF USA Great Lakes, spruce

slide-85
SLIDE 85

4.2.2010 Investor presentation 4Q 2009 85

Development of Hardwood Pulpwood

Cost at Mill, Wood for Chemical Pulping

1980 – 3Q 2009

Source: Pöyry

10 20 30 40 50 60 1 9 8 1 9 8 1 1 9 8 2 1 9 8 3 1 9 8 4 1 9 8 5 1 9 8 6 1 9 8 7 1 9 8 8 1 9 8 9 1 9 9 1 9 9 1 1 9 9 2 1 9 9 3 1 9 9 4 1 9 9 5 1 9 9 6 1 9 9 7 1 9 9 8 1 9 9 9 2 2 1 2 2 2 3 2 4 2 5 2 6 2 7 2 8 2 9 q 3 EUR/m

3sob, nominal

Finland, south, birch Sweden, south, birch Portugal, E. globulus Brazil, E. grandis South Africa, E. grandis USA South, mixed hw

slide-86
SLIDE 86

Owners

slide-87
SLIDE 87

4.2.2010 Investor presentation 4Q 2009 87

M-real Shareholders 31.12.2009

Non-Finnish nationals; 19 % Non-profitmaking

  • rganizations; 2 %

Other companies; 4 % Metsäliitto; 39 % Households; 26 % Public communities; 8 % Financial and insurance institutions; 2 %

slide-88
SLIDE 88

4.2.2010 Investor presentation 4Q 2009 88

M-real Voting Rights 31.12.2009

Non-Finnish nationals; 6 % Non-profitmaking

  • rganizations; 4 %

Other companies; 2 % Metsäliitto; 61 % Households; 13 % Public communities; 14 % Financial and insurance institutions; 1 %

slide-89
SLIDE 89

Market Position

slide-90
SLIDE 90

4.2.2010 Investor presentation 4Q 2009 90

Folding Boxboard Capacities in Europe

BIG-5 = 82% of total

100 200 300 400 500 600 700 800 900 Others Mayr-Melnhof IP Cascades Holmen Stora Enso M-real

Source: Pöyry Forest Industry Consulting

Capacity: tons/year (million) 30% 27% 10% 8% 7% 7% 11%

slide-91
SLIDE 91

4.2.2010 Investor presentation 4Q 2009 91

Uncoated Fine Paper Capacities in Europe

BIG-5 = 58% of total

500 1000 1500 2000 2500 3000 3500 Others Sappi Arctic Paper International Paper M-real UPM Mondi Stora Enso Portucel 15% 14% 11% 9% 9% 8% 3% 2% 30%

Source: Pöyry Forest Industry Consulting, M-real

Capacity: tons/year (million)

*

* Stora Enso has indicated to potentially close ~500 ktons/a by the end of 2010

slide-92
SLIDE 92

Thank you

www.m-real.com