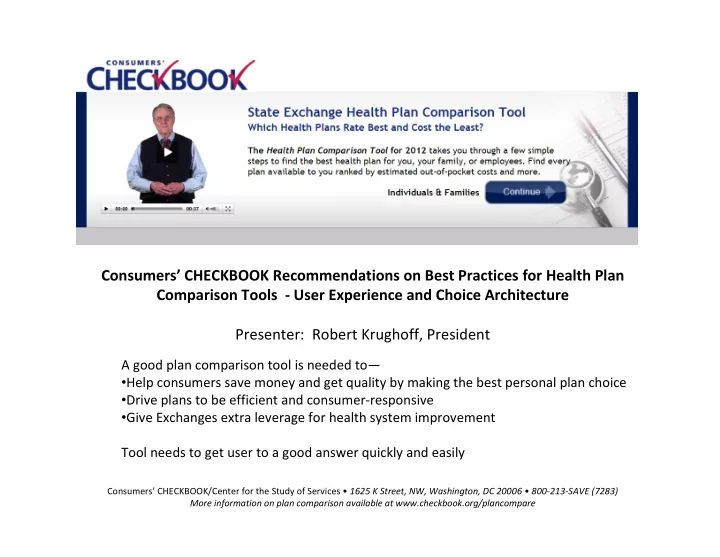
SLIDE 11 Actuarial Model—Simplified Illustration
Using a database of expenses of actual households, one can either calculate the OOP expenses under each plan for all households of a type and average them or, as in this very simplified illustration, create a number
- f representative overall expense‐level and expense‐distribution profiles and probabilities and calculate a
weighted average OOP expense estimate. Level of total expense: $0 $1,000 $2,500 $5,000 $10,000 $25,000 $150,000 Probability of expense at this level 3% 16% 17% 16% 23% 21% 4% Components of expense: Hospital room and board $0 $0 $0 $1,200 $2,300 $6,000 $50,000 Other inpatient hospital $0 $0 $0 $1,200 $2,300 $6,000 $50,000 Surgical $0 $0 $0 $0 $2,000 $4,000 $25,000 Routine exams $0 $300 $300 $300 $300 $300 $300 Other medical $0 $400 $1,200 $1,300 $1,900 $4,700 $16,700 Prescription drugs $0 $300 $1,000 $1,000 $1,200 $4,000 $8,000 OOP member would pay in ABC Plan $0 $700 $1,120 $1,370 $1,870 $3,370 $9,000 OOP exp. times probability of this exp. $0 $112 $190 $219 $430 $708 $360 Simplified illustration: for households with a 49‐year‐old husband and wife‐‐for ABC Health Plan
ABC health plan has $2,500 premium after any subsidy for this policyholder, $1,000 deductible, 10% coinsurance on all expenses after deductible, $8,000 OOP limit not counting deductible, routine exams fully covered.
Estimated average OOP in ABC Plan for households like this (sum of row above): $2,020 Enrollee share of premium in ABC Plan: $2,500 Estimated total cost (premium plus OOP) for households like this: $4,520 (this is number shown on website)