
SLIDE 1
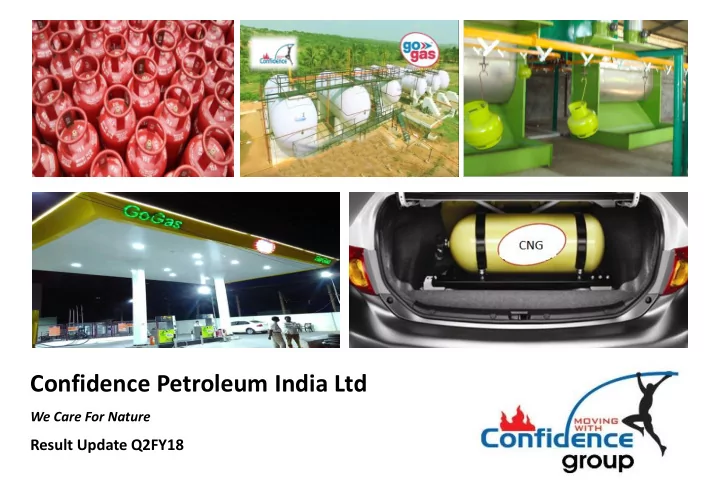
Confidence Petroleum India Ltd
We Care For Nature
Result Update Q2FY18
Confidence Petroleum India Ltd We Care For Nature Result Update - - PowerPoint PPT Presentation
Confidence Petroleum India Ltd We Care For Nature Result Update Q2FY18 Disclaimer This presentation and the accompanying slides (the Presentation), which have been prepared by Confidence Petroleum India Ltd (the Company) solely for
We Care For Nature
Result Update Q2FY18
Disclaimer
This presentation and the accompanying slides (the “Presentation”), which have been prepared by Confidence Petroleum India Ltd (the “Company”) solely for information purposes and do not constitute any offer, recommendation or invitation to purchase or subscribe for any securities, and shall not form the basis or be relied on in connection with any contract or binding commitment what so ever. No
about the Company. This Presentation has been prepared by the Company based on information and data which the Company considers reliable, but the Company makes no representation or warranty, express or implied, whatsoever, and no reliance shall be placed on, the truth, accuracy, completeness, fairness and reasonableness of the contents of this Presentation. This Presentation may not be all inclusive and may not contain all of the information that you may consider material. Any liability in respect of the contents of, or any omission from, this Presentation is expressly excluded. Certain matters discussed in this Presentation may contain statements regarding the Company’s market opportunity and business prospects that are individually and collectively forward-looking statements. Such forward-looking statements are not guarantees of future performance and are subject to known and unknown risks, uncertainties and assumptions that are difficult to predict. These risks and uncertainties include, but are not limited to, the performance of the Indian economy and of the economies of various international markets, the performance of the industry in India and world-wide, competition, the company’s ability to successfully implement its strategy, the Company’s future levels of growth and expansion, technological implementation, changes and advancements, changes in revenue, income or cash flows, the Company’s market preferences and its exposure to market risks, as well as other risks. The Company’s actual results, levels of activity, performance or achievements could differ materially and adversely from results expressed in or implied by this Presentation. The Company assumes no obligation to update any forward-looking information contained in this Presentation. Any forward-looking statements and projections made by third parties included in this Presentation are not adopted by the Company and the Company is not responsible for such third party statements and projections. 2
Key Agenda
3
01
Key Highlights – Q2 & H1FY18
02 03
Business Segments & Outlook Company Overview
Key Business Updates – H1FY18
5 Commissioned a new plant at Uluberia, near Kolkata to provide bottling assistance to HPCL against the tender of 24,000 MTPA for 5 years
New LPG Bottling plant commissioned
Commissioned 2 new ALDS at Hyderabad and Chennai, taking the total to 112 ALDS, across the country
New Auto LPG Dispensing Stations (ALDS) commissioned
Commissioned three new units – two units at Saoner, Maharashtra with a capacity of 432,000 units p.a. each and
New Cylinder manufacturing plant
Through our Associate company, Confidence Futuristic Energetech Ltd (formerly, Globe Industrial Resources Ltd); these are light weight cylinders available in sizes – 2, 5, 10 and 22 kg.
Launched Composite LPG Gas Cylinders
BPCL, HPCL and IOCL have awarded combined orders for supply of ~30 lakh LPG cylinders worth Rs 3,619 mn, with an option of order for an equivalent quantity next year
New orders awarded worth Rs 3,619 mn
Key Financials – Q2 & H1FY18
6
Revenue (Rs. mn) EBITDA (Rs. mn) PAT (Rs. mn)
77% 18% 5.8x Q2 FY17 Q2 FY18 H1FY17 H1FY18 1,114 1,310 2,150 2,741 27% Q2 FY17 Q2 FY18 H1FY17 H1FY18 96 171 196 321 64% Q2 FY17 Q2 FY18 H1FY17 H1FY18 9 60 21 103 3.9x
Profitability Highlights – Q2 & H1FY18
7 Consolidated (Rs mn) Q2FY18 Q2FY17 y-o-y % H1FY18 H1FY17 y-o-y % FY17 FY16 Total Income 1,310 1,114 17.6 2,741 2,150 27.5 4,969 3,547 Raw Material 905 874 3.5 1,954 1,691 15.5 3,597 2,529 Employee Expenses 47 61
93 102
192 125 Other Operating Expenses 187 82 126.5 373 162 130.9 768 546 EBITDA 171 96 77.3 321 196 64.1 412 346 EBITDA Margin (%) 13.0 8.7
9.1
9.8 Depreciation 61 59 3.6 122 117 4.8 242 232 Other Income 5 4 35.1 10 7 37.2 18 15 Interest 30 29 1.5 61 57 7.1 120 110 Profit Before Tax 85 12 614.5 147 29 411.8 69 19 Tax 25 3 716.1 44 8 466.7 21 8 Profit After Tax 60 9 578.4 103 21 391.6 48 11 PAT Margin (%) 4.6 0.8
1.0
0.3 Share of profit/loss in associates
55.1
23.3
2 Minority interest
PAT after associates/minority 60 9 577.2 103 21 393.6 46 12
Balance Sheet Highlights – H1FY18 & FY17
8
Net debt to equity 0.53x Fixed asset coverage 1.74x Working capital ~48 days
Consolidated (Rs mn) Sep’17 Mar’17 Shareholder’s Funds 1,921 1,818 Share capital 259 259 Reserves & Surplus 1,662 1,559 Minority interest 170 170 Non-current liabilities 1,262 1,256 Long term borrowings 642 672 Other long-term liabilities 519 488 Deferred tax liability 101 96 Current liabilities 805 828 Short Term Borrowings 482 452 Trade Payables 257 288 Other Current liabilities 33 53 Short-term provisions 33 36 Total Liabilities 4,158 4,072 Consolidated (Rs mn) Sep’17 Mar’17 Non-current assets 2,620 2,601 Fixed assets 2,281 2,277 Investments 100 98 Long term loans & advances 230 217 Other non-current assets 9 8 Current Assets 1,538 1,472 Inventories 543 541 Trade receivables 633 614 Cash & cash equivalents 113 99 Short term loans & advances 238 208 Other current assets 11 10 Total Assets 4,158 4,072
Largest Private Sector LPG player
10
Largest Cylinder Manufacturer in Asia with an installed capacity of ~50 lakh units Largest LPG Bottling Assistance Provider, to Oil Majors in India, with end-to-end solutions in LPG Presence across the Value Chain - from vendor to owner (Go Gas – owned brand) Pan India presence with a total of 15 cylinder manufacturing units, 58 bottling plants, 4 LPG blending plants and 112 ALDS stations Leading player in Auto LPG with presence in High Consumption States like Karnataka, Andhra Pradesh, Tamil Nadu, Maharashtra among others
Key Milestones in Our Journey
11 1997 1999 2000-01 2008 2004-05 Started cylinder manufacturing business by acquiring manufacturing plants Entered into LPG Bottling business; launched our own brand called ‘Gas Point’ (now Go Gas) cylinders Grew cylinder manufacturing business,
inorganically Forayed into Auto LPG business; set up the first ALDS in Maharashtra New product – Composite Cylinders under the brand ‘Go Gas Elite’ Started bottling assistance to PSUs; added many new and sick units across India Started Packed LPG marketing under the brand Go Gas; Started CNG High Pressure cylinder manufacturing 2009 2017-18 Started Indonesian
cylinder manufacturing and bottling 2010-11 Added further capacities across segments and increased Pan India presence 2012-16
Strong Management Team
12
Nitin Khara – Chairman & Managing Director Commerce Graduate and an industrialist with vast experience of 30+ years in the field of LPG and CNG Cylinder Manufacturing, LPG Bottling, Blending, and Marketing. Elesh Khara - Director Commerce Graduate with 25+ years of experience in the filed of LPG Cylinder Manufacturing. Has led business expansion by setting up new cylinder manufacturing units at various locations. Yatin Khara – President Manufacturing Post Graduate in Commerce and associated with the Group for 20+ years. Has been a key in successful completion of turnkey projects allotted by Oil Companies. Vimal Parwal – President Commercial Qualified ICWA with almost 27 years of experience in the field of LPG Manufacturing and Marketing. With the Group for 16+ years and has contributed significantly in achieving Company’s milestones. Jitendra Jain – Chief Financial Officer Chartered Accountant with an experience of ~20 years. Responsible for the maintaining the financials and
Pan India Presence Alongside Demand Centres
13
Cylinder Manufacturing Units Capacity: ~50 lakh units
LPG Bottling Plants
Blending Plants Capacity: 30,000 MTPA
Auto LPG Dispensing Stations
Strategically located alongside demand centers to ease transportation costs
Auto LPG Packed LPG – Go Gas Cylinder Manufacturing
Presence Across the Value Chain
Cylinder Manufacturing (LPG and High Pressure) LPG Blending Bottling & Bottling Assistance Packed Cylinder Marketing (domestic & commercial) Auto LPG Dispensing Stations (ALDS) LPG Logistics & Transportation Cylinder Testing and Repairs
Evolved from Cylinder/LPG Manufacturer to an Integrated Player Across the Value Chain
16
~25 years of experience in cylinder manufacturing ~50 lakh units p.a. of total manufacturing capacity 15 plants for manufacturing, across 7 states in India LPG & High Pressure cylinders for PSU OMCs –
IOCL, HPCL, BPCL and private oil companies
4kg to 47kg of sizes available, as per domestic,
commercial, industrial and automobile usage
‘Testing & Repair’ services on statutory and
periodic basis, for used cylinders
State
Capacity (#) Maharashtra 7 22,79,695 Telangana 3 10,85,022 Madhya Pradesh 1 3,00,000 West Bengal 1 3,00,000 Jharkhand 1 5,00,000 Gujarat 1 2,94,912 Uttarakhand 1 1,38,033 Total 15 48,97,662
Gross Revenue (H1FY18) Rs 1,097 mn Revenue Mix (H1FY18) ~40% Revenue Growth (H1FY18) 19% y-o-y Manufacturing facilities, across 7 states in India
17
Planned Capacity Expansion, In-line With Demand...
18
Capacity expansion, to cater the growing demand – Total capacity (lakh units)
Maharashtra, taking the total manufacturing capacity to ~50 lakh units p.a.
new connections + replacement demand
29 49 70
3 3 4 4 5
Chindwara Silliguri Saoner1 Saoner2 Dhanbad FY18E FY20E
…New Connections, led by the Pradhan Mantri Ujjwala Yojna…
19
connections to BPL families, over 3 years, that is, by May 2019
connections, the overall cylinder demand is expected to remain high
PMUY has led to the highest ever enrolments in FY17 (domestic LPG connections - in mn)
6.7 4.7 9.4 10.3 11.7 13.3 15.9 15.6 19.9 32.8 FY08 FY09 FY10 FY11 FY12 FY13 FY14 FY15 FY16 FY17
…And Replacement Cycle of the Existing Cylinders
20
translating into an approximate stock of 450 mn cylinders (including dealer inventory of ~150 mn)
replacement over the next few years PMUY + routine growth could need close to 15 mn cylinders p.a. Replacement demand from the existing plus new stock to require about 25 mn cylinders p.a.
15mn New 25mn Replacement
An estimated demand for ~40 mn cylinders p.a.
21
4 units with a capacity of 30,000 MTPA of blending Propane & Butane into LPG India’s largest private LPG bottler to Oil Majors having ~58 plants across 17 states Owned fleet of 50-55 tankers, for captive consumption
Blending Bottling Transportation
network (~350 dealers) across India
Packed Cylinder Business
Brand ‘Go Gas’, Gaining Strength
22
Bottling facilities across 17 states across India State
Maharashtra 13 Madhya Pradesh 7 West Bengal 6 Rajasthan 5 Andhra Pradesh 3 Karnataka 2 Tamil Nadu 4 Chattisgarh 3 Orissa 3 Telangana 1 Gujarat 2 Uttar Pradesh 2 Uttarakhand 2 Indonesia 2 Bihar 1 Puducherry 1 Punjab 1 Total 58
Readying To Foray into The Huge Domestic Market…
23
De-subsidizing of gas prices to create large demand
for private players in the huge domestic market (~243 mn household connections), which is currently dominated by PSU OMCs alone
to strengthen our Go Gas brand and tap the upcoming opportunity
New Product Launch – Composite Cylinders
Nov’17 through an associate company, Confidence Futuristic Energetech Ltd.
through exclusive dealer network of 5 dealers in each state.
Go Gas Elite- Composite Cylinder Launch
24
25
LPG consumption already on a growth trajectory (y-o-y)… …up for grab, as LPG subsidized prices move towards RSP*
Selling Price (RSP) is Rs 747 (Delhi) against an effective subsidized price of Rs 495.69.
able to foray into the huge domestic LPG market
…Post Fully De-subsidization of LPG Cylinder Prices
Source: ppac.org.in * Retail Selling Price * Price till Dec
1.6% 4.4% 10.5% 9.0% 9.8% 10.1%
FY13 FY14 FY15 FY16 FY17 H1FY18
400 410 420 430 440 450 460 470 480 490 500 510
Subsidized price (Rs/ 14.2 Kg Cylibder) Rsp - Rs 495.69
Delhi
26
ramped up to become one of the largest private sector players with 112 Auto LPG Dispensing Stations (ALDS) across India
like Andhra Pradesh, Karnataka, Tamil Nadu, Maharashtra and other states like Gujarat and West Bengal
by end of Fiscal 2018
State
Karnataka 33 Tamil Nadu 31 Maharashtra 24 Andhra Pradesh 11 Rajasthan 5 Gujarat 4 West Bengal 3 Madhya Pradesh 1 Total 112 ALDS across 8 states pan India
Expansion Plans in ALDS to Cater the Growing Demand
27
Maharashtra, with higher Government thrust on Auto LPG and favourable policies
Auto LPG – Fares Better Than its Counterparts
28
Parameter Petrol CNG LPG Verdict Cost per unit Rs 79/ltr Rs 44/kg Rs 36/Ltr LPG Cost of conversion of vehicle NA Rs 35,000 - 40,000 Rs 16,000 – 25,000 Petrol Emissions Base 22% lower than Petrol 22% lower than Petrol LPG Fuel Quality Stable Varying composition as it is not processed and supplied directly from wells Stable, since produced in refineries under controlled conditions LPG Filling Process ~ 4-5 mins ~ 5-10 mins ~ 3-4 min LPG Vehicle Performance Base 15-20% drop from Petrol 3-5% drop from Petrol LPG Ease of Transportation Requires a pipeline laid, for transportation Can be made available anywhere Cost of dispensing infrastructure Rs 15 mn at an existing retail
Rs 4 mn at an existing retail outlet LPG
Source: iac.org.in
29
For more information visit: www.confidencegroup.co
vgaurang@stellar-ir.com / pooja.sharma@stellar-ir.com
vimalparwal@confidencegroup.co / niralisanghvi@confidencegroup.co