SLIDE 1
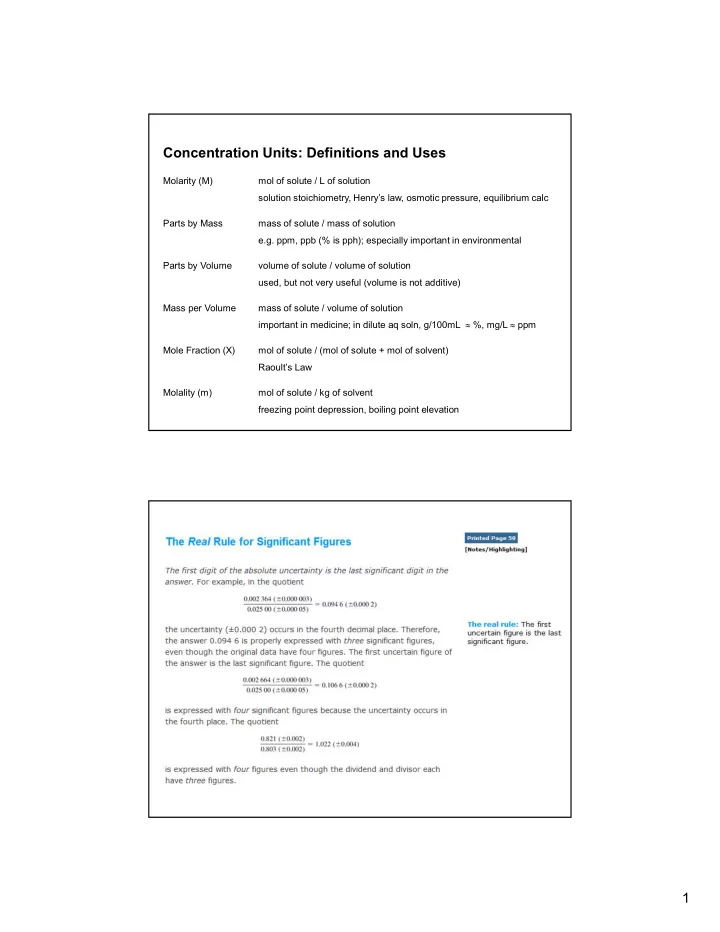
1 Concentration Units: Definitions and Uses
Molarity (M) mol of solute / L of solution solution stoichiometry, Henry’s law, osmotic pressure, equilibrium calc Parts by Mass mass of solute / mass of solution e.g. ppm, ppb (% is pph); especially important in environmental Parts by Volume volume of solute / volume of solution used, but not very useful (volume is not additive) Mass per Volume mass of solute / volume of solution important in medicine; in dilute aq soln, g/100mL %, mg/L ppm Mole Fraction (X) mol of solute / (mol of solute + mol of solvent) Raoult’s Law Molality (m) mol of solute / kg of solvent freezing point depression, boiling point elevation
SLIDE 2
2
https://www2.chemistry.msu.edu/faculty/reusch/virttxtjml/spect rpy/nmr/nmr1.htm
SLIDE 3
3
http://scratch.mit.edu/projects/traincode/705416
SLIDE 4
4
https://www.math10.com/en/algebra/probabilities/binomial- theorem/binomial-theorem.html
https://wonderopolis.org/wonder/what-is-pascals-triangle
SLIDE 5 5
5000 10000 15000 20000 25000 30000 35000 40000 45000 1 2 3 4 5 6 7 8 9 10 11 12 13 14 15 16 17 5000 10000 15000 20000 25000 30000 35000 40000 45000 1 2 3 4 5 6 7 8 9 1011121314151617
SLIDE 6
6
Defining a new dependent coordinate (z) in terms of x, the mean, and the standard deviation and plotting y versus z gives the graph on the right.
(p. 70, Harris 8e)
SLIDE 7
7
https://www.chemistry.mcmaster.ca/esam/Chapter_3/section_2.html Radial wavefunction for 1s orbit. Note how amount of electron density decreases in each band out from the nucleus but never reaches zero. https://www.chemistry.mcmaster.ca/esam/Chapter_3/section_2.html
SLIDE 8
8
SLIDE 9 9
Three common cases for using the t test to compare measured values:
- 1. the mean of one sample is compared to a “known” value
- r established standard
Example: molarity “known” to be 0.1147 M
- 2. the mean of one sample is compared to the mean of
another sample
Examples: concentration of phenol in Hogtown Creek; average height of CHM 3120 students
- 3. comparing individual data points in a set of paired
measurements; this approach is commonly used to compare different analytical techniques (p. 78, Harris 8e)
SLIDE 10 10
2 4 6 8 10 12 14 16 57-58 59-60 61-62 63-64 65-66 67-68 69-70 71-72 73-74 75-76
Number of Students Height (inches)
Student Heights, CHM 3120, Spring 2019
SLIDE 11 11
Three common cases for using the t test to compare measured values:
- 1. the mean of one sample is compared to a “known” value
- r established standard
Example: molarity “known” to be 0.1147 M
- 2. the mean of one sample is compared to the mean of
another sample
Examples: concentration of phenol in Hogtown Creek; average height of CHM 3120 students
- 3. comparing individual data points in a set of paired
measurements; this approach is commonly used to compare different analytical techniques (p. 78, Harris 8e)
SLIDE 12
12 175 mg/dL x (1 g/1000 mg) x (10 dL/1L) = 1.75 g/L
SLIDE 13
13
SLIDE 14 14
Rank the following solutions in order of increasing pH: 0.1 M HNO2, 0.1 M HNO3, 0.1 M NaNO2, 0.1 M NaNO3, 0.1 M NaOH
- A. HNO2 < HNO3 < NaNO2 < NaNO3 < NaOH
- B. HNO3 < HNO2 < NaNO2 < NaNO3 < NaOH
- C. HNO2 < HNO3 < NaNO3 < NaNO2 < NaOH
- D. HNO3 < HNO2 < NaNO3 < NaNO2 < NaOH
- E. HNO3 < HNO2 < NaOH < NaNO3 < NaNO2
SLIDE 15
15
SLIDE 16 16
2 4 6 8 10 12 14 10 20 30 40 50 60 70 80 90 100
pH Volume of 0.10 M NaOH added (mL) HCl HNO2
SLIDE 17
17
SLIDE 18 18
Rank the following solutions in order of increasing pH: 0.1 M HNO2, 0.1 M HNO3, 0.1 M NaNO2, 0.1 M NaNO3, 0.1 M NaOH
- A. HNO2 < HNO3 < NaNO2 < NaNO3 < NaOH
- B. HNO3 < HNO2 < NaNO2 < NaNO3 < NaOH
- C. HNO2 < HNO3 < NaNO3 < NaNO2 < NaOH
- D. HNO3 < HNO2 < NaNO3 < NaNO2 < NaOH
- E. HNO3 < HNO2 < NaOH < NaNO3 < NaNO2
SLIDE 19
19
SLIDE 20
20
SLIDE 21 21
A 50 mL aliquot of 0.10 M HNO2(aq) is titrated with 0.10 M NaOH(aq) HNO2(aq) + OH(aq) NO2
(aq) + H2O(l)
The pKa of HNO2 is 3.15. After 15 mL of OH(aq) is added, the pH will be…
- A. less than 3.15
- B. 3.15
- C. greater than 3.15, but less than 7
- D. greater than 7, but less than 10.85
- E. greater than 10.85
SLIDE 22 22
A 50 mL aliquot of 0.10 M HNO2(aq) is titrated with 0.10 M NaOH(aq) HNO2(aq) + OH(aq) NO2
(aq) + H2O(l)
The pKa of HNO2 is 3.15. After 70 mL of OH(aq) is added, the pH will be…
- A. less than 13.00
- B. 13.00
- C. greater than 13.00