
SLIDE 1
1
.
Computational Methods in Systems Biology
Nir Friedman Maya Schuldiner
2
What is Biology?
“A branch of knowledge that deals with living
- rganisms and vital processes”
The hottest scientific frontier of our times
- Many great processes have been figured out
- Much is still unknown
Tremendous impact on Medicine
- Both diagnosis, prognosis, and treatment
3
Bakers Yeast Saccharomyces Cereviciae
- Used to make bread and beer
- The simplest cell that still resembles human cells
4
Biological Systems are Complex
- The System is NOT just a sum of its parts
5
What is Systems Biology?
“Systems biology is the study of the interactions between the components of a biological system, and how these interactions give rise to the function and behavior of that system”
- The last decades lead to revolution on how we can
examine and understand biological systems Characterized by
- High-throughput assays
- Integration of multiple forms of experiments & knowledge
- Mathematical modeling
6
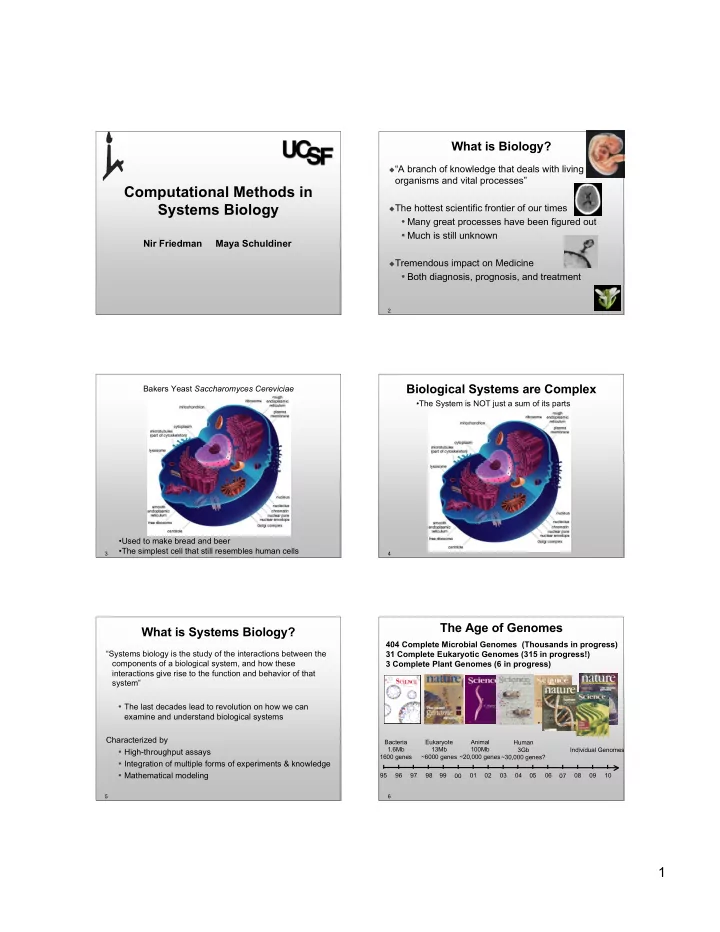
The Age of Genomes
Bacteria 1.6Mb 1600 genes 95 96 97 98 99 00 01 Eukaryote 13Mb ~6000 genes Animal 100Mb ~20,000 genes Human 3Gb ~30,000 genes? 02 10 03 04 05 06 07 08 09
404 Complete Microbial Genomes (Thousands in progress) 31 Complete Eukaryotic Genomes (315 in progress!) 3 Complete Plant Genomes (6 in progress)
Individual Genomes?