comprehensive radiation monitoring plan and
play

Comprehensive Radiation Monitoring Plan and Spatiotemporal - PowerPoint PPT Presentation

Comprehensive Radiation Monitoring Plan and Spatiotemporal Distribution of Information Disclosure Ambient Dose Rates Radiation Dose Map Readings of nationwide radiation monitoring are shown in maps. With location search function and


  1. Comprehensive Radiation Monitoring Plan and Spatiotemporal Distribution of Information Disclosure Ambient Dose Rates Radiation Dose Map Readings of nationwide radiation monitoring are shown in maps. With location search function and location memory function * Select a prefecture. Airborne monitoring Sea area monitoring Real‐time Dose Measurement System Monitoring using airplanes is conducted Relevant ministries and agencies Ambient dose rates measured at mobile on a regular basis, centered on conduct monitoring of seawater, marine monitoring posts nationwide and by the Fukushima Prefecture. The results are soil and marine organisms and release Real‐time Dose Measurement System are compiled into ambient dose rate maps measurement results. shown in a map. and released. Nuclear Regulation Authority; Monitoring information of environmental radioactivity level: http://radioactivity.nsr.go.jp/ja/ (in Japanese) Comprehensive Monitoring Plan: http://radioactivity.nsr.go.jp/ja/list/204/list‐1.html (in Japanese)
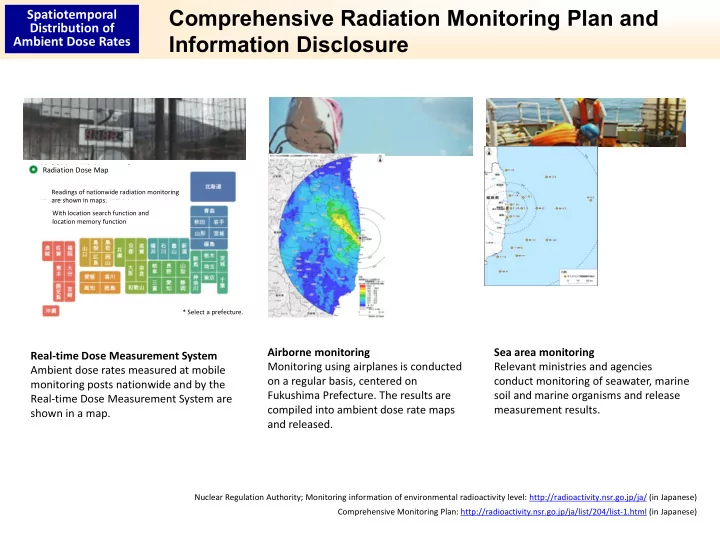
  2. Spatiotemporal Distribution of Ambient Dose Rates within the 80‐km Zone of Distribution of Tokyo Electric Power Company (TEPCO)'s Fukushima Daiichi NPS Ambient Dose Rates * This map contains ambient dose rates by natural radionuclides. Legend Ambient dose rate at 1 m from the ground surface [Converted into values as of Oct. 15, 20116] Areas where readings were not obtained Background image: Geospatial Information Authority of Japan Released by the Ministry of Education, Culture, Sports, Science Released by the Nuclear Regulation Authority on Feb. 13, 2017 and Technology (MEXT) on Dec. 16, 2011

  3. Spatiotemporal Distribution of Ambient Dose Rates in Fukushima Prefecture and Distribution of Neighboring Prefectures Ambient Dose Rates * This map contains ambient dose rates by natural radionuclides. Legend Ambient dose rate at 1 m from the ground surface [Converted into values as of Nov. 18, 2016] Legend Ambient dose rate at 1 m from the ground surface [Converted into values as of Nov. 5, 2011] Snow distribution Areas where readings Areas where readings were not obtained were not obtained Background image: Denshi Kokudo Background image: Geospatial Information Authority of Japan Released by the Ministry of Education, Culture, Sports, Science Released by the Nuclear Regulation Authority on Feb. 13, 2017 and Technology (MEXT) on Dec. 16, 2011

Download Presentation
Download Policy: The content available on the website is offered to you 'AS IS' for your personal information and use only. It cannot be commercialized, licensed, or distributed on other websites without prior consent from the author. To download a presentation, simply click this link. If you encounter any difficulties during the download process, it's possible that the publisher has removed the file from their server.

Recommend


More recommend