Compositions and Properties of Titanium and Zinc Incorporated PBG - - PowerPoint PPT Presentation

compositions and properties of titanium and zinc
SMART_READER_LITE
LIVE PREVIEW

Compositions and Properties of Titanium and Zinc Incorporated PBG - - PowerPoint PPT Presentation

Compositions and Properties of Titanium and Zinc Incorporated PBG Glass Code Glass Composition (mol%) Calcium Sodium Phosphorous Titanium Zinc Oxide Oxide Pentoxide Dioxide Oxide


slide-1
SLIDE 1

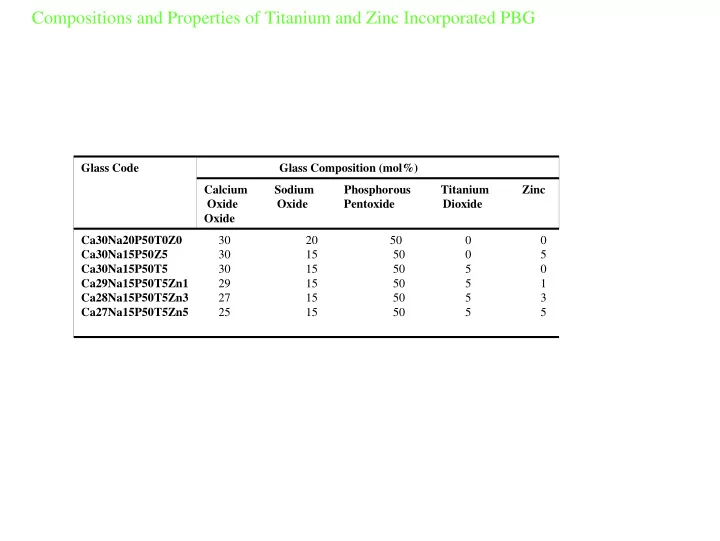
Glass Composition (mol%) Glass Code Calcium Sodium Phosphorous Titanium Zinc Oxide Oxide Pentoxide Dioxide Oxide Ca30Na20P50T0Z0 Ca30Na15P50Z5 Ca30Na15P50T5 Ca29Na15P50T5Zn1 Ca28Na15P50T5Zn3 Ca27Na15P50T5Zn5 30 20 50 0 0 30 15 50 0 5 30 15 50 5 0 29 15 50 5 1 27 15 50 5 3 25 15 50 5 5

Compositions and Properties of Titanium and Zinc Incorporated PBG

slide-2
SLIDE 2

1 and 7 Days HOS Viability

slide-3
SLIDE 3

1 Day HOS Attachment

slide-4
SLIDE 4

7 Days HOS Attachment

slide-5
SLIDE 5
  • 0.5
  • 0.4
  • 0.3
  • 0.2
  • 0.1

0.1 0.2 0.3 0.4 0.5 0.6 0.7 0.8 0.9 1 1.1 1.2 1.3 1.4 1.5 1.6 T0Z0 Z5 Thermanox T5 T5Z1 T5Z3 T5Z5

Glass Extract Relative Growth

Day 1 Day 4 Day 7

Effect of Glass Extract on Cell Proliferation

slide-6
SLIDE 6
  • 0.2
  • 0.1

0.1 0.2 0.3 0.4 0.5 0.6 0.7 0.8 0.9 1 1.1 1.2 1.3 1.4 1.5 1.6 T Z Z 5 T h e r m a n

  • x

T 5 T 5 Z 1 T 5 Z 3 T 5 Z 5

Glass Code Relative Growth

Day 1 Day 3 Day 5 Day 7 Day 10 Day 14 Day 21

Effect of Composition on Cell Proliferation

slide-7
SLIDE 7

Ca16Na39P45 Ca16Na38P45Ga1 Ca16Na36P45Ga3 Ca16Na34P45Ga5 16 39 45 16 38 45 1 16 36 45 3 16 34 45 5 Calcium Sodium Phosphorous Oxide Oxide Pentoxide Ga Glass composition (mol%) Glass code

♦Novel gallium-doped phosphate based glasses(PBGs) were prepared using conventional melt quenching method ♦Both density and glass transition temperature (Tg) was found to increase as the Ga content increased in the glass system ♦Degradation rate of glasses in water found to decrease with the increase of Ga content. pH was found to maintain at neutral for 3 and 5 mol% Ga doped PBGs but showed initial increase for 0 and 1 mol% Ga doped PBGs ♦Calcium and sodium ion release from the glasses were analysed using IC ♦Gallium and phosphorous release from the glasses were analysed using ICP-MS ♦Antimicrobial activity of these glasses against E. coli, P. aeruginosa and S. aureus were tested by disc diffusion assay ♦The antibacterial effect was found to decrease as the Ga content increased in the glass system, with

Ca16Na38P45Ga1 showing maximum bactericidal effect against E. coli, P. aeruginosa and S. aureus

Summary

slide-8
SLIDE 8

Density and glass transition temperatures as a function of gallium oxide content (mol%)

Characterization of Ga-doped phosphate glasses

2.5 2.55 2.6 2.65 2.7 2.75 2.8 0.5 1 1.5 2 2.5 3 3.5 4 4.5 5 Gallium Oxide Content (mol%) Density (g.cm-3) 335 340 345 350 355 360 365 370 375 Glass Transition Temperature ( 0C) Density Tg

slide-9
SLIDE 9

Dissolution and pH analysis of the 0, 1, 3 and 5 mol% Ga-doped PBGs.

(a) Weight loss vs. time

y = 0.0417x R2 = 0.9792 y = 0.0236x R2 = 0.9866 y = 0.0073x R2 = 0.9851 y = 0.0037x R2 = 0.995 1 2 3 4 5 6 24 48 72 96 120 144 Time(hrs) Weight loss (mg.mm

2)

Ga0 Ga1 Ga3 Ga5 6 7 8 9 20 40 60 80 100 120 Time(hrs) pH Ga0 Ga1 Ga3 Ga5

pH vs.time

slide-10
SLIDE 10

Cumulative ion release profiles of the 0, 1, 3 and 5 mol% Ga-doped PBGs

(a) calcium ion release vs. time (b) sodium ion release vs. time (c) phosphorous ion release vs. time and (d) gallium ion release vs. time

y = 2.7145x R2 = 0.936 y = 1.3007x R2 = 0.9531 y = 0.1765x R2 = 0.1549 y = 0.2764x R2 = 0.9477

50 100 150 200 250 24 48 72 96 120 144 Time(hrs) Na ion release (ppm) 1 3 5

y = 0.4049x R2 = 0.9843 y = 0.0983x R2 = 0.9167 y = 0.063x R2 = 0.8143 y = 0.7058x R2 = 0.9555

10 20 30 40 50 60 24 48 72 96 120 144 Time(hrs) Ca ion release (ppm) 1 3 5

y = 50.905x R2 = 0.9489 y = 35.016x R2 = 0.9624 y = 6.0693x R2 = 0.9217 y = 1.2474x R2 = 0.9974

500 1000 1500 2000 2500 3000 3500 4000 4500 5000 24 48 72 96 120 144 Time(hrs) P ion release (ppm) 1 3 5

y = 0.3935x R2 = 0.8336 y = 0.2334x R2 = 0.9313 y = 0.1143x R2 = 0.9973 y = 0.0024x R2 = 0.9798

10 20 30 40 50 60 24 48 72 96 120 144 Time(hrs) Ga ion release (ppm) 1 3 5

(a) (b) (c) (d)

slide-11
SLIDE 11

Antimicrobial assay of Ga-doped phosphate glasses

Disc diffusion assay conducted on 0, 1, 3 and 5 mol% Ga-doped PBGs against Staphylococcus aureus, Escherichia coli, Pseudomonas aeruginosa, methicillin-resistant Staphylococcus aureus (MRSA) and Clostridium difficile

5 10 15 20 25 30 1 3 5 Ga (mol%) Diameter (mm) E.coli P.aeruginosa S.aureus MRSA C.difficle

slide-12
SLIDE 12

Effect of Ga-doped phosphate glasses on P. aeruginosa

The effect of 0, 1 and 3 mol% Ga-doped PBGs

  • n the viability of suspensions of

Pseudomonas aeruginosa.

7 7.25 7.5 7.75 8 8.25 4 12 Time(hrs) Log CFU/mm2 control C16Ga0 C16Ga1 C16Ga3

slide-13
SLIDE 13

Ca30Na20P50 Ca30Na17P50Ag3 Ca30Na15P50Ag5 30 20 50 30 17 50 3 30 15 50 5 Calcium Sodium Phosphorous Oxide Oxide Pentoxide Ag Glass composition (mol%) Glass code

♦P. aeruginosa causes a range of biofilm-associated infections such as Cystic fibrosis ♦Phosphate Based Glasses doped with silver were used in the CDFF to study their effect on these biofilms ♦Biofilms growth were analyzed using scanning electron microscope (SEM) ♦The effect of silver on the biofilms were tested by counting P. aeruginosa colony-forming units (CFUs) at different time ♦ ‘Live and dead’ cell distribution in the biofilm was determined by confocal laser scanning microscope (CLSM).

Constant Depth Film Fermentor (CDFF)

Summary

slide-14
SLIDE 14

The effect of silver on the biofilms; in terms of P. aeruginosa colony-forming units

4 5 6 7 8 25 50 75 100 125 150 Time (hours) Log (CFU.mm

  • 2)

HA Ag- 5 mol% Ag

Log10 CFU/mm2 of P. aeruginosa in biofilms formed on hydroxyapatite discs (HA), Ca30Na20P50 disc (Ag-), and Ca30Na15P50Ag5 discs (5 mol% Ag).

slide-15
SLIDE 15

From Mg-substituted hydroxyapatites to bones: first 43Ca NMR investigations

slide-16
SLIDE 16

Crystal structure of hydroxyapatite

a b c

Ca10(PO4)6(OH)2

P21/b Ca P O H Ca(1) Ca(2) HO- columns PO4

3-

O1 O1 O2 O1 O2 O2 O3 O3 O3 OH O3’ O3 O3’ O1 O2 O3

Ca(1) site Ca(2) site

1- Mg-HA

slide-17
SLIDE 17

Synthesis and characterisation of Mg-substituted HA

Ca(NO3)2.6H2O + Mg(NO3)2.4H2O + NH4H2PO4

1/ pH ~ 10.0, 100˚C, 5h 2/ centrifugation / washing 3/ 100˚C drying under vacuum, 12h

“Ca10-xMgx(PO4)6(OH)2”

x = 0, 0.25, 0.5, 0.75, 1.0, 1.25, 1.5, 2.0

Elemental analyses, SEM, XRD, TG, DTA, IR, Raman, SSA measurements High-temperature XRD Catalytic studies Solid State NMR (31P, 1H, 43Ca, 25Mg )

O1 O1 O2 O1 O2 O2 O3 O3 O3

Ca(1) site

OH O3’ O3 O3’ O1 O2 O3

Ca(2) site

Mg2+ ? 2- Mg-HA

slide-18
SLIDE 18

700 750 800 850 900 950 1000 1050 1100 2.5 5 7.5 10 12.5 15 17.5 20 22.5

x(Mg) (%) T (˚C) DTA XRD

Temperature of formation of whitlockite depends on Mg-content Indication of the site of incorporation of Mg ?

  • Mg known to enter the Ca(5) site in whitlockite
  • Environment of one Ca site similar in HA (Ca(1)) and in whitlockite (Ca(5))
  • Transformation into whitlockite favoured by higher Mg contents

High-temperature XRD characterisation

  • f Mg-substituted HA

Mg seems to have been incorporated in Ca(1) site

O1 O1 O2 O1 O2 O2 O3 O3 O3

Ca(1) site

OH O3’ O3 O3’ O1 O2 O3

Ca(2) site

  • J. Knowles, EDI, London

3- Mg-HA

slide-19
SLIDE 19

C CH3 C H3C OH CH methylbutynol (MBOH) H3C C H3C O acetone HC CH acetylene

alkaline surface +

Mg-HA

Catalytic properties of Mg-substituted HA

In Mg-HA, the reactivity of the OH group is expected to change if Mg enters the Ca(2) site No clear correlation between the catalytic activity and the % of Mg in the lattice Reaction catalysed by alkaline surfaces (presence of OH groups), HA have been shown to catalyse this reaction

OH O3’ O3 O3’ O1 O2 O3

Confirmation that Mg has been incorporated in Ca(1) site

  • H. Pernot et al, UPMC, Paris

4- Mg-HA

slide-20
SLIDE 20

43Ca solid-state NMR of Ca10(PO4)6(OH)2 Isotope Spin Natural abundance(%) Quadrupole moment Q Relative receptivity

43Ca

7/2 0.135

  • 4.08

4.19*10-5

fwhm = 963 Hz fwhm = 1042 Hz

5- Mg-HA Quadrupolar interaction main cause of line-broadening

8.45 T 4 kHz, D1 = 1s RAPT-1pulse NS = 180 000, LB = 80 14.1 T 4 kHz, D1 = 1s RAPT-1pulse NS = 81 000, LB = 80 18.75 T 4 kHz, D1 = 0.1s RAPT-1pulse NS = 1197824, LB = 80

ppm

  • 250
  • 200
  • 150
  • 100
  • 50

50 100 150 200

slide-21
SLIDE 21

O1 O1 O2 O1 O2 O2 O3 O3 O3 O1 O1 O2 O1 O2 O2 O3 O3 O3

OH O3’ O3 O3’ O1 O2 O3

Ca(2) Ca(1)

Shorter Ca-O average distance Smaller coordination number 6 Calcium atoms Longer Ca-O average distance Larger coordination number 4 Calcium atoms

43Ca solid-state NMR of HA

6- Mg-HA

δiso = 10.6 ppm Cq = 2.7 kHz ηq = 0.65 δiso = -3.4 ppm Cq = 2.5 kHz ηq = 0.35

(ppm)

  • 250
  • 200
  • 150
  • 100
  • 50

50 100 150 200 (ppm)

  • 250
  • 200
  • 150
  • 100
  • 50

50 100 150 200

18.75 T 14.1 T

43Ca isotopic labelling of non-substituted HA planned

to confirm the proposed distinction between both sites.

slide-22
SLIDE 22

43Ca solid-state NMR of

Ca10-xMgx(PO4)6(OH)2 (x ~ 1.0)

Difficult to conclude on the site of incorporation of Mg with 43Ca NMR at this stage go to higher fields. HA Mg-HA 7- Mg-HA

Change in lineshape: Decrease at the higher frequencies 14.1 T 4 kHz RAPT-1pulse

slide-23
SLIDE 23

8- Bone

Hierarchal structure of bone

Whole bone Fibril arrays Mineralized collagen fibrils HA crystals Several levels

  • f organisation

3 main components:

  • Mineral phase

(carbonated HA)

  • Organic phase

(collagen)

  • Water
  • ther components:

Non collageneous proteins

Weiner, Annu. Rev. Mater. Sci. 1998, 28, 271

slide-24
SLIDE 24

9- Bone

Structural studies on bones

  • M. Duer, University of Cambridge

SEM (+ TEM) IR Solid state NMR

1H NMR: Signals of water and

  • f the organic phase mainly

31P NMR: Mineral phase (mainly apatite) 13C NMR: Organic phase (mainly collagen)

EDXS Presence of C, O, N, Ca, P mainly Ca/P ratio bigger than in HA

ppm

  • 30
  • 20
  • 10

10 20 30 40

  • A. Wong, R. Dupree, Warwick University
slide-25
SLIDE 25

10- Bone

Towards 43Ca NMR studies of bones

Calcium in bones Model compounds

Mineral phase:

  • Apatite
  • Ca2+ near HPO4

2- anions

Mineral phase:

  • « Pure » apatite (Ca10(PO4)6(OH)2)
  • Substituted apatite (Mg-HA, Na-HA)
  • Brushite (CaHPO4.2H2O)

Organic environment:

  • Ca – L-glutamate tetrahydrate
  • Ca-phosphoprotein ??

Organic environment:

  • Ca-glutamate moieties
  • Ca-phosphoproteins

Can 43Ca solid-state NMR give insight into the different environments of Ca2+ in bones ?

slide-26
SLIDE 26

11- Bone

43Ca NMR: bone vs hydroxyapatite

2 2 2 2 2

csd 2 1 2 q 2 2 1 2 2 csd q 1

W B B W B B ) (LW W W ) (LW ⎟ ⎠ ⎞ ⎜ ⎝ ⎛ + ⎟ ⎠ ⎞ ⎜ ⎝ ⎛ = + =

Stronger chemical-shift dispersion in bone Wq = 806 Hz, Wcsd = 718 Hz Wq = 944 Hz, Wcsd = 458 Hz Multiple-field analysis Second order quadrupolar broadening (Wq) vs Chemical Shift dispersion (Wcsd)

Bone Apatite

slide-27
SLIDE 27

12- Bone

43Ca NMR studies of bones and related compounds

  • C. Gervais, UPMC, Paris
  • A. Wong, R. Dupree,

Warwick University 14.1 T 4 kHz RAPT-1pulse

slide-28
SLIDE 28

Perspectives

Bone Mg-HA

43Ca NMR

Ca-phosphoproteins: find a model compound Ca-phosphates: more compounds to analyze (collaboration with C. Gervais, UPMC, Paris) Bone: try higher magnetic field

Complementary measurements:

XRD Ba-HA, Aldrich-HA Rietveld studies on Mg-HA and Ba-HA ? TEM + EDXS Catalysis: Results to confirm on another Ba-HA

Further studies to perform Write first paper on synthesis and characterisations (other than NMR)

slide-29
SLIDE 29

Two-Dimensional 31P and 23Na NMR of Sodium Calcium Phosphate Ceramics

Luke O’Dell

slide-30
SLIDE 30

(ppm)

  • 30
  • 20
  • 10
  • 15
  • 25
  • 35

31P MAS NMR of (CaO)0.4(Na2O)0.1(P2O5)0.5

→ XRD shows the presence of NaCa(PO3)3 and Ca(PO3)3

slide-31
SLIDE 31

31P Refocused INADEQUATE

Utilises the J-coupling through-bond interaction → Identifies phosphorous sites directly linked by P-O-P bonds Dipolar coupling removed by MAS*

slide-32
SLIDE 32
slide-33
SLIDE 33

(ppm)

  • 30
  • 20
  • 10
  • 15
  • 25
  • 35
slide-34
SLIDE 34

Ca(PO3)2 NaCa(PO3)3 ???

slide-35
SLIDE 35

23Na MAS NMR

Isotropic chemical shift = (4.5 ± 0.5) ppm Quadrupolar coupling constant = (2.10 ± 0.05) MHz Asymmetry parameter = 0.95 ± 0.02

slide-36
SLIDE 36

23Na Multiple Quantum MAS

Refocuses 2nd order quadrupolar interaction for the central transition 1st order quadrupolar interaction is removed by MAS → Obtain a spectrum free of quadrupolar broadening in the second dimension → Overlapping lines can be resolved unambiguously

slide-37
SLIDE 37

23Na 3QMAS of (ZnO)0.1(CaO)0.3(Na2O)0.1(P2O5)0.5

slide-38
SLIDE 38

Summary

31P refocused INADEQUATE allows identification of phosphate chains 23Na MQMAS allows different sodium-containing phases to be observed

Future Work

Short paper on 31P INADEQUATE results What is the effect of adding the ZnO?

63Cu NMR

slide-39
SLIDE 39

Mesoporous Silicate Characterisation and Modification for Protein Delivery

Sen Lin 1st Year PhD

Supervisor: Dr. Julian Jones Sponsor: NovaThera Ltd.

Department of Material Imperial College London

slide-40
SLIDE 40

Project Aim & Tasks

  • To optimise rH protein delivery with Sol-Gel

derived mesoporous bioactive glass

  • Characterisation of Glass Structure
  • Mesopore Modification
  • Surface Modification
  • To maximise protein loading capacity
  • To sustain protein release
  • To reserve protein function
slide-41
SLIDE 41

Microscopy Characterisation

TEM TEM SEM AFM TEM SEM SEM SAXS WAXS RAMAN NMR Orcel et al. and Himmel et al. FIB

slide-42
SLIDE 42

Quantitative Characterisation

Heat Treatment Effects on Surface Area

0.00 20.00 40.00 60.00 80.00 100.00 120.00 140.00 160.00 180.00 200.00 Before Stabilisation After Stabilisation After 2hr Sintering Surface Area m2/g

Heat Treatment Effects on Modal Pore Size

0.00 2.00 4.00 6.00 8.00 10.00 12.00 14.00 16.00 18.00 20.00 Before Stabilisation After Stabilisation After 2hr Sintering M

  • dal Pore Size nm

Nitrogen Adsorption Porosity Analysis

Heat Treatment Effects on Pore Volume

0.0000 0.1000 0.2000 0.3000 0.4000 0.5000 0.6000 0.7000 0.8000 Before Stabilisation After Stabilisation After 2hr Sintering Pore Volume cc/g

Nitrate Decomposition

slide-43
SLIDE 43

Calcium Nitrate Decomposition

Heat Treatment Effects on Surface Area

0.00 100.00 200.00 300.00 400.00 500.00 600.00 700.00 800.00 900.00 Before Stabilisation After Stabilisation After 2hr Sintering Surface Area m2/g 70S30C 100S

Heat Treatment Effects on Total Pore Volume

0.0000 0.1000 0.2000 0.3000 0.4000 0.5000 0.6000 0.7000 0.8000 Before Stabilisation After Stabilisation After 2hr Sintering Total Pore Volume cc/g 70S30C 100S

Silica Ca(NO3)2

slide-44
SLIDE 44

Calcium Nitrate Crystalline before Stabilisation

XRD Pattern of 70S30C without Stabilisation

200 400 600 800 1000 1200 1400 1600 1800 2000 5 15 25 35 45 55 65 75 85 95 2θ /° In te n sity

Crystalline Lattice Pattern before Stabilisation under TEM (scale bar 5 nm)

No Striking Peaks

slide-45
SLIDE 45

Acknowledgements

  • Dr Julian Jones, Supervision
  • NovaThera Ltd., Financial Support and Material

provision

  • Dr. Ardakani, SEM and TEM
  • Mr Tucker, Nitrogen Adsorption Support
  • Mr Teng, AFM
  • Mr Chater, FIB cutting and imaging
  • Mr Sweeney, XRD

Thank you All!

slide-46
SLIDE 46

XAS of Iron-phosphate Glass

Dong Qiu University of Kent

slide-47
SLIDE 47

Nominal composition

Glass code P2O5 (mol%) CaO (mol%) Na2O (mol%) Fe2O3 (mol%) S_Fe_1 50 30 19 1 S_Fe_2 50 30 18 2 S_Fe_3 50 30 17 3 S_Fe_4 50 30 16 4 S_Fe_5 50 30 15 5

slide-48
SLIDE 48

Fe K-edge XANES 7100 7120 7140 7160 7180 7200 7220

  • 3
  • 2
  • 1

1

Normalized absorbance Energy /eV

FeO Fe3O4 Fe2O3 S_Fe_1 S_Fe_2 S_Fe_3 S_Fe_4 S_Fe_5 Fe2 (SO4)3

slide-49
SLIDE 49

Fe pre-edge feature 7108 7112 7116 7120

  • 0.09
  • 0.06
  • 0.03

0.00 0.03

Normalised absorbance Energy /eV

FeO Fe2O3 S_Fe_2 S_Fe_5 Fe2 (SO4)3

slide-50
SLIDE 50

Fe coordination information

7112.5 7113.0 7113.5 7114.0 7114.5 0.0 0.1 0.2 0.3 0.4

Pre-edge area Pre-edge position /eV

: Fe(III) in Td coordination : Fe(III) in C3V coordination : Fe(III) in Oh coordination : Fe(III) in Oh coordination measured in this study : iron-phosphate glasses samples

slide-51
SLIDE 51

Fe EXAFS

5 6 7 8 9 20 40 60 80

k/Å

  • 1

k

3χ(k)

2 4 6 8 10 30 60 90 120

r /Å FTk

3χ(k)

From top to bottom: S_Fe_1, S_Fe_2, S_Fe_3, S_Fe_4, S_Fe_5 glasses: k3 weighted EXAFS (left) and Fourier transform (right). Slide lines: experimental data; dashed lines: theoretical simulation. Averaging Fe-O distance: 1.95 Å Averaging Fe…P separation:3.19 Å

slide-52
SLIDE 52
  • Future work:

Write paper based on this work Beam time next week on Gallium phosphate glasses Work on incorporating calcium chelating agent into phosphate-silicate network (samples are ready for characterization)

  • Conclusion:

Fe is in Fe(III) oxidation state Fe is located in a distorted octahedral coordinated oxygen cage Fe is incorporated in the phosphate network

slide-53
SLIDE 53

The structure of calcium phosphate glass, Ca(PO3)2

Kate Wetherall

slide-54
SLIDE 54

Neutron Diffraction

1 2 3 4 5 2 4 6 8

T(r) / barns Å

  • 1

r / Å

D M Pickup, I Ahmed, P Guerry, JC Knowles, M E Smith and R J Newport, The structure of phosphate glass biomaterials from neutron diffraction and 31P nuclear magnetic resonance data. Journal of Physics: Condensed Matter, in press.

X-ray Diffraction

slide-55
SLIDE 55

RMC

Correlation R / Å (±0.2) N (±0.5) P-O 1.6 4 Ca-O 2.3 5 O-O 2.5 4.5 Ca-O 3 1 P-P 3 2 O-O 3.5 8.5 P-Ca 3.6 5 Ca-Ca 3.7 2 5 10 15 20

  • 0.4
  • 0.2

0.0 0.2 0.4 10 20 30 40

  • 0.1

0.0 0.1

X-ray Diffraction RMC Q / Å

  • 1

i(Q) / atoms barn

  • 1 steradian
  • 1

Q / Å

  • 1

Neutron Diffraction RMC

slide-56
SLIDE 56

Neutron Diffraction

1 2 3 4 5 0.0 0.5 1.0 1.5 2.0

T(r) / barns Å

  • 1

r / Å

1 2 3 4 5 2 4 6 8

T(r) / barns Å

  • 1

r / Å

X-ray Diffraction

Pickup, D.M., et al., The structure of phosphate glass biomaterials from neutron diffraction and 31P nuclear magnetic resonance data. Journal of Physics: Condensed Matter, in press.

slide-57
SLIDE 57

Structural Characterisation

Differentiated two Ca-O bond lengths, a shorter distance of ~2.34 Å has a coordination of ~5.4 and a longer distance of ~2.80 Å has a coordination of ~1.4. The total Ca-O coordination is ~6.8. This coordination relates to the crystal structure of a capped trigonal prism. Onb coordination with Ca is ~1.7, therefore for every Onb that is only bonded to one Ca there are eight that are bonded to two Ca . From the correlation distance an O-Ca-O bond angle between 72° and 89° is calculated which indicates a distorted octahedral structure – close to the capped trigonal prism indicated.

slide-58
SLIDE 58

Sol-Gel Partnership Meeting

Friday 20th July 2007 Department of Materials Imperial College London

Kent ● Warwick ● Imperial ● UCL

slide-59
SLIDE 59

Zr K-edge EXAFS of Zr phosphate glass

1 2 3 4 5 6 7 8 9 10 10 20 30 40 50 60 1 2 3 4 5 6 7 8 9 10 11 12 13 14 15

  • 8
  • 6
  • 4
  • 2

2 4 6 8 10 12 14

FT[chi(k)] Experimental Theory r (ang) k

3 chi(k)

Experimental Theory k (ang-1)

xLi2O:2ZrO2:40P2O5

x=56 x=58 x=56 x=58

Correlation R (Å) N DWF ± 0.02 ± 20% ± 0.005 Sample 56 Zr-O 2.06 5.6 0.010 Zr-P 3.64 1.7 0.010 Zr-O 4.63 2.1 0.005 Sample 58 Zr-O 2.06 5.9 0.011 Zr-P 3.64 2.3 0.008 Zr-O 4.63 2.5 0.006

slide-60
SLIDE 60

Zr-O, -P agreement

Correlation R (Å) N DWF Zr-O 2.06 5.6 0.011 Zr-P 3.64 1.7 0.010

Zr(P2O7) Zr-O average distance is 2.03 Å with a coordination number of 6. Zr-P average distance is 3.49 Å with a coordination number of 6. LiZr2(PO4)3 Zr-O average distance is 2.06 & 2.07 Å with a coordination numbers of 6. Zr-P average distance is 3.46 & 3.47 Å with a coordination numbers of 6.

slide-61
SLIDE 61

Zr-BO, -NBO distances

Zr P NBO BO NBO BO NBO 1.5 2.1 1.6 4.4

109°

4.3 Numbers shown in BLUE are found by ND of phosphate based glasses. The number in RED is given by the first peak in the Zr EXAFS. Those in GREEN and ORANGE are calculated and agree well with the second Zr-O coordination sphere.

Correlation R (Å) N DWF Zr-O 4.06 5.7 0.033 Zr-O 4.64 4.0 0.012