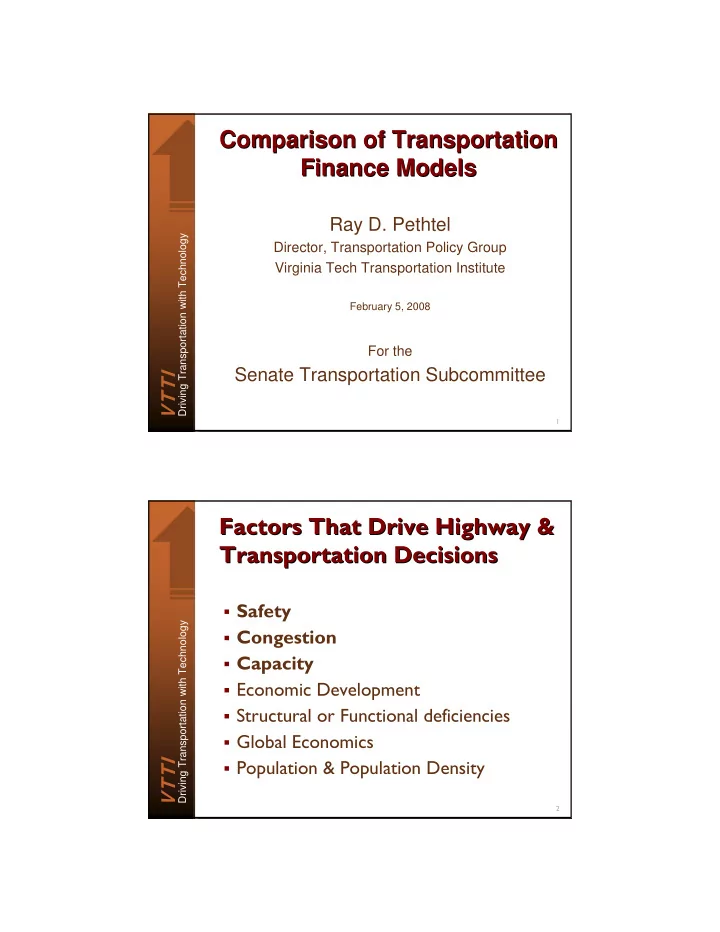

Comparison of Transportation Comparison of Transportation Finance Models Finance Models Ray D. Pethtel Driving Transportation with Technology Director, Transportation Policy Group Virginia Tech Transportation Institute February 5, 2008 For the Senate Transportation Subcommittee VTTI 1 Factors That Drive Highway & Factors That Drive Highway & Transportation Decisions Transportation Decisions � Safety Driving Transportation with Technology � Congestion � Capacity � Economic Development � Structural or Functional deficiencies � Global Economics VTTI � Population & Population Density 2
Safety Safety � 151,692 reported car crashes Driving Transportation with Technology Car crashes are the leading cause of death for teens • 961 fatalities 59.74% of all fatalities were 15-45 years • 78,842 crashes with an injury VTTI 3 Reported Crashes Reported Crashes � According to a “naturalistic” driving study Driving Transportation with Technology by the Virginia Tech Transportation Institute (VTTI), unreported accidents are four times greater than reported accidents . Of 85 known crashes in the study, 16 were reported VTTI 4
Congestion Congestion 2003 2003 Driving Transportation with Technology � Congestion cost $86 million in lost productivity � 2.5 million hours of vehicle VTTI delay 5 Vehicle Miles Traveled Vehicle Miles Traveled 1980, 1986, 2003 1980, 1986, 2003 76,830,000 VMT = 106.70% I ncrease Driving Transportation with Technology 51,725,000 VMT in 1986 VTTI 37,163,000 VMT in 1980 6
Registered Vehicles Registered Vehicles 1980, 1986, 2003 1980, 1986, 2003 Driving Transportation with Technology 6,833,735 RV in 2003 4,514,377 RV in 1986 VTTI 3,716,437 RV in 1986 7 Licensed Drivers Licensed Drivers 1980, 1986, 2003 1980, 1986, 2003 Driving Transportation with Technology 5,257,516 LD in 2003 4,514,377 LD in 1986 VTTI 3,507,580 LD in 1980 8
Lane Miles of Road Lane Miles of Road 1980, 1986, 2003 1980, 1986, 2003 Driving Transportation with Technology VTTI 113,025 LMR in 1980 115,407 LMR in 1986 124,165 LMR in 2003 9 Value of Construction Dollar Value of Construction Dollar 1980, 1986, 2003 1980, 1986, 2003 Driving Transportation with Technology VTTI $2.52 in the year 2007 has the same “purchase power” as $1 in the year 1980. Source: Measuring Worth.Com, 2008 10
It takes 33¢ ¢ in in It takes 33 2007 to buy 2007 to buy Driving Transportation with Technology what 17 ¢ ¢ in in what 17 1986 would 1986 would buy buy VTTI 11 Revenue Revenue Gas Taxes • Gas Tax CPG Driving Transportation with Technology • Gas Tax % • Sales Tax on Gas Other • Use of General Funds • Non-Gas Taxes • Registration Fees • Tolls VTTI • Bonding 12
Gas Tax Gas Tax Alternatives Alternatives • Cents/gallon—taxes volume , not robust,. $.01 cpg = $44m Driving Transportation with Technology • %/gallon—taxes value , • more robust, $1% @ $1.40 = $53.1m • % gallon (Retail)—taxes purchase , VTTI most robust, 1% @ $2.00 = $83.5m 13 Driving Transportation with Technology VTTI 14
Driving Transportation with Technology VTTI Source: Virginia Department of Motor Vehicles & the Virginia Tourism Monitor 15 Gas Taxes in Surrounding States Gas Taxes in Surrounding States Total Adjacent Cents per Variable Virginia Gasoline States Gallon Tax (17.5) Taxes District of 20 20 -2.5 Driving Transportation with Technology Columbia Kentucky 18.5 7.1 10 cpg -1 Maryland 23.5 23.5 -6 North 12.15 cpg 30 17.5 -12.5 Carolina whs Tennessee 21.4 20 1.4 -3.9 VTTI West 31.5 20.5 11 cpg -14 Virginia 16
Driving Transportation with Technology VTTI 17 Types of Gasoline Taxes Types of Gasoline Taxes Type of Tax Number of States Driving Transportation with Technology CPG 44 Variable % 6 Surcharges 3 % 2 Combination CPG % 1 Other 41 County 6 Local 5 VTTI Sales 7 18
Bonding Bonding � Leverages funds during the period of the bond. Needs a stable and reliable revenue source. Driving Transportation with Technology � Interest rates currently are: AA 4.75-5.0% AAA 15-20 basis points � $1m can be leveraged to $15m VTTI 19 Collecting Tolls Collecting Tolls � Booths • Cash, Passes, Electronic Collection Driving Transportation with Technology � Open Road • Transponders, License Plate Recognition � Violation Enforcement VTTI • License Plate Recognition 20
Other Other � Mileage Based Taxes • Self Reported Driving Transportation with Technology • Using Technology � Weight Based Taxes • Weight Miles Traveled • Graduated Registration Fees � Non-transportation Taxes VTTI 21
Recommend
More recommend