
SLIDE 1
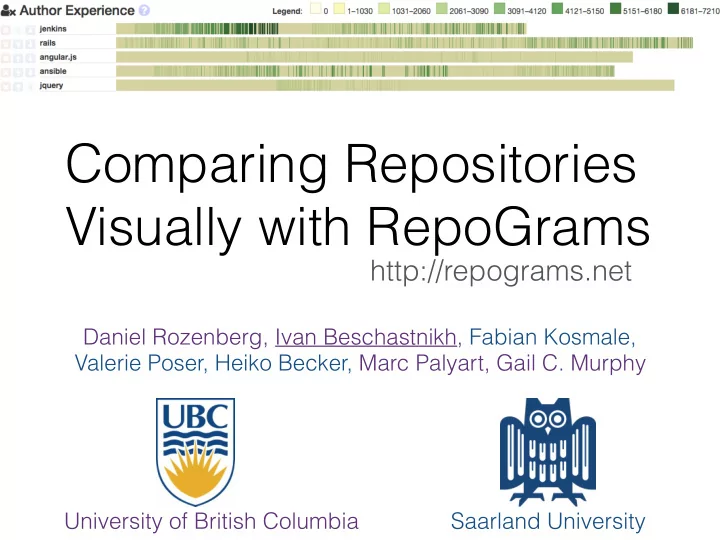
Comparing Repositories Visually with RepoGrams
Daniel Rozenberg, Ivan Beschastnikh, Fabian Kosmale, Valerie Poser, Heiko Becker, Marc Palyart, Gail C. Murphy University of British Columbia Saarland University
Comparing Repositories Visually with RepoGrams http://repograms.net - - PowerPoint PPT Presentation
Comparing Repositories Visually with RepoGrams http://repograms.net Daniel Rozenberg, Ivan Beschastnikh, Fabian Kosmale, Valerie Poser, Heiko Becker, Marc Palyart, Gail C. Murphy University of British Columbia Saarland University Big (SE)
Daniel Rozenberg, Ivan Beschastnikh, Fabian Kosmale, Valerie Poser, Heiko Becker, Marc Palyart, Gail C. Murphy University of British Columbia Saarland University
2
and archived activity
researchers
project is a potential evaluation target!
ASE, MSR, ESEM (years 2012-2014)
to evaluate
3
4
Number of papers Number of evaluation targets
5
Finding: 75% of papers use 8 or fewer evaluation targets Number of papers Number of evaluation targets
6
methods: proper sampling, infrastructure.. Number of papers Number of evaluation targets
7
Number of papers Number of evaluation targets
RepoGrams
Focus of existing tools/ methods: proper sampling, infrastructure..
8
Presents data in a way that can be observed but not measured
9
Presents data in a way that can be observed but not measured
information
(small number of) projects
≤
Visualization: a natural fit for qualitative analysis & nuance
10
A B C Length : commit size Block : commit Time Project : Color : commit metric value
11
Commit author metric:
author Constant commit block width
12
Branches used metric:
branch; master is always red
13
Commit age metric: elapsed time between commit and its parent
14
Block width: linear in the LOC changed in commit
15
16
yellow branches
RQ1: Can SE researchers use RepoGrams to understand and compare characteristics of a project’s source repository? RQ2: Will SE researchers consider using RepoGrams to select evaluation targets for experiments and case studies? RQ3: How much effort is required to add metrics to RepoGrams?
17
RQ1: Can SE researchers use RepoGrams to understand and compare characteristics of a project’s source repository? RQ2: Will SE researchers consider using RepoGrams to select evaluation targets for experiments and case studies? RQ3: How much effort is required to add metrics to RepoGrams?
18
RQ1: Can SE researchers use RepoGrams to understand and compare characteristics of a project’s source repository? RQ2: Will SE researchers consider using RepoGrams to select evaluation targets for experiments and case studies? RQ3: How much effort is required to add metrics to RepoGrams?
19
✦ Successfully used
RepoGrams for complex tasks
✦ Tools is of immediate use ✦ Researchers want custom
metrics
✦ Setup: 1.5 hours ✦ Metric: avg/max = 40/52 min ✦ < 40 LOC total
research”, FSE13
Chronos, RelVis, Chronia, Evolution radar
20
21
✦ RepoGrams: supports qualitative analysis of software repositories
✦ Presents data in a way that can be observed but not
measured
✴ Lots of data, many potential evaluation targets! ✴ But, proper project selection is complex ✴ Researcher must be highly aware of the features of
the project that may influence the study results