
SLIDE 1
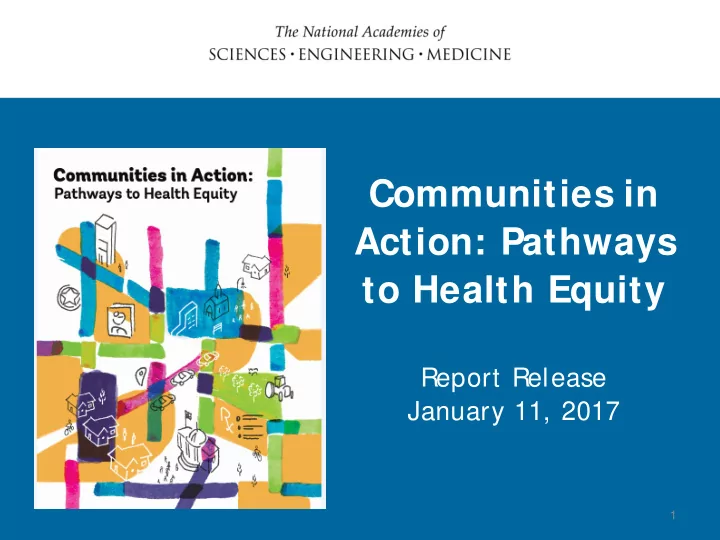
Communities in Action: Pathways to Health Equity
Report Release January 11, 2017
1
Communities in Action: Pathways to Health Equity Report Release - - PowerPoint PPT Presentation
Communities in Action: Pathways to Health Equity Report Release January 11, 2017 1 The committee James Weinstein (chair)* Andrew Grant-Thomas* Hortensia de los Angeles Sister Carol Keehan Amaro Christopher Lyons
1
2
*Denotes committee members in attendance.
3
Review the state of health disparities in the United States and explore the underlying conditions and root causes contributing to health inequity and the interdependent nature of the factors that create them. Identify and examine a minimum of six examples of community-based solutions that address health inequities, drawing both from deliberate and indirect interventions or activities that promote equal opportunity for health, spanning health and non-health sectors accounting for the range of factors that contribute to health inequity in the US (e.g., systems of employment, public safety, housing, transportation, education). Identify the major elements of effective
levers, policies, stakeholders, and other elements that are needed to be successful. Recommend elements of short- or long- term strategies and solutions that communities may consider to expand
Recommend key research needs to help identify and strengthen evidence-based solutions and other recommendations as viewed appropriate by the committee to reduce health disparities and promote health equity.
4
5
6
Key elements of community-based solutions
Context— May be equal but not equitable
7
8
SOURCE: Mathews et al., 2015.
*In 2012, IMR was 7.6 per 1,000 for white infants in the Appalachian region. Children’s Defense Fund, 2016 Note: Infant mortality is one of the indicators of overall health
9
10
Note: Age adjusted death rates and life expectancy are indicators of overall health
Life expectancy disparities in New Orleans, LA and Kansas City, MO SOURCE: RWJF, 2013.
11
12
Ecological model SOURCE: IOM, 2003.
13
Name Location Primary Social Determinant(s)
Blueprint for Action
Minneapolis, MN Public safety 2007 -2015 Preventing youth violence: Results = Reductions reported 62% in youth gunshot victims; 36% youth victim crimes; 76% youth arrest with guns
Delta Health Center
Mound Bayou, MS Health systems and services From 2013 -2015 Low birth weight babies decreased from 20.7% to 3.8%
Dudley Street Neighborhood Initiative
Boston, MA Physical environment 2014 -2015 % HS students at or above grade level : Math from 36% to 63% Graduation Rate 51% to 82% Percent enrolled in college 48% to 69%
Eastside Promise Neighborhood
San Antonio, TX Education Child care available 80% to 100% Work with others to improve neighborhood 58% to 83% Safe places for Kids 48% to 67%
14 *Data as reported by the communities
15
Name Location Primary Social Determinant(s)
Indianapolis Congregation Action Network
Indianapolis, IN Employment; Public safety 76% more civic duty than avg. resident Reduction in incarceration and increased jobs
Magnolia Community Initiative
Los Angeles, CA Social environment 2016 57% children 0-5 had access to place vs ER 78% graduated from H.S. ; 45% College 75.7% report feeling safe, to and from school
Mandela Marketplace
Oakland, CA Physical environment 641,000 lbs. of produce; 76% consumption $5.5 M new revenue; 26 + job ownership
People United for Sustainable Housing
Buffalo, NY Housing Regional mapping process: # of employed workers, # housing units for redeveloped, carbon emission reduction; utility bills
WE ACT for Environmental Justice
Harlem, NY Physical environment New policies around air quality, use of harmful chemicals, pesticides, flame retardants
*Data as reported by the communities
16
Bryant market mural, 2011, community mosaic project designed by Sharra Frank. Blueprint for Action, Minneapolis, MN. Two of WE ACT’s rallying in 1988 to protest the North River Sewage Treatment Plant. WE ACT, West Harlem, NY.
17
18
19
20
21
22
23
and businesses based in a communities, employing residents, etc.
24
25
26
27
28
6-2: State departments of education should provide guidance to schools on how to conduct assessments of student health needs and of the school health and wellness
needs assessments, including those with a focus on student health and wellness. 6-5: Government and non-government payers and providers should expand policies aiming to improve the quality of care, improve population health, and control health care costs to include a specific focus on improving population health for the most vulnerable and underserved. As one strategy to support a focus on health disparities, the Centers for Medicare & Medicaid Services could undertake research on payment reforms that could spur accounting for social risk factors in value-based payment programs it oversees. 7-5: The committee recommends that public health agencies and other health sector
partners and to coordinate activities that address the social and economic determinants
coalitions to advance health equity.
29
7-2: To improve the knowledge base for informing and guiding communities—
analysis, and application of evidence from the experience of practitioners, leaders of community-based organizations, and from traditionally underrepresented participants who are typically left out of such partnerships.
structures to encourage and reward more research on the social distribution of risks and resources and the systematic generation and dissemination of the evidence needed to guide the complex, multi-faceted interventions that are most likely to reduce inequities in health
and the training of students to create a more useful knowledge base in the next generation of researchers on how to design, implement, and evaluate place-based initiatives to improve community health. 7-6: Given the strong effects of educational attainment on health outcomes and their own focus
in the department should support states, localities, and their community partners with evidence and technical assistance on the impact of quality early childhood education programs, on interventions that reduce disparities in learning outcomes, and on the keys to success in school transitions.