Color image processing The use of color in image processing is - - PowerPoint PPT Presentation

color image processing
SMART_READER_LITE
LIVE PREVIEW

Color image processing The use of color in image processing is - - PowerPoint PPT Presentation

Color image processing The use of color in image processing is primarily motivated by two Image Analysis factors: Humans can perceive thousands of colors but only about two Color processing dozen shades of gray. Color is a powerful descriptor


slide-1
SLIDE 1

Image Analysis

Color processing Niclas Börlin niclas.borlin@cs.umu.se

Department of Computing Science Umeå University

February 10, 2009

Niclas Börlin (CS, UmU) Color processing February 10, 2009 1 / 28

Color image processing

The use of color in image processing is primarily motivated by two factors: Humans can perceive thousands of colors but only about two dozen shades of gray. Color is a powerful descriptor that greatly simplifies object segmentation and identification. Color image processing is divided into two major areas: Full-color processing — the images are acquired and processed in full color. Pseudo-color processing — the images are grayscale and are converted to color images for visualization purposes.

Niclas Börlin (CS, UmU) Color processing February 10, 2009 2 / 28

Color is light

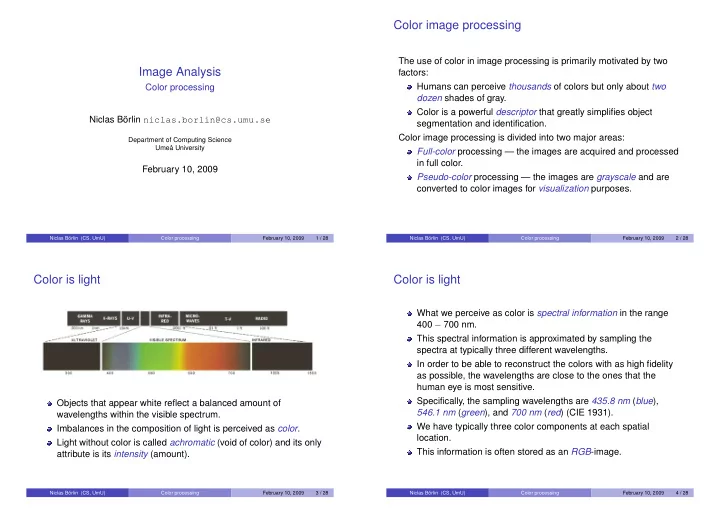
Objects that appear white reflect a balanced amount of wavelengths within the visible spectrum. Imbalances in the composition of light is perceived as color. Light without color is called achromatic (void of color) and its only attribute is its intensity (amount).

Niclas Börlin (CS, UmU) Color processing February 10, 2009 3 / 28

Color is light

What we perceive as color is spectral information in the range 400 − 700 nm. This spectral information is approximated by sampling the spectra at typically three different wavelengths. In order to be able to reconstruct the colors with as high fidelity as possible, the wavelengths are close to the ones that the human eye is most sensitive. Specifically, the sampling wavelengths are 435.8 nm (blue), 546.1 nm (green), and 700 nm (red) (CIE 1931). We have typically three color components at each spatial location. This information is often stored as an RGB-image.

Niclas Börlin (CS, UmU) Color processing February 10, 2009 4 / 28

slide-2
SLIDE 2

Chromatic light

Chromatic light have three basic quantities:

◮ Radiance [watts (W)] is the amount of energy a light source emits. ◮ Luminance [lumens (lm)] is the perceived energy for an observer. ◮ Brightness is a subjective descriptor that embodies intensity.

We distinguish between mixtures of light (an additive process) and mixtures of pigments (a subtractive process).

Niclas Börlin (CS, UmU) Color processing February 10, 2009 5 / 28

Primary and secondary colors

A primary color of light is defined by the wavelength of the light. A primary color of pigment is defined as one that absorbs one primary color of light and reflects the other two. The primary colors can be added to produce the secondary colors:

◮ cyan = green + blue. ◮ magenta = red + blue. ◮ yellow = red + green.

Combining a primary with a complementary secondary color produces white, i.e. magenta + green = white.

Niclas Börlin (CS, UmU) Color processing February 10, 2009 6 / 28

Primary and secondary colors

Niclas Börlin (CS, UmU) Color processing February 10, 2009 7 / 28

Distinguishing between colors

To distinguish one color from an other we ususally speak of three characteristics:

◮ Brightness — the achromatic notion of intensity, ◮ Hue — the dominant wavelength in the spectra, and ◮ Saturation — the relative purity or the amount of white light mixed

with a hue.

Hue and saturation are together called chromaticity.

Niclas Börlin (CS, UmU) Color processing February 10, 2009 8 / 28

slide-3
SLIDE 3

Distinguishing between colors

The amount of red, green and blue needed to form a color is called tristimulus and are denoted by X, Y, and Z. The trichromatic coefficients are defined as x = X X + Y + Z , y = Y X + Y + Z , andz = Z X + Y + Z . Since x + y + z = 1 ⇒ z = 1 − (x + y),

  • nly two coefficient are independent.

A plot of the x and y coefficients is called the CIE Chromaticity Diagram.

Niclas Börlin (CS, UmU) Color processing February 10, 2009 9 / 28

The CIE Chromaticity Diagram

Any straight line between two colors show the possible mixings between the two. The color range (color gamut) of RGB monitors (triangle) and a high-quality printing devices.

Niclas Börlin (CS, UmU) Color processing February 10, 2009 10 / 28

Color models

The purpose of a color model is to provide a standardized way to specify colors. Color models specify a coordinate system and a subspace within that system where each color is represented by a single point. Most color models are either oriented towards hardware

◮ RGB (color monitors), ◮ CMY/CMYK (color printing),

  • r towards color manipulation

◮ HSI (HSV) (human color perception), ◮ CIE L*a*b* (color correction). Niclas Börlin (CS, UmU) Color processing February 10, 2009 11 / 28

The RGB (Red-Green-Blue) color model

In the RGB Color Model, the R, G, and B, components are plotted in a cube (0 ≤ R,G,B≤ 1). The model is a cartesian coordinate system. Colors are specified as points inside the cube. The diagonal line between white and black contain all grayscale values. In practice, RGB values are often integers between 0 and 2n − 1, where n = 8 is common.

Niclas Börlin (CS, UmU) Color processing February 10, 2009 12 / 28

slide-4
SLIDE 4

The CMYK (Cyan-Magenta-Yellow-Black) color model

The CMY Color Model is based on the secondary colors of light (primary colors of pigment), i.e.   C M Y   =   1 1 1   −   R G B   . The expression C = 1 − R indicates that no red light is reflected by a cyan-colored surface. The CMY colors are also called complement colors or anti-colors

  • f RGB, e.g. magenta is the complement color to green, or

anti-green. The CMY color model is used for printing. In theory, C+M+Y is black. However, to improve the quality (and price) of the “black” pigment, black pigment is added to the color space. The CMYK colors are also known as “four-color printing”.

Niclas Börlin (CS, UmU) Color processing February 10, 2009 13 / 28

The HSI (Hue-Saturation-Intensity) color model

The RGB cube is well suited for acquisition devices and storage but not well suited to capture the cognitive notion of a color. The main diagonal of the RGB cube containt the different shades

  • f grey from black (0, 0, 0)T to white (1, 1, 1)T.

Given a color, i.e. point in the cube, we find the plane perpendicular to the main diagonal that holds the color. The height of this plane, i.e. how close it is to white, indicates the intensity of the color. The distance from the color to the main diagonal is a measure of the saturation of the color. Looking down the main diagonal of the RGB cube, we see a hexagon with corners in red (1, 0, 0)T, magenta (1, 0, 1)T, blue (0, 0, 1)T, cyan (0, 1, 1)T, green (0, 1, 0)T, and yellow (1, 1, 0)T. The hue is measured as the counter-clockwise angle from the red corner.

Niclas Börlin (CS, UmU) Color processing February 10, 2009 14 / 28

The HSI (Hue-Saturation-Intensity) color model

Niclas Börlin (CS, UmU) Color processing February 10, 2009 15 / 28

Intensity Slicing

The image (viewed as a 3D function) is ”sliced”/thresholded using a plane perpendicular to the intensity axis. Color is awarded pixels in the resulting image based on a plane-by-plane basis.

Niclas Börlin (CS, UmU) Color processing February 10, 2009 16 / 28

slide-5
SLIDE 5

Pseudocolor image processing

Pseudocolor image processing (also known as false color image processing) consists of assigning colors to gray values based on a specific criterion. The principal use of pseudocolor image processing is (human) visualization.

Niclas Börlin (CS, UmU) Color processing February 10, 2009 17 / 28

Pseudocolor image processing

Images of Io in front of Jupiter in true and false colors.

Niclas Börlin (CS, UmU) Color processing February 10, 2009 18 / 28

Color transformations

Image processing on color images can either be applied to each individual band, or on a vectors of color components. Some problems are best attacked in the RGB domain whilst

  • ther are better to attack in the HSI domain.

Since images in general are acquired and stored with RGB as color model the cost of conversion to HSI must be taken into consideration when comparing algorithms.

Niclas Börlin (CS, UmU) Color processing February 10, 2009 19 / 28

Histogram processing

Manipulating the color component histogram individually in the RGB space will alter then perceived color. Thus histogram processing should be carried out in the HSI color model. Histogram equalization is applied to the intensity component.

Niclas Börlin (CS, UmU) Color processing February 10, 2009 20 / 28

slide-6
SLIDE 6

Histogram processing

Smoothing and sharpening can be applied to the RGB components individually. Edge detection is more difficult since the gradient is not defined for the vector quantities we have with our color component.

Niclas Börlin (CS, UmU) Color processing February 10, 2009 21 / 28

Edge detection in color images

It can however be shown that the value of the rate of change in direction θ(x, y) is Fθ(x, y) = 1 2

  • (gxx + gyy) + (gxx − gyy) cos 2θ(x, y)

+ 2gxy sin 2θ(x, y) 1/2 and that the direction of maximum rate of change is given by θ(x, y) = 1 2 tan−1 2gxy gxx − gyy , where gxx = |δR δx |2 + |δG δx |2 + |δB δx |2, gyy = |δR δy |2 + |δG δy |2 + |δB δy |2, and gxy = δR δx δR δy + δG δx δG δy + δB δx δB δy .

Niclas Börlin (CS, UmU) Color processing February 10, 2009 22 / 28

Color segmentation

Segmentation is a process that partitions an image into regions. Color segmentation performs segmentation based on color. Segmentation can be performed both in the HSI and RGB spaces. However, if we can identify a prototype color c, it is more intuitive to speak about colors that are close in the RGB space. Since the RGB space is a vector space we can use the euclidian distance to define colors that are sufficiently close to the prototype color a.

Niclas Börlin (CS, UmU) Color processing February 10, 2009 23 / 28

Color segmentation

Niclas Börlin (CS, UmU) Color processing February 10, 2009 24 / 28

slide-7
SLIDE 7

Color segmentation

Although HSI is more intuitive, color segmentation is more straightforward in RGB. Acquire an estimate of the “average” color we wish to segment. All pixels with colors z that are “close” to a, i.e. that satisfy D(z, a) ≤ D0 are said to be similar to a.

Niclas Börlin (CS, UmU) Color processing February 10, 2009 25 / 28

Color segmentation

Suitable color distance measures are D(z, a) = ||z − a|| = (z − a)T(z − a), D(z, a) = (z − a)TC−1(z − a), or D(z, a) = |zr − ar| + |zg − ag| + |zb − ab|, where C is the covariance matrix of a set of prototype points.

Niclas Börlin (CS, UmU) Color processing February 10, 2009 26 / 28

Color segmentation

Niclas Börlin (CS, UmU) Color processing February 10, 2009 27 / 28

Noise in color space

Usually, the noise content in a color image will have the same characteristics in all color channels. Faulty hardware or differences in the relative strength of illumination can change this. Noise in one color channel can be proliferated by color space transformations. Noise filtering can be done either on individual color channels or

  • n the entire color image (depending on the filters definition in

vector space).

Niclas Börlin (CS, UmU) Color processing February 10, 2009 28 / 28