
SLIDE 1
Cochecho Waterfront Market and Development Analysis Dover, NH - - PowerPoint PPT Presentation
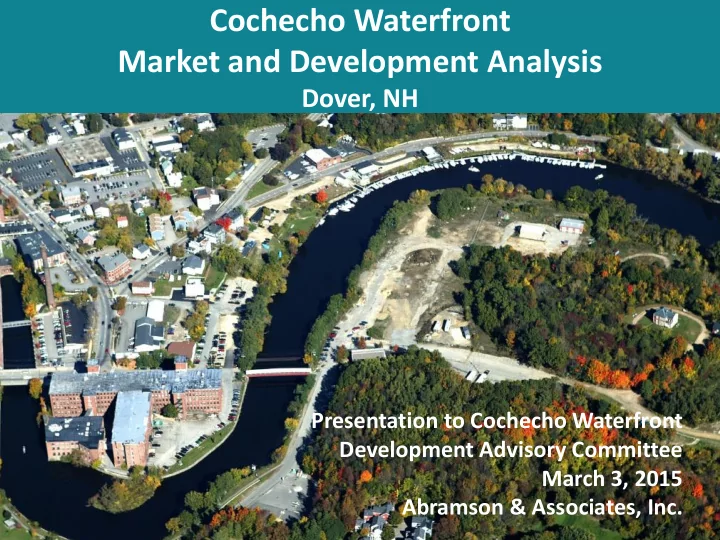
Cochecho Waterfront Market and Development Analysis Dover, NH Presentation to Cochecho Waterfront Development Advisory Committee March 3, 2015 Abramson & Associates, Inc. Scope Market Analysis Development Potentials Analysis
– Strong attraction of companies bringing high value jobs – Portsmouth and Pease – high costs, traffic congestion, lack of parking, limited remaining buildable land pushing development to Strafford County – Dover has amenity and locational advantages to capture this activity
– some improvement in peak travel time possibly by summer 2015
– could generate considerable visitation if developed
– Condo - $275/SF , $275,000 for average 1,000 SF unit – Rental - $1.75/SF, under $1,600 for average 900 SF unit
– Condo - $205/SF, under $380,000 for average 1,850 SF unit – Rental - $1.40/SF, under $2,400 for average 1,700 SF unit – Lower prices attributable to residential components in Live- Work TH’s
– For sale (condo) multi-family buildings, townhouses – Strong
– Rental townhouses – Strong – Rental multi-family buildings –
– Annual absorption 30 multi-family units + 10 townhouses – 50:50 mix of for sale and rental – Absorption of significant residential component over 5-10 years
– also concerns in terms of land utilization (parking), traffic, and vitality
– Couldn’t anticipate preleasing, bankable credit tenants, or rent justifying new development – Rent – $12.00 - $13.00/SF, NNN and allow for significant vacancy – Could make sense for ground floor space within M-U buildings in which residential could subsidize it and share parking – Absorption capacity constrained to extent market already served by space in Dover
– Separated from core of downtown, limits benefit from critical mass of retail
(60%s) significantly below those sufficient to support development
best meet one or more of their locational parameters –
– immediate convenience to and visibility from major highways – proximity to major demand generators – Within major overnight tourist destination (e.g. downtown Portsmouth)
hotel development
undercut price of competitive hotels in Dover, severely impacting them
nearby attractions could, perhaps, make site attractive, development feasible, with only favorable or no land cost only required subsidy
to accommodate large events, and even many medium size events
accommodates 260 for banquet and 300 for lecture
metropolitan areas is rare, given challenging operations and economics
facility, perhaps with no subsidy other than free land for combined project
available both business day and evenings/weekends
Exhibit 4. Per Unit Potential Land Sale Revenues and Property Tax Implications of Alternate Uses
/Unit /Unit /Unit /Unit /GBA SF Total /GBA SF Total /Unit Total /GBA SF Potential Land Sale Revenues* Current/Near Term Market Conditions Low Scenario $5,000 $15,000 $0 $15,000 ($20) ($135,000) ($30) ($2,700,000) ($30,000) ($1,875,000) ($250) Mid Scenario $10,000 $20,000 $2,500 $18,750 ($10) ($67,500) ($15) ($2,025,000) ($22,500) ($1,312,500) ($175) High Scenario $15,000 $25,000 $5,000 $22,500 $0 $0 $0 ($1,350,000) ($15,000) ($750,000) ($100) Potential Favorable Future Conditions $15,000 $25,000 $5,000 $22,500 $0 $0 $0 $0 $0 $0 $0 * not incl extraordinary geotech costs Property Tax Assessed Value $275,000 $379,250 $100,000 $140,000 $80 $675,000 $150 $5,850,000 $65,000 $750,000 $100 Real EstateTax $7,153 $9,864 $2,601 $3,641 $2.08 $17,557 $3.90 $152,159 $1,691 $19,508 $2.60 Above estimates are for illustrative purposes and do not represent appraised values All financial estimates in Constant $2015 Banquet/Event Facility Hotel Restaurant Retail/ Office Residential LW Townhouses
Residential Multi- Family Flats - Rental Residential LW Townhouses
Residential Multi- Family Flats - For Sale
important to create thriving neighborhood, extension of downtown
project components, City may be able to fill feasibility gap with relief on taxes or fees, assisting with parking, or other means
supply than necessary to activate key public-oriented pathways or than can absorbed so as not to harm downtown, impair feasibility, or diminish positive economic outcome to City
anticipated to change economics of development and attainable land sale revenues over time
– Construction 2017, on line 2018 – Initial phase of residential with ground floor commercial – Pursue major restaurant – start date depends on success of marketing and, as necessary, willingness of City to subsidize
– Residential with ground floor commercial in multiple phases – Hotel, possibly with event facility, potentially upon development
components
– Residential with commercial (20,000 SF) plus major restaurant (4,500 SF) starting to come on line in 2018 – Favorable future conditions support development of hotel with event facility feasible 4 years after initial phase (i.e. coming on line 2022) with only the write off of land – Program includes 262 residential units – Build-out completed by 2024, with full absorption in 2025, 8 years after construction start of initial phase
– Residential with commercial (20,000 SF) plus major restaurant (4,500 SF) starting to come on line in 2018 – No hotel and event facility – Remaining land allocated to additional residential (yielding 378 units) – Build-out extended to 2026, with full absorption in 2027, 10 years after construction start of the initial phase
– Upon full build-out, yields approx same TIF, land sale revenues, though stabilized revenues not achieved until 15th year of financing, 2031
– approx equal to share of taxes on base valuation going to City’s general fund over that period ($23,000 per year)