
1
Cluster percentage and AA pair count
10916 Biochemistry: Henikoff and Henikoff
BLOSUM (blocks substitution matrix) matrices in half-bit
units, comparable to matrices generated by the PAM (percent
accepted mutation) program (11). For each substitution ma-
trix, we calculated the average mutual information (12) per
amino acid pair H (also called relative entropy), and the
expected score E in bit units as
20
i
H =
qijxsij;
i=1 j=1 20
i
E= E Pixpj x si.
i=1
j=1
Clustering Segments Within Blocks. To reduce multiple contributions to amino acid pair frequencies from the most closely related members of a family, sequences are clustered within blocks and each cluster is weighted as a single se-
quence in counting pairs (13). This is done by specifying a
clustering percentage in which sequence segments that are identical for at least that percentage of amino acids are
grouped together. For example, if the percentage is set at 80%, and sequence segment A is identical to sequence
segment B at .80%o of their aligned positions, then A and B
are clustered and their contributions are averaged in calcu-
lating pair frequencies. If C is identical to either A or B at
.80%o of aligned positions, it is also clustered with them and the contributions of A, B, and C are averaged, even though
C might not be identical to both A and B at -80%o of aligned
- positions. In the above example, if 8 of the 9 sequences with
A residues in the 9A-1S column are clustered, then the
contribution of this column to the frequency table is equiv- alent to that of a 2A-1S column, which contributes 2 AS
- pairs. A consequence of clustering is that the contribution of
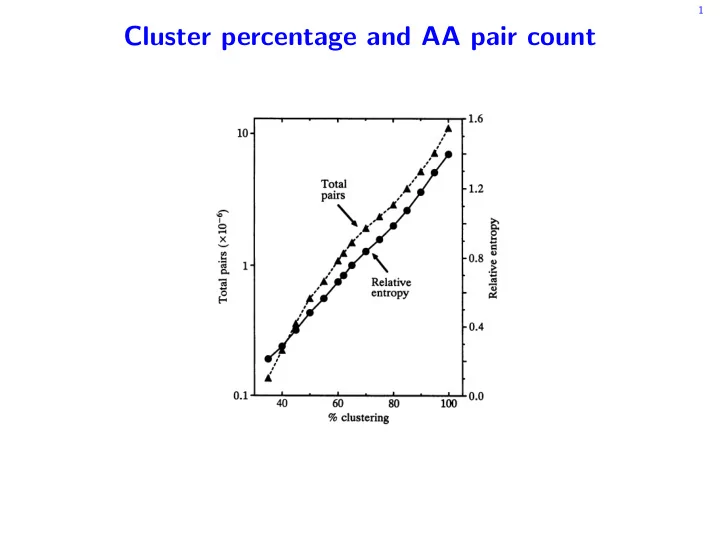
closely related segments to the frequency table is reduced (or eliminated when an entire block is clustered, since this is equivalent to a single sequence in which no substitutions appear). For example, clustering at 62% reduces the number
- fblocks contributing to the table by 25%, with the remainder
contributing 1.25 million pairs (including fractional pairs),
whereas without clustering, >15 million pairs are counted
(Fig. 1). In this way, varying the clustering percentage leads to a family of matrices. The matrix derived from a data base
- f blocks in which sequence segments that are identical at
.80%o of aligned residues are clustered is referred to as BLOSUM 80, and so forth. The BLOSUM program implements
10-
x
- *1
1
0.1I
40 60 80 100
Q4
I-
% clustering
FIG.
1.
Relationship between percentage clustering and total
amino acid pair counts plotted on a logarithmic scale and relative
entropy.
matrix construction. Frequency tables, matrices, and pro-
grams for UNIX and DOs machines are available over Internet by anonymous ftp (sparky.fhcrc.org).
Constructing Blocks Data Bases. For this work, we began with versions of the blocks data base constructed by PROTO-
MAT (10) from 504 nonredundant groups of proteins cata-
logued in Prosite 8.0 (14) keyed to Swiss-Prot 20 (15).
PROTOMAT employs an amino acid substitution matrix at two
distinct phases of block construction (16). The MOTIF pro-
gram uses a substitution matrix when individual sequences
are aligned or realigned against sequence segments contain- ing a candidate motif (16). The MOTOMAT program uses a substitution matrix when a block is extended to either side of the motif region and when scoring candidate blocks (10). A unitary substitution matrix (matches = 1; mismatches = 0)
was used initially, generating 2205 blocks. Next, the BLOSUM program was applied to this data base of blocks, clustering at
60%o, and the resulting matrix was used with PROTOMAT to construct a second data base consisting of 1961 blocks. The
BLOSUM program was then applied to this second data base,
clustering at 60%. This matrix was used to construct version 5.0 of the BLOCKS data base from 559 groups in Prosite 9.00
keyed to Swiss-Prot 22. The BLOSUM program was applied to
this final data base of 2106 blocks, using a series ofclustering
percentages to obtain a family of lod substitution matrices. This series of matrices is very similar to the series derived
from the second data base. Approximately similar matrices were also obtained from data bases generated by PROTOMAT
using the PAM 120 matrix, using a matrix with a clustering percentage of80%, and usingjust the odd- or even-numbered groups (data not shown). Aflgnments and Homology Searches. Global multiple align- ments were done using version 3.0 of MULTALIN for DOS computers (17). To provide a positive matrix, each entry was increased by 8 (with default gap penalty of 8). Version 1.6b2
- f Pearson's RDF2 program (18) was used to evaluate local
pairwise alignments.
Homology searches were done on a Sun Sparcstation using
the BLASTP version of BLAST dated 3/18/91 (11) and version 1.6b2 of FASTA (with ktup = 1 and -o options) and SSEARCH, an implementation of the Smith-Waterman algorithm (18-
20). The Swiss-Prot 20 data bank (15) containing 22,654
protein sequences was searched, and one search was done with each matrix for each of the 504 groups of proteins from Prosite 8.0. The first of the longest and most distant se-
quences in the group was chosen as a searching query,
inferring distance from PROTOMAT results and Swiss-Prot
names.
In the BLOSUM matrices, the scores for B and Z were made identical to those for D and E, respectively, and -1 was used for the character X. We used the same gap penalties for all matrices, -12 for the first residue in a gap, and -4 for
subsequent residues in a gap.
The results of each search were analyzed by considering
the sequences used by PROTOMAT to construct blocks for the protein group as the true positive sequences and all others as true negatives. BLAST reports the data bank matches up to a certain level ofstatistical significance. Therefore, we counted the number of misses as the number of true positive se-
quences not reported. For FASTA and SSEARCH, we followed
the empirical evaluation criteria recommended by Pearson
(19); the number of misses is the number of true positive
scores, which ranked below the 99.5th percentile of the true
negative scores.
RESULTS
Comparison to Dayhoff Matrices. The BLOSUM series de-
rived from alignments in blocks is fundamentally different
from the Dayhoff PAM series, which derives from the esti-
- Proc. Natl. Acad Sci. USA 89 (1992)