
SLIDE 1
1
Closing the Protection Gap from Both Directions Insurance + - - PowerPoint PPT Presentation
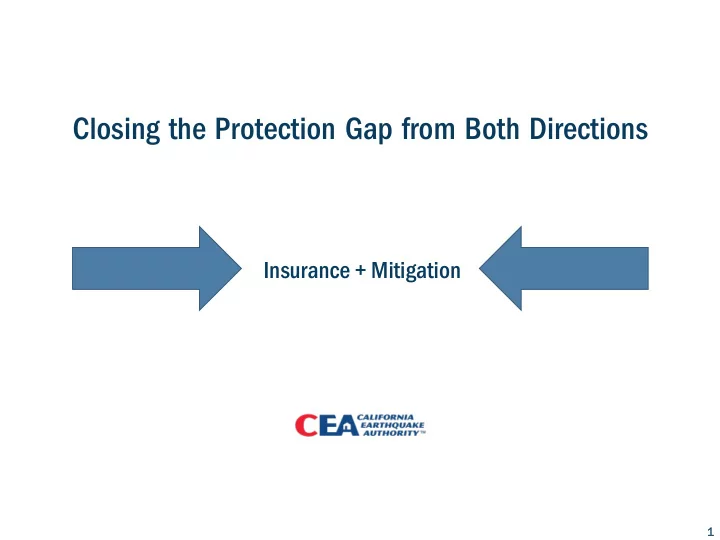
Closing the Protection Gap from Both Directions Insurance + Mitigation 1 Residential Earthquake Insurance 1.1 Million Policyholders Publicly Managed/Privately Financed Not for Profit Residential Earthquake Mitigation Grants
1
2
3
4
Ratepayer Surcharge
SoCal Edison SDG&E PG&E
Calif iforni
a Wi Wildf dfir ire e Fund
5
754,000 775,000 779,000 800,000 811,000 820,000 841,000 841,000 865,000 879,000 931,000 1,021,000 1,050,000 1,111,000 1,119,000 700,000 750,000 800,000 850,000 900,000 950,000 1,000,000 1,050,000 1,100,000 1,150,000 2006 2007 2008 2009 2010 2011 2012 2013 2014 2015 2016 2017 2018 2019 2020 Organic New Participating Insurers
*as of April 2020
6
7
8
Several eral step eps to the ho e house Crawl wl spa pace e ven ents and d access cess do door
9
Plywood
ace
Foundat dation ion pl plate
10 10
11 11
12 12
Safe Home Program
13 13
Spon
sor:
Co Co-Spon Sponso sors: s: California
Alabama
South Carolina
North Carolina
14 14
1 in 50 2% $5.2 B 1 in 100 1% $8.6 B 1 in 150 .66% $11 B 1 in 200 .50% $13 B 1 in 250 .40% $14.9 B 1 in 300 .33% $16.3 B 1 in 350 .28% $17.7 B 1 in 400 .25% $19 B
CEA Return Period Probability 2020 Estimated CEA Loss Reoccurrence of Previous Earthquakes 2020 Claim Paying Capacity 1 in 400 Return Period
1 in 10 10% $630 M
1868 Hayward $6 B 1994 Northridge $8 B 1906 San Francisco $13 B >$1.3 B 1989 Loma Prieta 2014 Napa 2019 Ridgecrest
Capital $6 B Reinsurance $9.2 B
Bond Proceeds $1.1 B CEA Surcharge $1 B
IAL
$19 B
$1.7 B
15 15
CEA Return Period Probability 2020 Estimated CEA Loss Reoccurrence of Previous Earthquakes 2020 Claim Paying Capacity 1 in 400 Return Period Concept
1868 Hayward $6 B 1994 Northridge $8 B 1906 San Francisco $13 B
Capital $6 B Reinsurance $9.2 B
Bond Proceeds $1.1 B CEA Surcharge $1 B
IAL $1.7 B
>$1.3 B 1989 Loma Prieta 2014 Napa 2019 Ridgecrest
1 in 50 2% $5.2 B 1 in 100 1% $8.6 B 1 in 150 .66% $11 B 1 in 200 .50% $13 B 1 in 250 .40% $14.9 B 1 in 300 .33% $16.3 B 1 in 350 .28% $17.7 B 1 in 400 .25% $19 B 1 in 10 10% $630 M Capital $6 B Reinsurance $6.4 B
Bond Proceeds $1.1 B CEA Surcharge $1 B
IAL $1.7 B Contingent Capital $2.8 B
$19 B $19 B
Exclud uding: ing: Work rk Comp, p, Med Mal l and Earth thqua uake
Potential Assessment %
Homeowners Insurance
Average Annual Premium: $1,000 Temporary Assessment $
3
16 16
CEA Return Period Probability 2020 Estimated CEA Loss Reoccurrence of Previous Earthquakes 2020 Claim Paying Capacity 1 in 400 Return Period Concept Potential Assessment % 1%
1868 Hayward $6 B 1994 Northridge $8 B 1906 San Francisco $13 B >$1.3 B 1989 Loma Prieta 2014 Napa 2019 Ridgecrest
Capital $6 B Reinsurance $9.2 B
Bond Proceeds $1.1 B CEA Surcharge $1 B
IAL $1.7 B 1 in 50 2% $5.2 B 1 in 100 1% $8.6 B 1 in 150 .66% $11 B 1 in 200 .50% $13 B 1 in 250 .40% $14.9 B 1 in 300 .33% $16.3 B 1 in 350 .28% $17.7 B 1 in 400 .25% $19 B 1 in 10 10% $630 M Capital $6 B Reinsurance $6.4 B
Bond Proceeds $1.1 B CEA Surcharge $1 B
IAL $1.7 B Contingent Capital $2.8 B
$19 B $19 B
0% $1.67 $20
Homeowners Insurance
Average Annual Premium: $1,000 Temporary Assessment $ $.83 $10
17 17
CEA Return Period Probability 2020 Estimated CEA Loss Reoccurrence of Previous Earthquakes 2020 Claim Paying Capacity 1 in 400 Return Period Concept Potential Assessment %
Homeowners Insurance
Average Annual Premium: $1,100
1868 Hayward $6 B 1994 Northridge $8 B 1906 San Francisco $13 B >$1.3 B 1989 Loma Prieta 2014 Napa 2019 Ridgecrest
Capital $6 B Reinsurance $9.2 B
Bond Proceeds $1.1 B CEA Surcharge $1 B
IAL $1.7 B 1 in 50 2% $5.2 B 1 in 100 1% $8.6 B 1 in 150 .66% $11 B 1 in 200 .50% $13 B 1 in 250 .40% $14.9 B 1 in 300 .33% $16.3 B 1 in 350 .28% $17.7 B 1 in 400 .25% $19 B 1 in 10 10% $630 M
0% 1%
Annually: $11.00 Monthly: $0.91
Capital $6 B Reinsurance $6.4 B
Bond Proceeds $1.1 B CEA Surcharge $1 B
IAL $1.7 B Contingent Capital $2.8 B
$19 B $19 B
18 18
CEA Return Period Probability 2020 Estimated CEA Loss Reoccurrence of Previous Earthquakes 2020 Claim Paying Capacity 1 in 400 Return Period Concept Potential Assessment %
Auto Insurance
Average Annual Premium: $1200
1868 Hayward $6 B 1994 Northridge $8 B 1906 San Francisco $13 B >$1.3 B 1989 Loma Prieta 2014 Napa 2019 Ridgecrest
Capital $6 B Reinsurance $9.2 B
Bond Proceeds $1.1 B CEA Surcharge $1 B
IAL $1.7 B 1 in 50 2% $5.2 B 1 in 100 1% $8.6 B 1 in 150 .66% $11 B 1 in 200 .50% $13 B 1 in 250 .40% $14.9 B 1 in 300 .33% $16.3 B 1 in 350 .28% $17.7 B 1 in 400 .25% $19 B 1 in 10 10% $630 M
0% 1%
Annually: $12.00 Monthly: $1.00
Capital $6 B Reinsurance $6.4 B
Bond Proceeds $1.1 B CEA Surcharge $1 B
IAL $1.7 B Contingent Capital $2.8 B
$19 B $19 B 19 19
Capital $6 B Reinsurance $8.9 B
Bond Proceeds $1.4 B CEA Surcharge $1 B
IAL $1.7 B
$19B
Capital $6 B Reinsurance $6.1 B
Bond Proceeds $1.4 B CEA Surcharge $1 B
IAL $1.7 B Contingent Capital $2.8 B
$19B
Capital $6.3 B Reinsurance $7.1 B
Bond Proceeds $1.4 B CEA Surcharge $1 B
IAL $1.7 B Contingent Capital $2.9 B
$20.4B
Capital $6.6 B Reinsurance $8.5 B
Bond Proceeds $1.4 B CEA Surcharge $1 B
IAL $1.4 B Contingent Capital $3 B
$21.9B
Capital $6.8 B Reinsurance $9.9 B
Bond Proceeds $1.4 B CEA Surcharge $1 B
IAL $1.2 B Contingent Capital $3.14 B
$23.4B 2020 20 Year r 1 Year r 2 Year r 3 Year r 4
20 20