Clinical Challenge Clinical Challenge Possible Causes: - - PDF document

clinical challenge clinical challenge
SMART_READER_LITE
LIVE PREVIEW

Clinical Challenge Clinical Challenge Possible Causes: - - PDF document

Disclosure-of-Relationship Role of Pre-procedure Imaging Before VT - Research Grants Biosense-Webster, Ablation Just Pretty Pictures or Critical General Electric Information to Guide Ablation? - 7th Annual California Heart Rhythm


slide-1
SLIDE 1

Role of Pre-procedure Imaging Before VT Ablation – Just Pretty Pictures or Critical Information to Guide Ablation?

  • 7th Annual California Heart Rhythm Symposium-

Timm Dickfeld, MD, PhD

Professor of Medicine, University of Maryland MACIG (Maryland Arrhythmia and Cardiac Imaging Group) www.umm.edu/heart/macig

Disclosure-of-Relationship

  • Research Grants – Biosense-Webster,

General Electric

Unlabeled Indications

  • Use of Gadolinium for MRI Scar Imaging
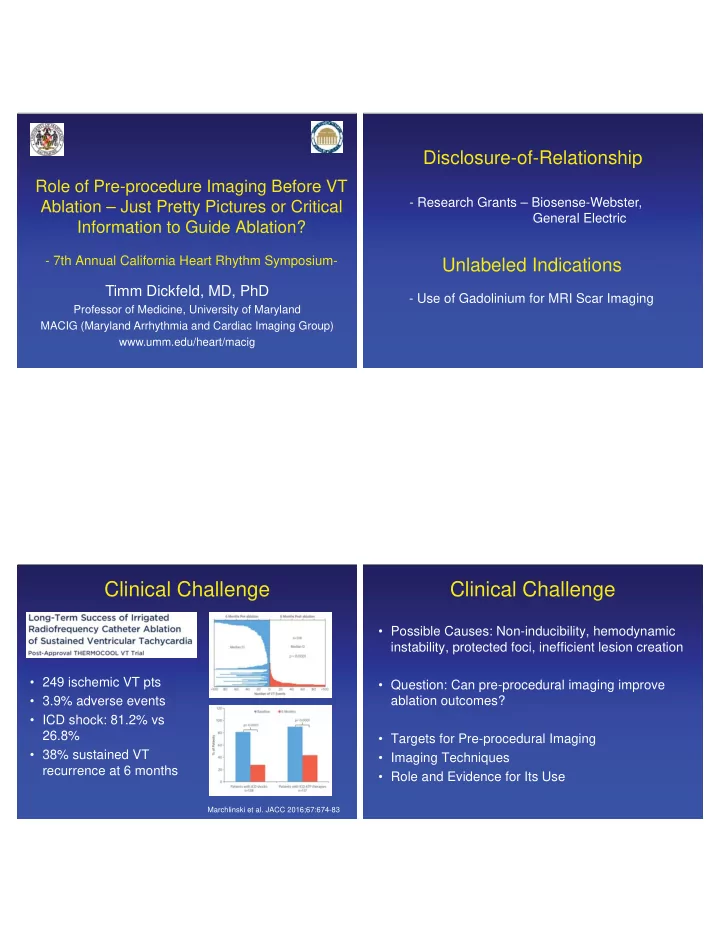
Clinical Challenge

  • 249 ischemic VT pts
  • 3.9% adverse events
  • ICD shock: 81.2% vs

26.8%

  • 38% sustained VT

recurrence at 6 months

Marchlinski et al. JACC 2016;67:674-83

  • Possible Causes: Non-inducibility, hemodynamic

instability, protected foci, inefficient lesion creation

  • Question: Can pre-procedural imaging improve

ablation outcomes?

  • Targets for Pre-procedural Imaging
  • Imaging Techniques
  • Role and Evidence for Its Use

Clinical Challenge

slide-2
SLIDE 2

Anatomic Evaluation

  • Cardica Anatomy -

Chamber Anatomy

Anatomic Evaluation

  • Endocavitary Structures -
  • Underappreciated entity
  • 190 VT RFA
  • 24% ECS affecting case
  • 67% mapping (n=31)
  • 33% RF target (n=15)

8% of all cohort

  • 30% papillary muscle
  • 47% moderator band
  • 23% false tendon

Abbouezzeddine et al. JCE 2010;21:245; Doppalapudi et al. Circ Arrhythmia Electrophysiol. 2008;1:23 Good et a.. Heart Rhythm. 2008;:1530; Tian et al. Circulation 2008; 118:S690 VT PM

Anatomic Evaluation

  • Myocardial Structures: VSD patch and Pledgets -

56 yo pt, 6 weeks post IMI with LV wall rupture and LV patch

VT termination post 11s CT Integration RF site co-localization

Anatomic Evaluation

  • Epicardial Structures: CA, Epicardial Fat -
  • Coronary Arteries
  • 5-10mm safety distance;

thermal injury with abrupt thrombosis or delayed SMC hypertrophy

  • Epicardial Fat
  • Mapping: decreased
  • RF delivery not effective

with 3.5-7.3mm

  • Phrenic Nerve

vanHulsvanTaxis et al. JACC:CV Im. 2 013 :6;42; Desjardins B et al. JACC. 2010;56: 1320 ; d’Avila et al. Circulation 2004;109:2363; Saba M et al. Europace 2009;11:949 Semi-automatic CA Reconstruction Epi/Pericardial Fat and Fat Map

slide-3
SLIDE 3

Adapted from Stevenson et al. Circulation. 1993;88:1647 Inner Loop Outer Loop Blind Alley Exit Isthmus

Scar Imaging

Anatomic Substrate of Reentrant VT

%LGE/LV WMS%

Kwong R. et al. Circulation. 2006;113:2733

  • 195 likely CAD pts. (EF 54±14%) with 16m F/U
  • Threshold effect with HR of >7 with 1.4% LGE

HR for MACE for % LGE/LV and WMS%

Scar And MACE Critical Amount of Scar?

4.3g myocardium = 1.4% LV mass

Computed Tomography

slide-4
SLIDE 4

Computed Tomography

Advances in Multi-detector CT

  • 256 slices; <0.4s gantry rotation
  • submillimeter resolution; <1mSv radiation
  • Anatomic Evaluation
  • Wall thickness, calcifications
  • Dynamic Evaluation
  • Wall motion, wall thickening
  • Perfusion Evaluation
  • First-pass hypoperfusion, delayed enhancement

Comprehensive Scar Characterization; n=11

Anatomic Evaluation

  • Calcification -

Tissue HU Air Bone 1000 Air

  • 1000

Ca++ >200

Calcification

Sasaki et al. Heart Rhythm 2015;12:1508

  • Intramyocadial remoddelling with hypoattenuation
  • 22 post-MI patients undergoing VT ablation
  • 50% of VT circuits in close proximity to fat deposits

Tissue HU Air Bone 1000 Air

  • 1000

Ca++ >200 Fat

  • 100

Anatomic Evaluation

  • Fatty Replacement -

2D-CT WT Contouring

  • Segm. WT

Analysis

  • Segm. Volt.

Analysis WT Projection

Anatomic Evaluation

  • Wall Thickness -

Tian et al. Circ Arrhythm Electrophysiol 2010;3:496

slide-5
SLIDE 5

Dynamic Evaluation: Comparison with LV Voltage Map

CT Image 17-Seg Analysis Voltage Map

(WT)

Tian et al. Circ Arrhythm Electrophysiol 2010;3:496

Comparison of Anatomic/Dynamic Parameters between Voltage-Defined Abnormal and Normal Segments

Normal segments (>1.5mV): 43 segments Abnormal segments (<1.5mV): 28 segments(5 scar, 3 BZ, 20 scar/BZ)

8.12 5.77 10.88 5.69 35.70

  • 2.48

2.68 0.96

  • 5

5 10 15 20 25 30 35 40 Normal Abnormal

EDWT (mm) ESWT (mm) WT (%) WM (mm)

* * * *

P<0.05*

Prediction of Abnormal Voltage Segments with Anatomic and Dynamic Parameters

  • Regression Model:
  • ESWT and WT with

best prediction value

  • correctly classifies 82%

segments

  • AUC= 0.850.05

Tian et al. Circ Arrhythm Electrophysiol 2010;3:496

Perfusion

  • 1st pass Hypoperfusion -

Highly vascularized myocardium Relative vascular paucity Microvascular obstruction

Hearse et al. J Cardiovasc Res 2000;45:215; Nakano M et al. Circ Cardiovasc Imaging. 2011;4:597

Absolute and relative hypoperfusion

slide-6
SLIDE 6

Computed Tomography

  • Perfusion Characteristics: 1st pass Hypoperfusion -

Transmural Scar Endocardial Scar

Correlation of Hypoperfusion and Voltage

  • LV Scar Burden
  • Perfusion CT:

33.3±8.5%

  • Voltage <1.5mV: 37.4±11.4%
  • r=0.77, P=0.006
  • 82% of successful RF

sites in border zone

  • 18% in scar center

Tian et al. Circ Arrhythm Electrophysiol 2010;3:496

Viable Myocardium

Ruptured Cell Membranes

Acute Myocardial Infarction

K K K K K K K K K K Na Na Na

I I

Na Na Na Na Na Na Na

I I I I I I I

Na

I I I I I I

Na Na Na Na Na

Acute

Delayed Contrast Enhancement

Kim RJ, et al.: Lippincott Williams and Wilkins, 20

Collagen Matrix

Chronic Myocardial Infarction Scar

I I I I I I I I I I I

Intact Cell Membranes

Tissue Volume predominantly intracellular (75%) Increased volume of distribution Myocyte replacement, increased interstitial space/VoD

First Pass and Late Enhancement

  • 37 patients (16 acute, 21 chronic MI)

Gerber BL. Circulation 2006; 113:823

First Pass “Black” Late Enhancement “White”

slide-7
SLIDE 7

Pre-contrast Post-contrast

Computed Tomography

  • Perfusion Characteristics: Delayed Enhancement -

Komatsu Y et al. Circ Arrhythm Electrophysiol. 2013;6:342

54 [46–92] cm2 71 [59–124] cm2 (45 [42–61] cm2 52 [51–68] cm2

CT WT recon. EAM fusion

  • 13 post-MI patients
  • CT wall thickness <5mm ~ endocardial <1.5mV
  • LAVA: 87% within WT<5mm; rest within 23mm

Anatomic Evaluation

  • Comparison with EAM -

Anatomic Evaluation

  • Wall Thickness in Non-Ischemic CM -
  • Very limited data on NICM
  • 3/3 pts with wall thinning <5mm (1/3 with LGE)
  • 63 ± 21% overlap with <1.5mV

Cochet H et al. JCE 2013:24;419

Magnetic Resonance Imaging

slide-8
SLIDE 8

MRI: Near-Cellular SubstrateResolution

  • LAD ligation

Rat-infarct model

  • LGE ex-vivo 7T MRI
  • Voxel: 50x50x50m
  • MRI/histoloy

correlation (R2=0.96)

  • Ability to detect clefts

2-4 myocytes thick

Schelbert et al. Circ Cardiovasc Imaging 2010;3;743

Correlation: MRI and Voltage

DE MRI Voltage Map

1 2 3 4 5 6 7 50 100

Scar Transmurality [%] Bipolar Voltage [mV] r = 0.72

Correlation of Scar Transmurality and Voltage

Dickfeld et al. Circ Arrhythm Electrophysiol. 2011;4:172

CMR: MRI Scar and Voltage Scar

Wijnmaalen et al . Eur Heart J. 2011;32:104

15 post-MI pts

slide-9
SLIDE 9

MRI Scar and Voltage Mapping

  • Best voltage cut-off for MRI scar:
  • Bipolar voltage:

1.0-1.54mV

  • Unipolar voltage:

4.46-6.52mV

  • Desjardins. Heart Rhythm 2009;6:644

Codreanu . JACC. 2008;52:839 Dickfeld . Circ Arrhythm Electrophysiol. 2011;4:172

  • Comparison MRI and Voltage Scar Area:
  • MRI scar ~ <0.5mV scar area
  • MRI scar ~ <1.5mV scar+border zone area
  • MRI scar slightly larger than 1.5mV area
  • Significant Mismatch: 1/3 of patients

Nakahara . Heart Rhythm 2011;8:1060 Wijnmaalen . Eur Heart J. 2011;32:104

  • Desjardins. Heart Rhythm 2009;6:644; Dickfeld . Circ Arrhythm Electrophysiol. 2011;4:172

Codreanu . JACC. 2008;52:839 Wijnmaalen et al . Eur Heart J. 2011;32:104

A B A B

Mismatch: MRI Scar > Voltage Scar

Tian J et al. Heart Rhythm 2009; 6:825 Wijnmaalen et al. Eur Heart J. 2011;32:104 Dickfeld et al. Circ Arrhythm Electrophysiol. 2011;4:172;

Endocardial layer of ~2mm normal myocardium masks intramural scar (predominantly in septal location)

Mismatch: MRI Scar > Voltage Scar

Dickfeld et al. Circ Arrhythm Electrophysiol. 2011;4:172; Wijnmaalen et al.. Eur Heart J. 2011;32:104

  • Suboptimal Catheter Contact:
  • Frequently basal “pseudoscar”
  • Early registration algorithm (e.g. CartoSOUND)

corrected 4.1±1.9% falsely low voltage points

  • Decreased MRI Sensitivity to detect patchy scar
  • Limited Mapping Density: incorrect low voltage

extrapolation

Mismatch: Voltage Scar > MRI Scar

Dickfeld et al. Circ Arrhythm Electrophysiol. 2011;4:172 Nakahara et al. Heart Rhythm 2011;8:1060 Desjardins et al. Heart Rhythm 2009;6:644 Codreanu A et al. JACC. 2008;52:839 Nakahara et al. Heart Rhythm 2011;8:1060

slide-10
SLIDE 10

Image-Guided VT Ablation

MRI-Guided Ablation: Border Zone

Pacemapping Guided by MRI Scar Pacemap Match

Dickfeld et al. Circ Arrhythm Electrophysiol. 2011;4:172

PM 2

  • Successful Ablation Site Characteristics -

Reprojection of PM Site

80-Sector Segmentation

MRI-Guided Ablation

PM 2

Transmurality Display

Surviving

  • Pap. Muscle

Substrate-Guided Mapping 1 2

1 2

MRI-Guided Ablation: Abnormal Substrate

PM Match

Dickfeld et al. Circ Arrhythm Electrophysiol. 2011;4:172

slide-11
SLIDE 11

VT LV Voltage Map

MRI-Guided Ablation: Midmyocardial Scar

Mid- and Epicardial Scar with Preserved Endocardial Voltage

MRI-Guided Ablation: Midmyocardial Scar

Dickfeld et al. Circ Arrhythm Electrophysiol. 2011;4:172

Successful RF Site Characteristics

  • Bipolar Voltage:

0.60- Unipolar Voltage: 1.9-

  • Fractionated Signals:

32-62% Diastolic Potentials: 23-66%

  • Transmurality:

60-

  • Infarct core 17-71%

Grey zone/periphery 29-83%

  • MRI LGE: 100%

Wijnmaalen et al. . Eur Heart J. 2011;32:104 Desjardins et al. Heart Rhythm 2009;6:644 Dickfeld et al. Circ Arrhythm Electrophysiol. 2011;4:172 Perez-David E et al. J Am Coll Cardiol 2011;57:184 Gupta et al. JACC CV Imaging. 2012;5:207 Piers et al. JACC CV Imaging. 2014;7:774

Commercial Image Integration Software

  • A. Align short/long axis
  • C. Bipolar Voltage Map
  • B. Histogram-based

Definition of Scar (pink) and Border Zone (blue).

  • D. Registered MRI,

Scar (red),GZ (blue)

  • E. Procedural Guidance
slide-12
SLIDE 12
  • Frequency shift with complete (“signal void”)

and partial dephasing (“white halo”)

  • Affecting 54±21% of LV myocardium

Metal Artifact of MRI

Base Apex

Mesubi R et al. Pacing Clin Electrophysiol 2014;37(10):1274-83

ICD Artifact Suppression

Standard Inversion Recovery Inversion Recovery with Bandwidth Modulation for artifact suppression

  • Artifact reduction 48±18% to 12±10% (p<0.001)

in RV and 62±26% to 10±7% (p<0.001) in LV.

Abdulghani et al. Heart Rhythm Society 2014.

ICD Artifact Suppression

  • Further refinement of binary concept (DE+/-)
  • Introduction of MRI scar core and periphery
  • Analogous to voltage-defined border zone

De Bakker JM. Circ Arrhythm Electrophysiol 2010; 3:204

‘Gray Zone’

  • Mixture of Scar and Normal Myocardium -
slide-13
SLIDE 13

Schmidt A et al. Circulation. 2007;115:2006

  • Gray zone correlated in ischemic

patients with all-cause mortality, inducibility of MMVT and appropriate ICD shocks

  • Three different definitions:
  • Scar (>3SD), Gray Zone (2-3 SD),
  • Scar (>50% max SI), Gray Zone

(>peak remote/<50%max SI)

  • Scar (>50% max SI), Gray Zone

(35-50% max SI)

‘Gray Zone’

  • Mixture of Scar and Normal Myocardium -

Yan A. et al. Circulation 2006;114;32 Roes S. Circ Cardiovasc Imaging. 2009;2:183

Gray Zone – Human Studies

  • 10 patients with ischemic CMP and VT RFA
  • Voltage as gold standard
  • Best MRI match with FWHM 60% and

subendocardial half-wall thickness (scar r2=0.81; p<0.001 and BZ: r2=0.49; p=0.025)

  • Identified 81% of voltage-defined channels

Andreu D. et al. Circ Arrhythm Electrophysiol. 2011;4:674

Scar=red BZ=green

Comparison of Three Gray Zone Algorithms

FWHM NSD

  • Mod. FWHM

50 100 150

Gray Zone Mass (n=41)

Mesubi R et al. . Int J Cardiovasc Imaging. 2015;31(2);359

Resolution-Dependency of Gray Zone (Partial Volume Effect)

  • LAD-occlusion model in rats (n=8)
  • 7T MRI with voxel size of 50x50x50 m
  • Gray zone increase from 7 to 14% (p<0.01)

Schelbert et al. Circ Cardiovasc Imaging 2010;3;743

slide-14
SLIDE 14

Positron Emission Tomography

FDG PET/CT Imaging: Molecular Imaging

PET CT

PET/CT Fusion CT PET PET/CT

3D Volume Rendering:

Visualization of Epicardium and Endocardium

PET: Detection of Falsely-Low Voltage Recordings 4±2% of LV Mapping Points

Dickfeld et al. JACC CV IM;1:73:2008

slide-15
SLIDE 15

PET/Voltage Scar Correlation

  • Registration Accuracy:

3.7±0.7mm

  • Scar Burden:

Voltage: 21.4±37.2% PET: 20.1±38.9% r = 0.88; p <0.05

  • PET Scar (p<0.05):

bi/unipolar voltage latency/fractionation

Dickfeld et al. JACC CV IM;1:73:2008

Metabolic VT Substrate

PET: Detection of Metabolically Alive Myocardium within Scar

Dickfeld et al. JACC CV IM;1:73:2008

PET: Detection of Scar within Normal Myocardium

Metabolic VT Substrate

Dickfeld et al. JACC CV IM;1:73:2008

VT from Lateral LV Base

Metabolic Properties of Scar/BZ

52 68 87 10 20 30 40 50 60 70 80 90 Scar Border Zone Normal FDG Uptake [% of SegMax] p<0.05 p<0.05

7% 5% 88%

Tian et al. JCE 2008;20:597

slide-16
SLIDE 16

Voltage Map PET Scar PET Scar/BZ Metabolic Evaluation

PET/CT: Substrate Characterization

3D Scar Characterization

Tian et al. JCE 2008;20:597

PET/EAM Correlations

  • 19 post-MI VT RFA
  • 50% FDG-PET scar

threshold (68.6±49.2cm2)

  • 0.9mV best correlation

(70.4±49.3 cm2)

  • 7 ischemic VT patients
  • Voltage areas of <0.5V, 0.5-

1V and 1-1.5V correlated with FDG PET uptake of 43.1%, 49.5% and 60.1%

Fahmy T et al. Heart Rhythm 2008;5:1538 Kettering K et al. Clin Res Cardiol 2010;99:753

SPECT

  • Thallium-201 imaging widely available
  • Ten patients with ischemic VT:

Scar (49±29%), Border zone (57±21%) and healthy myocardium (77±14%) Polar Map: Thallium/Bipolar Voltage 68- segment model

Tian et al. J Nucl Med. In print.

SPECT

  • ROC-curve: 70% cut-off with AUC of 0.79±0.03
  • SPECT scar (18.8±5.2% ) best approximated

<1.5mV area (20.8±15.7%) vs. <0.5mV (5.8±5.8%).

  • All 14 successful RF sites within the SPECT-defined

scar/border zone

Tian et al. J Nucl Med. In print.

Registered SPECT Scar

ROC

slide-17
SLIDE 17

Cardiac Innervation

  • I-123-metaiodobenzylguanidine
  • MIBG: norepinephrine analog
  • similar transport and storage
  • cardiac sympathetic activity
  • regional efferent adrenergic

neuronal function

  • Previous studies: only global cardiac MIBG uptake
  • Predictive in chronic heart failure: cardiac mortality,

ventricular arrhythmias, SCD and HF progression

Jacobson et al. JACC 2010 Boggers et al. JACC 2010 Tamaki et al. JACC 2009 Ngahara et al. J Nucl Med 2008 Merlet et al. J Nucl Med 1992

SPECT Innervation Imaging

HMR 1.33 HMR 1.14

Planar Imaging ~ Global Innervation

Tamaki et al. JACC 2009 Jacobson et al. JACC 2010

SPECT MIBG: Regional Innervation

SPECT Mapping system Voltage Map 3D Reconstruction

% MIBG defect % voltage scar p-value 27±10 11±9 0.001 Klein et al. Circ Arrhythm Electrophysiol. 2015 8(3):583-91

slide-18
SLIDE 18

Bipolar map Bipolar map + innervation defect

Feasibility Trial (n=15): 36% of successful ablations with >1.5mV voltage, but all innervation defect

  • Successful Ablation sites -

MIBG: Regional Innervation

Klein et al. Circ Arrhythm Electrophysiol. 2015 8(3):583-91

Moving Beyond

  • Multi-Modality Assessment -
  • 13 patients with ICM and triple data sets
  • CMR, MIBG, EP map

Kiddy et al. Submitted.

  • All 11 VT channels in denervated CMR scar
  • Fibrosis + Denervation: Proarrhythmic Region?

Moving Beyond

  • Multi-Modality Assessment -

Kiddy et al. Submitted.

CMR Guidance for Endo/Epicardial Ablation

Reithman C. Clin Res Cardiol 2016

slide-19
SLIDE 19

CMR Guidance for Endo/epicardial Ablation

Reithman et al Clin Res Card 2016 44 NICM pts Epi only (4) or predominant epi (12) Endo (9): success:2 Epi (7): success 7 Njeim et al JCE 2016 12 NICM, 8 ICM pts Epi LGE (9), endo-

  • r septal LGE or

artifact (11) Epi LGE~EPI VT: 9 Andreu et al Eur Heart J 2014 80 NICM pts Subepi LGE (14.3%

  • f pts) with

84.6/100% sensitivity/specificit y for Epi VT Epi (11): success:11 Piers et al Circ A&E 2013 19 NICM pts Basal anteroseptal scar (42%), inferolateal scar (47%) 63% of inferolateral scar needed epi access

Effect of Imaging on VT Ablation Procedure

  • 116 VT RFA pts (67 ICM;

30 NICM; 19 ARVC)

  • MDCT 91%; CMR 30%;

both 22%)

  • Imaging identified 89% of

VT isthmi

  • Yamashita S. JCE 2016;27:699
  • Motivated additional mapping and epicardial

access in 57% and 33%

  • CA/phrenic nerve integration modified epicardial

RF strategy in 43%

  • 125 post-MI VT patients from 2009-2013
  • Image Integration in 38% (CMR 39%, CT 93%)
  • MV analysis: reduced VT recurrence: LAVA

elimination (RR=0.52) image integration (RR=0.49), use of multipolar catheters (RR 0.75)

Effect of Imaging on VT Ablation Outcomes

Yamashita et al. Circ A&E. 2016, EPUB

  • Not randomized, more

imaging in later years with better RFA technology, sicker patient (e.g. VT storm)=less imaging?

  • 3D Mapping used in
  • nly 51% of non-image

guided VT ablations

  • More LAVA with image

integration

  • Longer procedure time

Effect on VT Ablation

Yamashita et al. Circ A&E. 2016, EPUB

slide-20
SLIDE 20

PET – Metabolic Border Zone

  • 35 patients with ischemic (69%) and non-ischemic

(31%) CMP following after VT ablation (EF 27±10%)

  • Mortality of 31% after 18 months (IQR 12-48)
  • Segmental analysis:

19% PET scar (<50%) 28% PET BZ (50-70%) 53% normal (>70%)

Brian Miller, AHA 2011

PET – Metabolic Border Zone

Bottom 50% BZ Top 50% BZ

[Days]

Brian Miller, AHA 2011

Conclusion

  • Imaging reported mostly as single center

feasibility trials

  • No prospective studies or multi-center trials
  • f value of image integration
  • Established track record for anatomic and

scar imaging

  • Emerging evidence to guide epicardial RFA
  • Possibly improved procedural outcome
  • Current Challenges: Variable ablation

strategies, commercial image integration capabilities just emerging

Thanks

  • Jean Jeudy
  • Vasken Dilsizian
  • Mark Smith
  • Wengen Chen
  • Steve Shorofsky
  • Tas Saliaris
  • Vincent See
  • Seth Kligerman
  • Jing Tian
  • Ben Remo
  • Ghada Ahmad
  • Hasan Imanli
  • Kiddy Umi
  • Emi Bob-Manuel
  • Alejandro Jimenez
  • Olurotimi Mesubi
  • Tom Klein
  • Shaun Bhatty
  • Mohammed Abdulghani
  • Ayman Hussein
  • Ramazan Asoglu
  • Taehoon Shin
  • Hiroko Beck
  • Mussaber Ahmad

www.umm.edu/heart/macig