Chehalis Basin Strategy: Reducing Flood Damage and Enhancing - - PowerPoint PPT Presentation
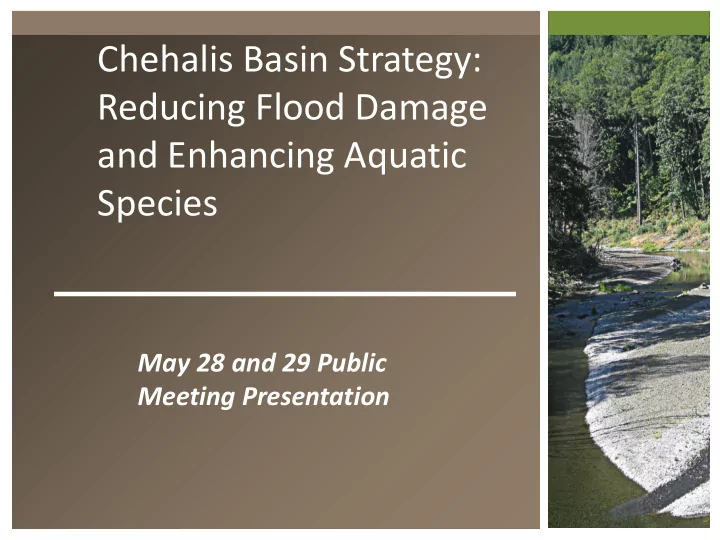
Chehalis Basin Strategy: Reducing Flood Damage and Enhancing Aquatic Species May 28 and 29 Public Meeting Presentation Purpose of Public Meeting Inform you of the process and analysis to develop a long-term strategy for flood damage
2
Purpose of Public Meeting
- Inform you of the process and analysis to develop
a long-term strategy for flood damage reduction and aquatic species enhancement
- Gain your input prior to conducting a benefit cost
analysis and other analyses to compare different scenarios and strategies for reducing flood damage and enhancing aquatic species.
5/28-29/2014
3
- Salmon populations are 15-25% of historic levels.
CHALLENGE: NEED FOR FISHERY ENHANCEMENT
Upper Chehalis (5/31/2010) JAMES E. WILCOX / WILD GAME FISH CONSERVATION INTERNATIONAL www.chehalisbasinpartnership.org
5/28-29/2014
4
Challenge: History of Flood Damage
March 1910 December 1933 January 1974 November 1990
5/28-29/2014
5
Changing the Long History Political Failure
- No action since 1933.
- More than 830 studies.
- Today is different . . .
Adna Levee, 2013 Montesano WWTP, 2014 Airport Levee, 2014 Aquatic Species Surveys, 2013
5/28-29/2014
6
CHEHALIS RIVER BASIN FLOOD AUTHORITY
Grays Harbor County City of Aberdeen City of Cosmopolis City of Montesano City of Oakville Thurston County Town of Bucoda Lewis County City of Centralia City of Chehalis City of Napavine Town of Pe Ell
5/28-29/2014
7
Current Projects Underway in the Chehalis Basin
THURSTON COUNTY
- 18. Bucoda Levee
- 19. Allen Creek Restoration
- 20. Flood Gage Station
LEWIS COUNTY
- 13. Oxbow
Reconnection at RM 78
- 14. Adna Levee
- 15. Airport Levee
(Phase I)
- 16. Wastewater
Treatment Plant Flood Prevention
- 17. Critter Pads,
Evacuation Routes (Phase I)
BASIN-WIDE PROJECTS
- 21. Basin-wide Aquatic Species Plan
- 22. Critter Pads, Evacuation Routes (Phase II) and Geomorphic Analysis
STATUS: Finished / Underway
GRAYS HARBOR COUNTY
1. Burger King Trail/Dike 2. Dike Bank of Wishkah North of Highway 3. Market Street Dike 4. Southside Dike/Levee Certification 5. Oxbow Lake Reconnection 6. Sickman-Ford Overflow Bridge 7. Mill Creek Dam Improvement 8. Elma-Porter Flood Mitigation 9. Satsop River Floodplain Restoration (Phase I) 10. Wishkah Road Flood Levee 11. Revetment for Montesano Road, Sewage Treatment 12. Satsop River Floodplain Restoration (Phase II)
5/28-29/2014
8
Governor’s Chehalis Basin Work Group
- Appointed by Gov. Gregoire (2012); Re-confirmed by Gov. Inslee (2013).
- Developed Framework, $28.2 capital budget (2013-15).
- Tasked by Governor recommend next steps for water retention; I-5; Other
Basin improvements; Aquatic species enhancement.
- Members are:
David Burnett (Chairman Chehalis Tribe). Karen Valenzuela (Thurston County Commissioner, Vice-Chair Flood Authority). Vickie Raines (Mayor Cosmopolis, Chair Flood Authority). J. Vander Stoep (Private Attorney, Pe Ell Alternate Flood Authority). Jay Gordon (President Washington Dairy Federation and Chehalis Farmer). Rob Duff (Governor’s Natural Resource Advisor). Keith Phillips (Governor’s Energy and Environment Advisor).
5/28-29/2014
Enhancing Aquatic Species
10
Species
22 key species evaluated
- Spring Chinook, Fall Chinook, Coho and Winter Steelhead
- 11 Other fish
- 7 Other Aquatic Species
5/28-29/2014
11
Salmon Runs
20000 40000 60000 80000 100000 120000 1970 1973 1976 1979 1982 1985 1988 1991 1994 1997 2000 2003 2006 2009 2012 Number of Returns Year
Coho ESC Coho TR Fall-run Chinook ESC Fall-run Chinook TR Spring-run Chinook ESC Spring-run Chinook TR Winter-run Steelhead ESC Winter-run Steelhead TR
5/28-29/2014
12
Salmon – Habitat Potential
Species Current Natural Conditions Habitat Impairment Spring Chinook Salmon 3,349 15,287 78% Fall Chinook Salmon 25,459 46,052 45% Coho Salmon 24,144 78,986 69% Winter-run Steelhead 4,557 8,102 44%
5/28-29/2014
13
Salmon Habitat Potential by Sub- Population
5/28-29/2014
14
Other Fish and Aquatic Species
Olympic Mudminnow Redside Shiner Northern Pikeminnow Longnose Dace Largescale Sucker Sculpin (6 species) Oregon Spotted Frog
Andrew O’Connor
Western Toad
5/28-29/2014
15
Limiting Factors
- Most prevalent are
- Barriers
- Riparian degradation
- Water quantity and quality (flows and temperature)
- Sedimentation
- Channel complexity and stability (lack of wood)
- Loss of floodplain habitat/connectivity
5/28-29/2014
16
(2014 model; climate change conditions using 2040s parameter change estimates; median last 10 years (2091-2100)) Percentages in table below are in comparison to Existing conditions
Effects of Climate Change (mainstem Chehalis River)
- Percentages are changes in medians of last 10 years in time
series (2091-2100), compared to current conditions
Species
Climate Change
Spring Chinook
- 100%
Coho
- 5%
Winter Steelhead
- 62%
5/28-29/2014
17
Enhancement Scenarios Modeled
- 1. Remove/improve barriers to fish passage (culverts) –
benefit to coho, steelhead and fall Chinook (not spring Chinook)
- 2. Riparian enhancement in managed forests – all stocks
- 3. Riparian enhancement to restore 50% of Spring
Chinook spawning reaches outside of managed forests, combined with restoring large wood attribute by 50% in same reaches; includes mainstem – all stocks
5/28-29/2014
18
Enhancement Costs and Results
Scenario Cost Range ($ M) Spring Chinook Coho Fall Chinook Winter steelhead
- 1. Culverts
26 - 50 0% 12% 3% 24%
- 2. Managed
forests
- 15 – 26%
11 – 22% 6 – 9% 8 – 15%
- 3. Non-
managed forests 37 - 84 40 – 76% 17 – 28% 6 – 11% 7 – 12% Total 63 – 134 55 – 102% 40-62% 15 – 23% 39 – 51%
5/28-29/2014
Reducing Flood Damage
20
2007 Storm: $938M Basin-wide damage
Exit 77 (I-5) in Chehalis STEVE RINGMAN / SEATTLE TIMES Photos Source: LEWIS COUNTY, DIVISION OF EMERGENCY MANAGE State Route 6, West of Adna MIKE SALSBURY / AP City of Centralia STEVE RINGMAN / SEATTLE TIMES
5/28-29/2014
21
RANKED HIGH-FLOW EVENTS:
Chehalis River Flow Rates near Grand Mound (cubic ft./sec.)
5/28-29/2014
Interstate 5 closed 1990, 1996, 2007, 2009 Five largest events have all occurred since 1986 -- Frequent floods are getting worse and damage is increasing . . . 100 year flood estimate increase 33% in last 30 years.
9 13 7 13 11 6 16 10
4 3
8
2
12 15
1 5
10000 20000 30000 40000 50000 60000 70000 80000 90000 1932 1934 1936 1938 1940 1942 1944 1946 1948 1950 1952 1954 1956 1958 1960 1962 1964 1966 1968 1970 1972 1974 1976 1978 1980 1982 1984 1986 1988 1990 1991 1993 1995 1996 1998 2000 2002 2004 2006 2008 2010 2012
22
Climate Change Effects on Peak Flows
Latest report from the UW Climate Impacts Group (CIG) suggests:
- Rain dominant basins (like the Chehalis)
will see increase in 100-year flood of 11% to 26%
- Does not include projected changes in
heavy rainfall
- New study suggests increase may be 10
– 50% or more (forthcoming paper)
5/28-29/2014
23
Structures Affected – Climate Change 18 percent increase
5/28-29/2014
Summary of Structures At Risk of Flooding in Chehalis River Floodplain Number of Structures Baseline 100-Year w Climate Change 100-Year 100-Year Change vs Base Flooded 1384 2202 59% >1.0 feet 829 1462 76% >2.0 feet 489 830 70% >3.0 feet 293 481 64% >4.0 feet 155 301 94% >5.0 feet 76 161 112% Assessed Value of Improvements Inundated ($Million) $137 $255 86%
24
- Required by 2011 Legislature.
- Summarized what is known about potential
projects.
- Created a common base of understanding.
Ruckelshaus Center Report
http://ruckelshauscenter.wsu.ed u/ChehalisFlooding.html
5/28-29/2014
25
- Water Retention Feasibility.
- Protection of I-5.
- Floodproofing and Small Projects
- Land Use Changes.
Reducing Flood Damage - Feasibility Analyses
5/28-29/2014
26
Water Retention Structure Options Selected for Evaluation
- Flood Retention RCC* Dam (FR-RCC)
- Multipurpose RCC Dam (MP-RCC)
- Multi-purpose Rockfill Dam (MP-Rockfill)
*Roller Compacted Concrete (RCC)
5/28-29/2014
27
Flood Retention Only Reservoir
- Dam Height = 227’
- Spillway Crest Elev. = 628
- Dam Crest Elev. = 654
- Area = 860 Acres
- River Inundation Length = 6.8 mi
- Maximum Storage = 65K acre/feet
5/28-29/2014
28
Flood Retention Only RCC Dam
Footprint = 6 acres
5/28-29/2014
29
Multi-purpose Reservoir Overview
5/28-29/2014
- Dam Height = 287’
- Spillway Crest Elev. = 687
- Dam Crest Elev. = 714
- Area = 1,307 Ac
- River Inundation Length = 7.5 mi
- Maximum Storage = 130K acre/feet
30
Multi-purpose RCC Dam
5/28-29/2014
Footprint = 10 acres
31
Multi-purpose Rockfill Dam
5/28-29/2014
Footprint = 40 acres
32
Objectives for Dam Operation
- Provide flood reduction in downstream areas
- Preserve geomorphic processes downstream
- Maintain slope stability in reservoir
- Keep rate of change in flows downstream within
accepted limits to minimize fish stranding
- Store water during winter and release during
summer for fisheries and water quality enhancement (Multi-purpose Alternative)
5/28-29/2014
33
Reservoir Inflow/Outflow during Large Flood – 100-Year Flood
5/28-29/2014
34
Summary of Flood Reduction Benefits
- Used 1 percent of time based on historic record
- Reduces flows by @15% for 10-100 year
- 100 year to 40 year event, 1.5 feet lower in Centralia, 0.5
lower in Montesano.
- I-5 Closed less frequent and for less time
- Multi-purpose increases summer low flows by factor of 3-
6.
5/28-29/2014
100 Year With Dam Difference Climate Floodplain Structures 1384 821 563 2202 Value of Structures ($Mil) $137 $73 $64 $255
35
Water Retention Cost Comparison (Mitigation costs not included)
5/28-29/2014
Alternative Preliminary Class 5 Cost Estimate 2014 $M, Average Estimated Value and +/- Range Dam Fish Passage Upstream Fish Passage Downstream Hydropower Total Range Flood Only
265-421
265-421 Multi Purpose with Fish passage
322-512 10-18 17-30 20-25
369-585 Rock Fill Multi Purpose
408-566 40-70 27-47 20-25
495-708
Note: These costs are preliminary Class 5 estimates for screening purposes only. They should not be used for budgetary purposes
Aquatic Species Impacts from Water Retention
37
Effects on Habitat Downstream
- Dam operation could affect:
- Peak flows (sediment transport)
- Sediment input (reservoir storage, change in bank erosion)
- Large woody debris input/transport
- Potential Key Geomorphology/Habitat Effects
- Substrate (spawning gravel, interstitial rearing, etc.)
- Channel forming processes (meander rate, LWD input,
holding pools, etc.)
- Floodplain and off-channel connectivity
5/28-29/2014
38
Summary at Basin Scale - EDT
Species Current Multi-purpose Flood Retention 100% Flood Retention 50% Coho salmon
- 2%
- 3%
- 2%
Fall Chinook
- 3%
- 3%
- 3%
Spring Chinook
- 2%
- 12%
- 10%
Winter Steelhead
- 8%
- 6%
- 3%
5/28-29/2014
Protecting I-5 and SR 6/12
40
Conceptual Alternatives to Protect I-5
- Raise I-5 using fill material – Dropped
- Raise only
- Raise and widen to six lanes
- Raise I-5 using a viaduct (long bridge with piers) - Dropped
- Relocate I-5 outside flood area - Dropped
- Construct I-5 express lanes – On Hold
- Construct I-5 temporary by-pass lanes – On Hold
- Protect I-5 with walls and levees – Assessing
5/28-29/2014
41
Protect I-5 with walls and levees
Approach
5/28-29/2014
- Design Concept for Walls
- Install at edge of pavement
- Use to avoid impacts
- Design Concept for Berms
- Use where adjacent ground is not
too high
- Use to develop storm water
treatment areas
Protect I-5 with walls and levees
Project Cost: $ 80 – 100 Million
Highway 6 and 12 Flooding
44
2007 Flooding on US 12 at Anderson Road
East of Black River Bridge
Looking East on US 12
5/28-29/2014
45
2007 Receding Flood Over SR 6 Near Adna
To Doty Adna Chehalis SR 6
N
5/28-29/2014
46
2007 Flood Near Scheuber Road
- S. Scheuber Road
Receding flood over SR 6, “Near Scheuber Road”
N
To Adna To I-5
5/28-29/2014
47
2007 Flood Receding Near Boistfort Road
To Doty Boistfort Road To Adna
N
5/28-29/2014
48
US 12 and SR 6 Improvements
(Pre-Scoping Estimates)
- US 12 – East of Black River
$ 12-15 Million*
- SR 6 – Near Adna
$ 11-14 Million*
- SR 6 – Near Scheuber Rd
$ 3-5 Million*
- SR 6 – Near Boistfort Rd
$ 4-6 Million*
Subtotal $ 30-40 Million*
(Plus Other Flood Areas – Est. $ 5-15 Million*)
*Does not include costs for mitigation (100-year event with flood control structure)
5/28-29/2014
Small Projects
50
Process
- Identified a long list of projects through review of
past reports and meetings with communities
- Developed criteria to prioritize projects
- Prepared a short list of 37 projects most likely to
meet criteria
- Consultant team evaluated projects
- Floodproofing is also being evaluated in this task
5/28-29/2014
51
Projects Selected for Additional Analysis Now
- City of Napavine, Kirkland Road Flooding
- WSDOT/Lewis County, SR 6 Overflow
- City of Chehalis, Dillenbaugh Creek Realignment
- City of Chehalis, Main Street Regrade
- Lewis County, Salzer Creek
- Town of Bucoda, Main Street Regrade
- Chehalis Tribe, Black River Bridge
- Chehalis Tribe, Roundtree Creek
- Grays Harbor County, Wynoochee Valley Road Regrade
- City of Aberdeen, Fry Creek
- Floodproofing all structures in floodplain
5/28-29/2014
52
Project Locations
5/28-29/2014
Floodproofing
54
Estimated Costs for Floodproofing
Baseline conditions 100-year event totals
Residential Structures - $57,000,000 Commercial Structures - $21,000,000 Agricultural Structures - $14,000,000 Total - $92,000,000
5/28-29/2014
55
Floodproofing - Structures Affected
Summary of Structures At Risk of Flooding in Chehalis River Floodplain Number of Structures Baseline With Dam and Airport Levee Dec 07 500-Year 100-Year 20-Year 10-Year Dec 07 500-Year 100-Year Flooded 2040 3645 1384 372 175 753 2031 821 >1.0 feet 1368 2743 829 167 83 432 1306 459 >2.0 feet 820 1926 489 76 28 241 762 241 >3.0 feet 470 1159 293 22 7 139 471 117 >4.0 feet 263 657 155 6 2 65 300 54 >5.0 feet 159 385 76 1 28 158 25 Assessed Value of Improvements Inundated ($Million) $238 $411 $137 $30 $13 $64 $206 $73 Cost to Floodproof all Inundated Structures ($Million) $146 $273 $92 $20 $9 $46 $149 $50 Residential ($ Mil) $107 $205 $57 $10 $4 $28 $101 $28 Commercial ($ Mil) $26 $44 $21 $6 $3 $11 $26 $12 Agricultural ($ Mil) $13 $24 $14 $4 $2 $7 $22 $10
5/28-29/2014
56
Floodproofing
- No environmental impacts from this alternative
- Cost is preliminarily estimated to be $92 million –
$146 million (100-year to 2007 event)
- Costs rise by 75% when climate change is
accounted for (from $92 million to $161 million for 100-year event)
5/28-29/2014
Next Steps
58
- Aquatic species enhancement
- Water retention
- I-5 Improvements
- Small projects
- Floodproofing homes and businesses
- Total cost depends on what options are included in
recommendations
- Current price range for all $500M to $1.2 Billion
(includes $60M-$100M improvements along I-5)
Preliminary Cost Estimates
5/28-29/2014
59
- Summer
- Finalize preliminary designs for water retention and I-5 improvements, and
assessment of costs, benefits and impacts.
- Finalize aquatics species enhancement plan.
- Assess local floodplain management.
- Conduct benefit/cost analysis and other comparisons
- September
- Technical and policy workshops, Flood Authority meeting, and public
meetings on final results and input for recommendations
- October -November 2014
- Governor’s Work Group finalizes recommendations to Governor and
Legislature.
Governor’s Work Group Process Overview
5/28-29/2014
60
More Information
- http://ruckelshauscenter.wsu.edu/ChehalisFlooding.html
- https://www.ezview.wa.gov/chehalisfloodauthority
5/28-29/2014
61
Your Questions and Comments
I-5 Under Water BRUCE ELY / OREGONIAN
5/28-29/2014