
SLIDE 1
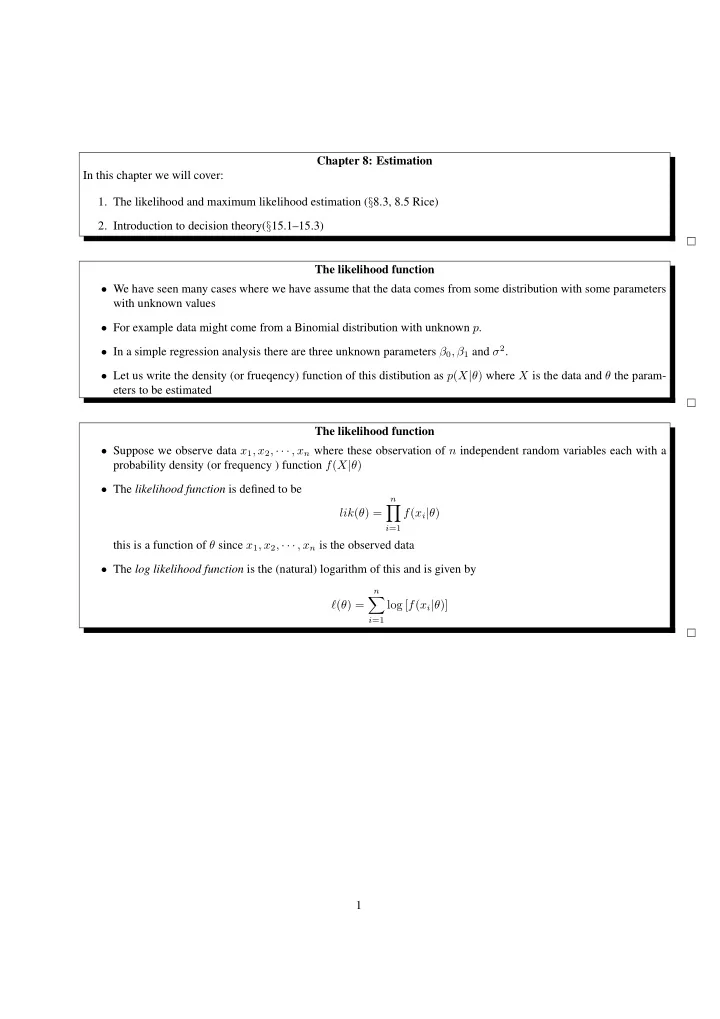
Chapter 8: Estimation In this chapter we will cover:
- 1. The likelihood and maximum likelihood estimation (§8.3, 8.5 Rice)
- 2. Introduction to decision theory(§15.1–15.3)
The likelihood function
- We have seen many cases where we have assume that the data comes from some distribution with some parameters
with unknown values
- For example data might come from a Binomial distribution with unknown p.
- In a simple regression analysis there are three unknown parameters β0, β1 and σ2.
- Let us write the density (or frueqency) function of this distibution as p(X|θ) where X is the data and θ the param-
eters to be estimated The likelihood function
- Suppose we observe data x1, x2, · · · , xn where these observation of n independent random variables each with a
probability density (or frequency ) function f(X|θ)
- The likelihood function is defined to be
lik(θ) =
n
- i=1
f(xi|θ) this is a function of θ since x1, x2, · · · , xn is the observed data
- The log likelihood function is the (natural) logarithm of this and is given by
ℓ(θ) =
n
- i=1
log [f(xi|θ)] 1