SLIDE 1
Chapter 17: The Expected Value and Standard Error
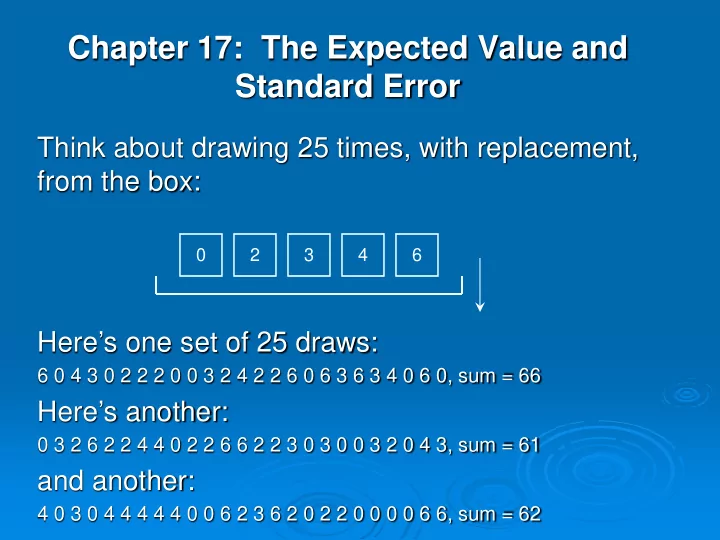
Think about drawing 25 times, with replacement, from the box: Here’s one set of 25 draws:
6 0 4 3 0 2 2 2 0 0 3 2 4 2 2 6 0 6 3 6 3 4 0 6 0, sum = 66
Here’s another:
0 3 2 6 2 2 4 4 0 2 2 6 6 2 2 3 0 3 0 0 3 2 0 4 3, sum = 61
and another:
4 0 3 0 4 4 4 4 4 0 0 6 2 3 6 2 0 2 2 0 0 0 0 6 6, sum = 62
2 4 3 6
SLIDE 2
What can we say about the sum of 25 draws from the box? The expected value for the sum of the draws is EVsum = (number of draws) (avebox) The standard error for the sum of the draws is SEsum = (√number of draws) (SDbox) avebox and SDbox are the average and the SD of the tickets in the box.
SLIDE 3
Example: The sum of 25 draws from the box: avebox = 3 SDbox = 2 so EVsum = (number of draws) (avebox) = (25)(3) = 75 and SEsum = √number of draws (SDbox) = (√25 ) (2) = 10
2 4 3 6
CALCULATOR!
SLIDE 4
What do the EVsum and SEsum tell us? Suppose we take many, many samples of size 25 and look at the sum of the draws:
0 2 4 4 3 4 4 0 4 4 4 3 4 2 6 3 2 2 3 6 4 2 4 6 4 sum = 84 4 0 6 0 2 6 4 2 0 4 0 2 4 4 3 0 6 0 6 6 4 4 4 4 3 sum = 78 6 2 6 3 3 3 4 6 4 0 0 3 3 0 2 4 2 2 6 3 0 3 0 4 2 sum = 71 3 0 2 4 4 0 0 4 4 0 2 3 2 2 3 0 6 2 3 3 2 6 4 3 4 sum = 66 2 2 6 4 2 2 3 3 0 3 3 2 4 3 4 0 3 3 3 4 0 2 0 2 2 sum = 62 … …. 6 6 0 0 2 4 4 4 4 4 4 0 6 0 6 0 0 6 6 3 6 4 6 0 4 sum = 85 2 0 3 0 6 3 3 0 4 2 0 4 4 4 6 6 6 4 4 4 6 2 4 6 3 sum = 86 6 6 6 4 0 2 4 4 3 4 4 3 0 2 2 3 6 6 0 0 3 4 3 0 4 sum = 79 3 0 0 0 3 3 2 6 3 3 2 6 6 3 4 3 6 2 4 4 0 6 6 6 0 sum = 81 3 3 6 6 2 0 2 0 0 6 4 6 6 2 6 3 0 3 3 0 4 6 0 3 6 sum = 80
Many samples of 25 draws
SLIDE 5
The first 10 sums: 84 78 71 66 62 60 77 79 76 80, ave = 73.3, SD = 7.7 10 sums have ave = 73.3, SD = 7.7 100 sums have ave = 74.5, SD of 8.9. 1000 sums have ave = 75.0, SD of 9.7. 10000 sums have ave = 75.0, SD of 10.0. EVsum tells us the average of the SUM OF THE DRAWS SEsum tells us the SD of the SUM OF THE DRAWS. If we repeat the 25 draws MANY times, we expect the SUM OF THE DRAWS to be around EVsum, with an SD of SEsum.
SLIDE 6
Example 1. Consider the sum of 100 draws from the box What is the expected value of the sum? Its SE?
1 2 4 3 5 6
SLIDE 7
Example 2. (See Chapter 16, Example 5) You play a game in which you roll a die 10 times and get paid the amount shown on the die (each time). How much do you expect to win? Give or take how much?
SLIDE 8 Example 3. (See Chapter 16, Example 6) You play a game in which you roll a die 10 times. Each time a “6”
- ccurs, you win $10, otherwise you lose $1. How much do
you expect to win? Give or take how much?
SLIDE 9
Example 4. (See Chapter 16, Example 8) A multiple- choice test has 20 questions, each with 4 possible choices. Each correct answer is worth 5 points, and for each incorrect answer you lose 2 points. If you guess all the answers, what do you expect your test score to be? Give or take how much?
SLIDE 10
Example 5. A true/false test has 20 questions. Each correct answer scores 5 points; each wrong answer scores 0 points. If you guess all the answers, what is your expected score? Give-or-take how much?
SLIDE 11
Example 6. Bet $1 on “17” 100 times in roulette. How much do you expect to win? Give-or-take how much?
SLIDE 12
Example 7. Bet $100 on “17” once in roulette. What are the expected value and the SE for the amount you win?
SLIDE 13
Example 8. Bet $1 on “red” 100 times in roulette. How much money do you expect to win? Give-or-take how much?
SLIDE 14
Example 9. A child plays a game of chance in which she has a 30% chance of scoring 5 points, a 50% chance of scoring 3 points and a 20% chance of scoring 1 point. If she plays the game 20 times, what is her expected score? Give or take how much?
SLIDE 15
Classifying and Counting
If we want to count how many times something happens, the box has 0’s and 1’s. The 1’s represent the thing we are counting, and the 0’s represent everything else. Here is the box for rolling a die and counting the total number of spots we get: Here is the box for rolling a die and counting how many “6”s we get:
1 2 4 3 5 6 1
SLIDE 16
Example 10. Bet $1 on “red” 100 times in roulette. How many times do you expect to win? Give-or-take how many?
SLIDE 17
The Normal Curve
For a large number of draws, the sum of the draws will follow the normal curve with average EVsum and standard deviation SEsum. In particular, 68% of the time the sum of the draws will be between EVsum – SEsum and EVsum + SEsum. 95% of the time the sum of the draws will be between EVsum – 2 (SEsum) and EVsum + 2 (SEsum). We can use the normal curve to find the chance that the sum of the draws is in a region of interest. We use EVsum and SEsum to get standard units.
SLIDE 18 Note:
- It does not matter what is in the box.
- The histogram for the tickets in the box
does not have to follow the normal curve.
- The sum of the draws will follow the
normal curve, even if the tickets in the box are 0’s and 1’s!
- In fact, we don’t even need to know what is
in the box, we just need to know the average and the SD of the box.
SLIDE 19
Example 11. Roll a die 100 times and count the total number of spots. What is the chance the total number of spots is more than 367?
SLIDE 20
Example 12. Bet $1 on “red” 100 times in roulette. What is the chance you win more than $10? What is the chance you lose more than $10? What is the chance you come out ahead?
SLIDE 21 Example 13. A multiple-choice test has 20 questions, each with 4
- choices. Each correct answer scores 5 points; each wrong answer
makes you lose 2 points. If you guess all the answers, what is the chance you score more than 20 points?
SLIDE 22
Sampling without replacement from a LARGE population is just like sampling with replacement. Example 14. A large crop of apples has an average weight of 4.3 oz with an SD of 1.5 oz. I choose 100 apples at random. What’s the chance the total weight is less than 25 pounds?
SLIDE 23
Example 15. Suppose 10% of people in a large population are “underweight”. If we take a random sample of 1000 people from this population, what is the chance that more than 103 will be “underweight”?
SLIDE 24 Example 16. For HANES women, 19-24 a histogram of the amount of beef eaten over a 3-day period has an average of 22 grams and an SD
- f 41 grams. Suppose I choose 200 of these women, at random, and
look at the total amount of beef eaten. What’s the chance this total exceeds 5000g? Does it matter that the histogram is not like the normal curve? Why?