
SLIDE 1
Chapter 15
Conservation Outlook for the Tropics
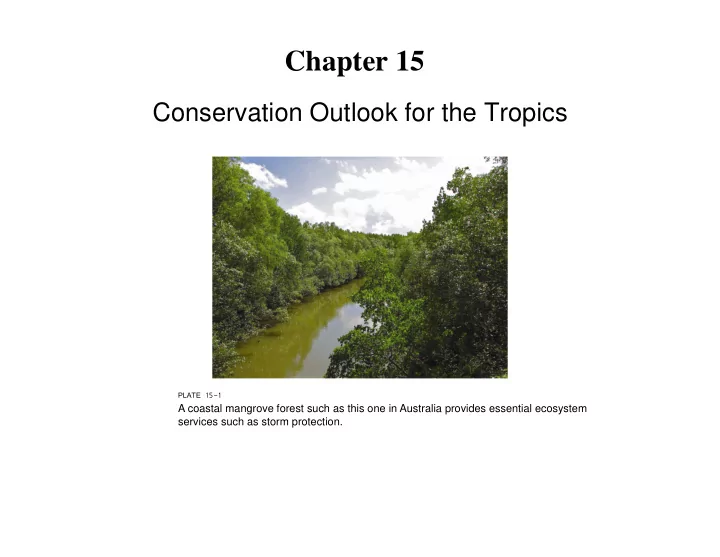
PLATE 15-1 A coastal mangrove forest such as this one in Australia provides essential ecosystem services such as storm protection.
Chapter 15 Conservation Outlook for the Tropics PLATE 15-1 A - - PowerPoint PPT Presentation
Chapter 15 Conservation Outlook for the Tropics PLATE 15-1 A coastal mangrove forest such as this one in Australia provides essential ecosystem services such as storm protection. PLATE 15-2 This road through a protected forest in Tanzania is a
PLATE 15-1 A coastal mangrove forest such as this one in Australia provides essential ecosystem services such as storm protection.
PLATE 15-2 This road through a protected forest in Tanzania is a popular resting place for a troop of baboons. However, most roads through tropical forests result in significant local impacts to wildlife and may result in loss of local biodiversity.
PLATE 15-3 This tract of mallee scrub in Australia fits the FAO definition of forest.
FIGURE 15-1 Ecological state changes starting from the reference condition of tropical old-growth forest. Only the principal drivers are included (in hexagons), and not all possible transitions away from the reference condition are depicted. Back transitions that result from natural succession as well as afforestation, reforestation, forest management, and other restoration activities are not indicated, to reduce figure clutter.
PLATE 15-4 This degraded forest in Amazonian Brazil (in Mato Grosso) has been largely cleared for logging and for conversion to
is due to thick smoke created by the burning of wood (during the dry season) from the cleared forest.
PLATE 15-5 This is a typical sight throughout much of the tropics—in this case, from Belize, Central America. It shows a pasture that once was closed forest. A lone kapok tree (Ceiba pentandra) remains uncut. FIGURE 15-2 The relationship between the percentage of closed-canopy forest remaining and rural population density for 45 humid tropical countries. Potential forest cover (the denominator of the ordinate) includes the forest and woodland biomes of Ramankutty and Foley (1999). Extant closed-canopy forest cover (the numerator of the ordinate) was taken from FAO (2000). Humid tropical countries were defined to be those countries with closed-canopy forest being the potential vegetation over 40% or more of their national territory and whose geographic centers were at latitudes below 24°.
PLATE 15-6 This secondary forest is ecologically distinct from mature rain
succession due to previous clearance and/or degradation by human activities.
PLATE 15-7 Distant fire in a forested area in eastern Venezuela.
PLATE 15-10 Logs at a collection area in Mato Grosso, Brazil. PLATE 15-9 Large trucks loaded with freshly cut logs are common in many places throughout the tropics. This truck was in Mato Grosso, Brazil. PLATE 15-8 This pine forest near Savannah, Georgia, is an example of a managed forest where clear-cutting is sustainable because the growth of the pines is rapid. Note the neat rows of trees.
FIGURE 15-3 This graph compares the number of tree species in relation to area
difference among them.
PLATE 15-11 Malaysian sun bear, threatened by increasing deforestation even within protected areas. FIGURE 15-4 These three maps show the extent of forest loss in GPNP and surrounding areas outside the park. The park is outlined in yellow. (a) is 1988, (b) is 1994, and (c) is 2002. Areas in red are deforested. The gray area is montane forest, not part of the analysis. Tan areas are peat forests, and green areas are lowland forests. Note how deforestation has dramatically increased outside the park (not just from logging but for oil palm plantations), at the park buffer zone and, by 2002, was extensive within the park boundary.
FIGURE 15-5 This map and the curves below it are estimates of the rate of temperature change in each major biome, measured in kilometers per year. Note that mangroves are experiencing a change of 0.95 kilometer/year, and tropical and subtropical moist and broadleaf forest is experiencing a rate of 0.33 kilometer/year.
FIGURE 15-6 These three maps document extinction risk to lizards
than 32ºC and greater than 29ºC. Note how the risk expands over time. PLATE 15-12 This basilisk lizard (Basiliscus basiliscus) in Belize is resting in the shady undergrowth. The thermal world of lizards requires constant adjustment to maintain a suitable body temperature, making them susceptible to climate change.
PLATE 15-13 Carbon source or sink? This lush forest in Trinidad could be either, depending on environmental conditions.
PLATE 15-14 CHIMPANZEE (PAN TROGLODYTES)
PLATE 15-15 BROWN TREE SNAKE
PLATE 15-16 This crested guan (Penelope purpurascens) is commonly hunted as bushmeat in Central America. It is an important seed disperser of some tree species.
PLATE 15-17 Animals such as this baboon (Papio anubis) are considered
tropical countries where they occur. This baboon was likely safe, residing in a carefully patrolled national park in Tanzania. FIGURE 15-7 Estimates of marine fish biomass (open circles) and large mammal biomass (dark circles) in Ghana.
PLATE 15-18 These skins were for sale. There are two ocelots, one red howler monkey, one puma, and one jaguar. They were killed by bushmeat hunters in Venezuela.
PLATE 15-19 Bushmeat will remain a major concern for conservation biologists throughout the tropics.
FIGURE 15-8 The two maps at the top represent the BAU scenario (map a) and the governance scenario (map b). The two maps at the bottom are projections for numbers of imperiled mammal species. Map c is the BAU scenario; map d is the governance scenario.
FIGURE 15-9 It is difficult to develop restoration methods at a particular site that optimize financial and livelihood benefits as well as generate improvements in biodiversity (top-right corner). Traditional monoculture plantations of exotic species (arrow 1) mostly generate just financial benefits, whereas restoration using methods that maximize diversity (arrow 2) and enhance biodiversity yields few direct financial benefits to landowners, at least in the short
improvements in both biodiversity and livelihoods, although the magnitude of the benefits depends on the population density of commercially or socially important species; these can be increased by enrichment of secondary forest with commercially attractive species (arrow 4). Restoration in landscapes where poverty is common necessitates attempting both objectives
necessary to give initial priority to forms of reforestation that improve financial benefits, such as woodlots (arrow 5). In subsequent rotations, this balance might change
a greater variety of species). There may be greater scope for achieving multiple objectives by using several of these
PLATE 15-20 Exotic grass species have become established on what was once dry forest in Venezuela.
FIGURE 15-10 The relatively optimistic projections expressed by Wright and Muller-Landau.
PLATE 15-21 The author (right) presents a Spanish edition of his book A Neotropical Companion to Olger Licuy, an expert ornithologist and local guide in Ecuador.
PLATE 15-22 Ecotourists, such as these people who were part of a workshop taught by the author at the Canopy Tower in Panama, each strive to promote conservation goals and understanding with local people as their travels take them to various tropical countries. PLATE 15-23 The unique Canopy Tower in Panama, converted from an old radar installation, affords ecotourists extraordinary canopy- level views of numerous rain forest animals. It is a major attraction for ecotourists and promotes strong conservation ethics. PLATE 15-24 Sunset on the Serengeti.