
Changes in road-user behaviours following the installation of raised pedestrian crossings on urban arterials
Victoria Gitelman, Roby Carmel, Fany Pesahov, Sarit Chen
Transportation Research Institute Technion – Israel Institute of Technology
28th ICTCT Workshop in Ashdod, Israel
- n 29th – 30th October 2015
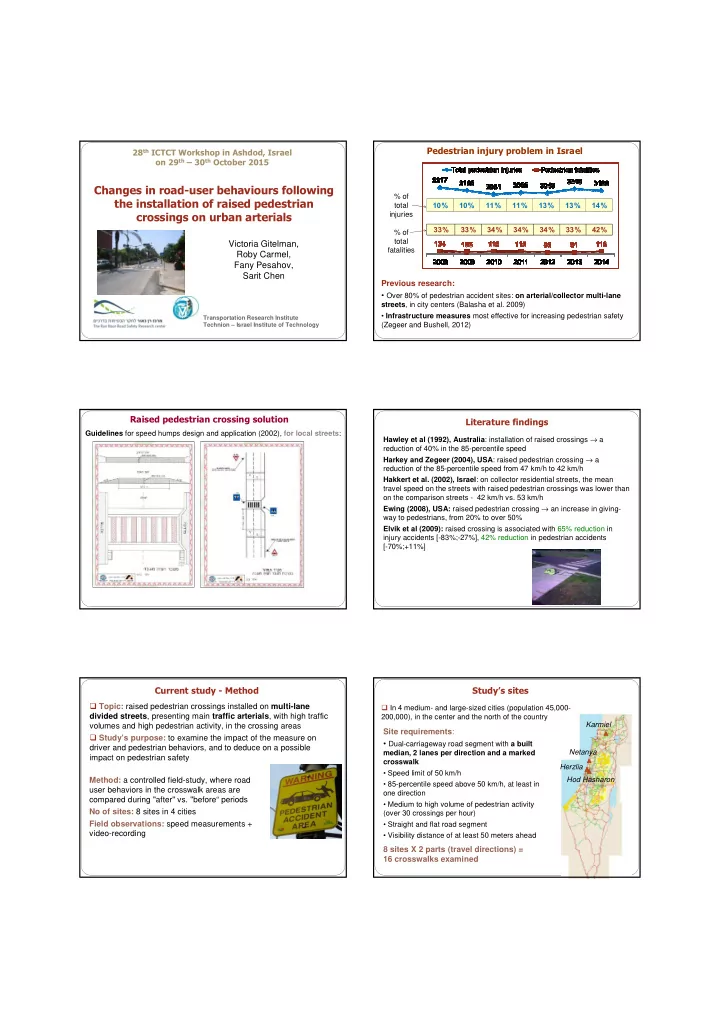
Pedestrian injury problem in Israel
% of total injuries % of total fatalities
Previous research:
- Over 80% of pedestrian accident sites: on arterial/collector multi-lane
streets, in city centers (Balasha et al. 2009)
- Infrastructure measures most effective for increasing pedestrian safety
(Zegeer and Bushell, 2012) 10 % 10 % 11 % 11 % 13 % 13 % 14 % 33 % 33 % 34 % 34 % 34 % 33 % 42 %
Raised pedestrian crossing solution
Guidelines for speed humps design and application (2002), for local streets:
Literature findings
Hawley et al (1992), Australia: installation of raised crossings → a reduction of 40% in the 85-percentile speed Harkey and Zegeer (2004), USA: raised pedestrian crossing → a reduction of the 85-percentile speed from 47 km/h to 42 km/h Hakkert et al. (2002), Israel: on collector residential streets, the mean travel speed on the streets with raised pedestrian crossings was lower than
- n the comparison streets - 42 km/h vs. 53 km/h
Ewing (2008), USA: raised pedestrian crossing → an increase in giving- way to pedestrians, from 20% to over 50% Elvik et al (2009): raised crossing is associated with 65% reduction in injury accidents [-83%;-27%], 42% reduction in pedestrian accidents [-70%;+11%]
Current study - Method
Topic: raised pedestrian crossings installed on multi-lane divided streets, presenting main traffic arterials, with high traffic volumes and high pedestrian activity, in the crossing areas Study’s purpose: to examine the impact of the measure on driver and pedestrian behaviors, and to deduce on a possible impact on pedestrian safety Method: a controlled field-study, where road user behaviors in the crosswalk areas are compared during "after" vs. "before“ periods No of sites: 8 sites in 4 cities Field observations: speed measurements + video-recording
Study’s sites
In 4 medium- and large-sized cities (population 45,000- 200,000), in the center and the north of the country
Site requirements:
- Dual-carriageway road segment with a built
median, 2 lanes per direction and a marked crosswalk
- Speed limit of 50 km/h
- 85-percentile speed above 50 km/h, at least in
- ne direction
- Medium to high volume of pedestrian activity
(over 30 crossings per hour)
- Straight and flat road segment
- Visibility distance of at least 50 meters ahead
8 sites X 2 parts (travel directions) = 16 crosswalks examined
Karmiel Netanya Herzlia Hod Hasharon