
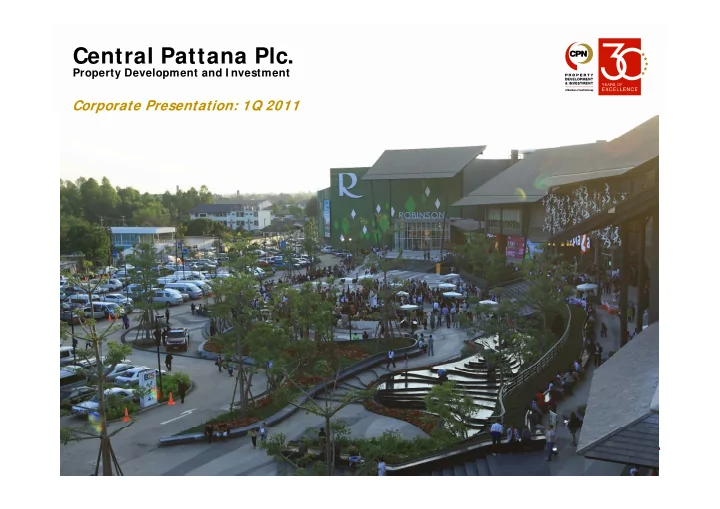
SLIDE 1
Central Pattana Plc.
Property Development and I nvestment
Corporate Presentation: 1Q 2011
1
Central Pattana Plc. Property Development and I nvestment Corporate - - PowerPoint PPT Presentation
Central Pattana Plc. Property Development and I nvestment Corporate Presentation: 1Q 2011 1 Disclaimer The information contained in this presentation is for information purposes only and does not constitute an offer or invitation to sell
1
solicitation of an offer or invitation to purchase or subscribe for share in Central Pattana Public Company Limited (“CPN” and shares in CPN “shares”) in any jurisdiction nor should it or any part of it form the basis of or be relied upon in any connection with any contract or CPN, shares ) in any jurisdiction nor should it or any part of it form the basis of, or be relied upon in any connection with, any contract or commitment whatsoever.
risks, uncertainties and other factors which may impact on the actual outcomes, including economic conditions in the markets in which CPN t d l hi t f CPN b i f t hi h ill th t l lt f hi t f CPN operates and general achievement of CPN business forecasts, which will cause the actual results, performance or achievements of CPN to differ, perhaps materially, from the results, performance or achievements expressed or implied in this presentation.
representation, warranty, express or implied, is made as to, and no reliance should be placed on, the fairness, accuracy, completeness
respective affiliates, advisers or representatives, shall have any liability (in negligence or otherwise) for any loss howsoever arising from any use of this presentation or its contents or otherwise arising in connection with this presentation.
p , p p y p p p directly or indirectly for any investment decision-making or for any other purposes.
be reproduced, redistributed or made available to any other person, save in strict compliance with all applicable laws.
2 Note: All currency figures within this presentation are presented in Thai Baht unless otherwise stated.
3
CG Scoring” honored the company’s corporate governance performance.
Thailand with a 22% market share in Bangkok’s mall
Design and Development – CentralWorld” honored and recognized the most outstanding shopping center design and development of CentralWorld. leaseable area.
2 hotels, and 2 residential properties in Thailand.
the unique and exceptional design and environment concerns of CentralWorld.
TRIS Rating in A g st 2010
complex through green-field developments, acquisition & redevelopments and asset enhancement projects.
synergies with its major shareholders Central Group and TRIS Rating in August 2010. synergies with its major shareholders, Central Group and Thailand Equity Fund, and unmatched financing capability through its property fund.
Exchange of Thailand (SET) with a market capitalization of
Shareholder’s Value Appreciation
d 6 Years CPN share price compared to SET I ndex and Property I ndex (based price on year 2005)
Exchange of Thailand (SET) with a market capitalization of
in Thailand’s largest REIT - CPN Retail Growth Leasehold Property Fund (CPNRF) with a market capitalization of
250 300 350 400 450 Index
SET PROP CPN
Property Fund (CPNRF) with a market capitalization of
100 150 200 an-05 pr-05 Jul-05 Oct-05 an-06 pr-06 Jul-06 Oct-06 an-07 pr-07 Jul-07 Oct-07 an-08 pr-08 Jul-08 Oct-08 an-09 pr-09 Jul-09 Oct-09 an-10 pr-10 Jul-10 Oct-10 an-11
5 Source: SetSmart as of 31 March 2011. Note 1: As of 31 March 2011. CPN share price at Bt27.25 per share. CPNRF unit price at Bt12.30 per unit. Exchange rate at Bt30.4348 per $USD.
Ja A J O Ja A J O Ja A J O Ja A J O Ja A J O Ja A J O Ja
Established under “Cen CentralPla lPlaza za Co Co., Lt ., Ltd.” 2002 2002 Opened 2009 2009 Opened “Centra ralFes lFestiva tival Patta attaya Beach ach”, “Cen CentralPla lPlaza za Ch Chonbur buri” AND “Cen CentralPla lPlaza za Kh Khon Kaen Kaen”
pment
2010 2010 2011 2011 Opened “CentralP alPlaza Chiangrai ai”, Open Cent
CentralP lPlaz laza Pisanulok Pisanulok , Ce Centr ntralPlaza lPlaza Rama Rama 9
1982 1982 Opened “Cen CentralPla lPlaza za Ladpr Ladproa
The first integrated shopping complex in Thailand 1995 1995 Opened “Cen CentralPla lPlaza za Pi Pink nklao” AND “Centr Central Center l Center Patta ttaya” 1997 1997 Opened “Cen CentralPla lPlaza za Ratcha Ratchada da Rama Rama 3” Opened “Cen CentralPla lPlaza za Rama 2 Rama 2” 2008 2008 Opened “CentralP alPlaza Chaeng aengwatta ttana na”
field Devel Develo
Opened “Hilt ilton P Pattaya Beach each Hotel” l”
Ce Centr ntralPlaza lPlaza Rama Rama 9
1993 1993 Opened “Cen CentralPla lPlaza za Ramindra Ramindra”
Green een-
2012 (NEW 2012 (NEW)
Open “Centr
CentralP lPlaz laza Suratt Suratthani hani” 2013 (NEW 2013 (NEW)
Open “Centr
CentralFest lFestival val Chiangm hiangmai ai”
1996 1996 Acquired full equity stake in “Cen CentralPla lPlaza za Ch Chian iangma mai A i Airp rpor
2000 2000 2002 2002
pment ent
2012 2012 (Enhanc (Enhancement)
Complete “CentralPlaza
tralPlaza Udon Udonth than ani Phase Phase 2”
2000 2000 Completed “CentralP alPlaza Ch Chian iangma mai A i Airp rport
ase 2A” 2001 2001 Acquired full equity stake in 2002 2002 Acquired “Cen CentralWor lWorld ld” (Formerly World Trade Center) 2004 2004 Completed 2006 2006 Completed “Centra CentralW lWorld”
n & & Redevel Redevelo
2009 2009 Acquired “Cen Centra ralPlaza laza Ud Udon Th
ani” (formerly Charoensri Complex)
Udon Udonth than ani Phase Phase 2
q q y “Centr CentralPlaza Ba Bangna ngna” 2003 2003 Acquired “Cen Centra ralPlaza laza Rat Rattana nathibet thibet” (Formerly Siam Jusco Rattanathibet) AND completed “Cen CentralPla lPlaza za Ch Chian iangma mai A i Airp rpor
t Phase 2B ase 2B” Completed “The Offices The Offices at Centra at CentralW lWorld
Acquisitio Acquisition CPN current portf CPN current portfolio lio: 15 Shopping 15 Shopping Centers Centers 6 Office 6 Office Towers Towers 5 Projects 5 Projects Under Under Develo Development ent
6
7 Source : Company estimate as of 31 March 2011.
(1) brings to CPN a wealth of financial
Central Holding 27% Other 36%
The Central Group 59%
Chirathivat Family 32% Lombard's Thailand Equity Fund 32% Equity Fund 5%
As of 31 March 2011 8
Note1: Lombard’s Thailand Equity Fund is a US$245 million private equity fund sponsored by Lombard Investments, Inc., headquartered in San Francisco, and the International Finance Corporation ("IFC"), part of the World Bank Group. The fund was formed with the support of the Government of the Kingdom of Thailand in order to make private equity investments in operationally competitive Thai businesses and is managed by MFC Asset Management. Investors in the fund include the IFC, California Public Employees'Retirement System ("CalPERS"), Asian Development Bank, DEG (a member of Germany's KfW Group), the Ministry of Finance of the Government of Thailand, and ten leading Thai banks and
As of 31 March 2011
100% 59% 67% 100%
Owner of Centara hotel Owner and developer of Owner of retail chains Owner of international retail Owner of Centara hotel, resorts, and convention centers, and also franchisees of fast-food retail chains including KFC, Mister Donut, Auntie's Anne Pepper Owner and developer of Shopping Centers and Mix- Used Complex Owner of retail chains including Central Department Stores, Robinson Department Stores, ZEN Department Store, Power Buy, Super Sports B2S Home-works Owner of international retail franchisees for;
Elizabeth Aden, Payot...
S'fare, John Henry, Daniel Hechter Auntie s Anne, Pepper Lunch, Beard papa’, Cold Stone Sports, B2S, Home works, Tops Supermarket, Office Depot, etc. Daniel Hechter, Hush Puppies, Jockey, Wrangler, Lee, FCUK, Energy, Miss Sixty...
Guess watch, Casio....
9
Group of companies. CPN ill thi i t t d b i l tf t d f th th h t Th il d i t i i k t h i
Bangkok while increasing market share in the Provincial area. CPN will also utilize this optimal business platform in its expansion into neighboring countries.
Largest property fund in Thailand Leading retail developer property Largest and most popular retail Largest property fund in Thailand Provide optimal funding source:
expansion Leading retail developer, property manager and investor in Thailand with market share of 22% of Bangkok’s mall saleable area Integrated development, leasing and property management teams have Largest and most popular retail chains in Thailand
successful brands and store concepts I l t ffi p
dilution Create fee base income Improve CPN’s financial position: property management teams have ensured continuous success for
Most successful and most experienced retail company in Thailand
projects with higher return
Branded malls to ensure innovative designs and functionality to suit customer needs CPN shopping centers
rental rates than others
10
Central’s Group Synergy
Business alliances and joint developers, building confidence among prospects and attracting shoppers
y gy Experienced & Hands-on Management High Revenue Generating Capability at Sustainable
30-yeared experience in retail property development & management Recurring income from monthly rent with proven sustainable rental growth Site selection, merchandizing mix and
Growth Rate Focus on Retail Property Prudent Financial
merchandizing mix, and retail business know-how’s
Development in Prime Locations with Solid Operating Performance Dynamically Management and Financial Flexibility
High quality shopping centers: high occupancy & traffic flow and sustainable rental growth Enhanced funding capability through REIT vehicle. Business growing at a low gearing
Dynamically Innovative & Diversification
Step-up rental structure. Well diversified portfolio in 15 high traffic growth areas
11
Shopping Centers: 16
World Format 1 (BMA) Plaza Format 13 (8 - BMA)
Plaza Format 13 (8 BMA) (5 - Province) Center Format 1 (Province) Festival Format 1 (Province)
Offices: 4 (BMA)
Fut Future Proj re Projects Existin isting P Projects ts
Hotel: 2 (Province)
Bangkok Metropolitan Area (BMA)
Shopping Centers:
BMA
Provinces
13
CPN manages sixteen (16) premium shopping centers – Nine (9) in Bangkok Metropolitan Area (BMA) and its vicinities and seven (7) in provincial areas. In 1Q11, occupancy of the BMA shopping centers stood at 93%. Retail Properties in BMA CPN Retail
Develop- Land Leaseable area (1) No.of Tenants Occupancy Rate (2)
Properties
ment Ownership (sqm) 1Q11(1) 1Q11 4Q10 1Q10
Greenfield Leasehold n/a n/a n/a 97% 94%
Greenfield Leasehold 17,160 79 100% 100% 99% Closure for major renovation from Feb - Aug 2011.
Greenfield Leasehold 35,705 144 99% 99% 100%
Greenfield Freehold 19,784 69 100% 100% 99%
Acquisition Freehold 54,509 284 99% 99% 99%
Greenfield Leasehold 5,937 34 100% 100% 100%
Acquisition Freehold 77,026 210 97% 99% 98%
Acquisition Leasehold 187,046 (4) 481 86% 86% 95% Under major renovation. Full opening is expected in 4Q11. 9.Chaengwattana Greenfield Freehold 65,550 391 95% 96% 90%
CPN Portfolio in BMA 462,717
(4)
1,692 93% 94% 96%
14 Note 1: Excludes rental agreements < 1 year, such as kiosk, carts, ATMs and coin machines. Note 2: Percentage based on leaseable area. Note 3: Excludes areas transferred to CPNRF. Note 4: Includes Zen Department Store and under-renovating areas at CentralWorld.
Seven (7) shopping centers are strategically located in high traffic growth areas in provinces. Occupancy rate in 1Q11 averaged 95%. Retail Properties in Provincial Areas CPN Retail
Develop- Land Leaseable area (1) No.of Tenants Occupancy Rate (2)
Properties
ment Ownership (sqm) 1Q11 (1) 1Q11 4Q10 1Q10
Greenfield Leasehold 15,226 130 97% 97% 97%
Acquisition Freehold 75,918 527 100% 100% 99%
Greenfield Freehold 56,805 299 93% 95% 90%
Acquisition Freehold 49,278 181 97% 98% 98%
Greenfield Freehold 39,912 294 96% 95% 90%
Greenfield Freehold 50,127 344 86% 87% 91%
Greenfield Freehold 23,000 (3) 280 (3) 90%(3) n.a. n.a.
CPN Portfolio in Provinces 310,266 2,055 95% 96% 94%
Opened in Mar 11.
Total CPN Portfolio for Retail Properties 772,983 (4) 3,747 94% 94% 95%
15 Note 1: Excludes rental agreements < 1 year, such as kiosk, carts, ATMs and coin machines. Note 2: Percentage based on leaseable area. Note 3: Approximate figures. Note 4: Includes Zen Department Store and under-renovating areas at CentralWorld.
Office property is considered as non-core business, complementing shopping center business and adding value to the
Develop- Land Leaseable area (1) No.of Tenants Occupancy Rate (2)
ment Ownership (sqm) 1Q11 (1) 1Q11 4Q10 1Q10
Greenfield Leasehold 16,551 30 55% 16% 71%
Acquisition Freehold 10,007 30 98% 99% 95% Completed its major renovation in 1Q11.
Acquisition Leasehold 82,796 91 91% 93% 95%
Greenfield Freehold 19,708 38 57% 56% 29%
Total 129,062 189 82% 77% 82%
Opened in Mar 09.
16 Note 1: Excludes storage. Note 2: Percentage based on leaseable area.
Residential property and hotel are non-core businesses. These businesses complement that of the shopping center and add value to the project.
Leaseable area (1) (sqm) Occupancy Rate (2) 1Q11 4Q10 1Q10
Residential
(sqm) 1Q11 4Q10 1Q10
1,907 42% 55% 56%
4,466 70% 72% 73%
T t l
50-unit furnished apartment. Strata title. Asset for sales.
Total 6,373 62% 67% 68%
Occupancy Rate % ARR (Bt/night) Rev Par (Bt/night)
Hotel
Available Room 1Q11 4Q10 1Q10 1Q11 4Q10 1Q10 1Q11 4Q10 1Q10
Centara Udonthani 255 84% 63% 68% 1,125 1,105 1,151 945 696 783 Managed by Central Plaza Hotel Plc. Hilton Pattaya 302 62% 40% n/a 3,789 3,477 n/a 2,349 1,391 n/a
Total 557 72% 51% 68% 2,596 2,391 1,151 1,706 1,073 783
Managed by Hilton Hotel Corporation
17 Note 1: Includes retail space. Excludes storage. Note 2: Percentage based on leaseable area.
In 1Q11, CPN Retail Growth Leasehold Property Fund (“CPNRF”) owns three shopping centers and two office towers. CPNRF is managed by SCB Asset Management, Fund Manager. Its properties are managed by CPN, Property Manager. CPNRF Retail Properties
Develop- ment Land Ownership Leaseable area (1) (sqm) No.of Tenants 1Q11 (1) Occupancy Rate (2) 1Q11 4Q10 1Q10
Greenfield Leasehold 93,474 324 99% 99% 100%
Greenfield Freehold 40,076 234 95% 96% 96%
Greenfield Leasehold 23,855 113 95% 95% 98% Acquired in Nov 09. ,
CPNRF Retail Properties 157,405 671 98% 98% 98%
CPNRF Office
Develop Land Leaseable No.of Occupancy Rate (2)
q
CPNRF Office Properties
Develop- ment Land Ownership area (1) (sqm) Tenants 1Q11 (1) 1Q11 4Q10 4Q09
Pinklao Tower A & B Greenfield Leasehold 33,761 93 94% 97% 95% Acquired in Nov 09.
CPNRF Office Properties 33,761 93 94% 97% 95% CPNRF Portfolio 191,166 764 97% 97% 97%
18 Note 1: Includes rental agreements < 1 year such as kiosk, carts, ATMs and coin machines and CPN acts as the property manager. Note 2: Percentage based on leaseable area.
(1) 1,184 1,200
Same Store Rental Growth +4 8% YoY
Effective Rental Rate of matured malls
Declined effective rental rate from lower rental rates of newly opened malls in provinces
1,104 1,100 per sqm per month 1,220 1,274 1,254 1,225 1,250 1,300
Growth +4.8% YoY rates of newly opened malls in provinces
1,000 1Q10 1Q11 Bt p 1,164 1,220 1,103 1,156 1,100 1,150 1,200 er month Excludes CentralWorld, CentralPlaza Lardprao, and new projects (2) 945 1,040 950 1,000 1,050 Bt per sqm pe Effective Rental Rate of new malls 1,200
945 850 900 950 1,102 1,120 1 000 1,100 Bt per sqm per mo 800 2004 2005 2006 2007 2008 2009 2010 1Q10 1Q11 Excludes CentralWorld and CentralPlaza Lardprao All projects The five new malls (opened during 2008 – 2009) (2) 1,000 1Q10 1Q11 19 Note 1 : The figures are effective rental rates for retail tenants (occupied space < 1,000 sqm) and net of special rental discounts. Note 2 : Newly opened projects - CentralPlaza Chaengwattana, CentralFestival Pattaya Beach, CentralPlaza Udonthani, CentralPlaza Chonburi, and CentralPlaza Khonkaen. Source: Company estimate as of 31 March 2011.
Fixed Rent Long-term Lease
(up to 20 years) Up-front collection (up to 3 years) Monthly basis collection
approx 5% p.a.
expired every year
throughout lease contract period on straight-line basis
% of Sales % of Sales
(up to 3 years) Monthly basis collection Tenants: food centers, cineplex and international brands such as “McDonalds”, “KFC”
Note: On top of space rental fee, service & utility fees are collected on a monthly basis
20 Note1: Percentage based on occupied area. Excludes leaseable area of CentralPlaza Lardprao. Source: Company estimate as of 31 March 2011.
Cent CentralFes estival Chi Chiangmai Cent CentralFes estival Chi Chiangmai
NLA: NLA: 46,500 46,500 sqm sqm Openi Opening in g in 2013 2013
CentralPlaza ralPlaza Phitsanulok nulok
NLA: NLA: 23,200 23,200 sqm sqm
CentralPlaza ralPlaza Rama Rama IX IX
Openi Opening in g in Oct Oct 2011 2011
CentralPlaza ralPlaza Rama Rama IX IX
NLA: NLA: 89,600 89,600 sqm sqm Openi Opening in g in Dec Dec 2011 2011
CentralPlaza ralPlaza Suratthani tthani
NLA: NLA: 31,600 31,600 sqm sqm Op Opening in June June 2012 2012
Op Opening in in June June 2012 2012
22
Project Highlights
Investment Cost (1) 1,400 MB Program Shopping Center (N.L.A.)
23,200 sqm (2)
Parking (G.A)
1,000 cars
Joint- Developer
Robinson Department Store (3)
Location Construction Progress
104 rais, Phitsanulok Province Central of Thailand 23% of construction
Opening (tentative) October 2011
23 Note1: Includes land and construction cost of shopping center and parking building. Excludes those of Robinson Department Store. Note2: Excludes CRC’s area (Robinson Department Store). Note3: Area will be developed and owned by the joint developer. However the store will be magnet to draw traffic into CPN’s plaza area.
Project Highlights
Investment Cost (1) 5,100 MB , Program Shopping Center (N.L.A.)
89,600 sqm (2)
Office Building
16,400 sqm
Parking (G.A)
2,500 cars
Location
5 km from Bangkok CBD Area
Construction Progress
34% of construction
O i (t t ti ) D b 2011 Opening (tentative) December 2011
24 Note1: Includes land and construction cost of shopping center and parking building. Note2: Includes Robinson Department Store - an anchor tenant.
Project Highlights
Investment Cost (1) 2,000 MB Program Shopping Center (N.L.A.)
31,600 sqm (2)
Parking (G.A)
1,400 cars
Location
52 rais, Suratthani Province South of Thailand
Opening (tentative) June 2012
25 Note1: Includes land and construction cost of shopping center and parking building. Excludes those of department store. Note2: Excludes department store area under CRC. Note3: Area will be developed and owned by the joint developer. However the store will be magnet to draw traffic into CPN’s plaza area.
Project Highlights
Investment Cost (1) 3,300 MB Program Shopping Center (N.L.A.)
46,500 sqm (2)
Parking (G.A)
1,600 cars
Joint- Developer
Central Department Store (3)
Location
70 rais, Chiangmai Province North of Thailand
Opening (tentative) 2013 p g ( )
26 Note1: Includes land and construction cost of shopping center and parking building. Excludes those of Central Department Store. Note2: Excludes CRC’s area (Central Department Store). Note3: Area will be developed and owned by the joint developer. However the store will be magnet to draw traffic into CPN’s plaza area.
g y complex by SFX.
28
Office Tower Investment Cost 400 MB Shopping Center Investment Cost 1,700 MB Renovation Period May - Dec 2010 Completion Completed in Dec 2010 Renovation Period Feb – Aug 2011 Completion 3Q 2011 (tentative) Pre-renovation Post-renovation
29
Investment Cost (1) 2,400 MB Program Shopping Center New retail space (NLA) of 17,700 sqm p ( ) q New anchors, including TOPS, PowerBuy, and SuperSport New parking building (5 floors with over 700 vehicles) Hotel Face lift with new interior design L ti N th t f Th il d Location Northeast of Thailand Construction Period 2Q11 – 1Q12 Impact
Post-renovation
30 As of 31 March 2011 . Note 1: Includes those of shopping center and hotel.
Investment Cost (1) 1,000 MB Program Shopping Center New retail space (NLA) of 10,500 sqm p ( ) q New parking building (3 floors with over 385 vehicles) Improved façade and skylight Re-merchandizing mix Location Bangkok Location Bangkok Construction Period 2Q11 – 4Q12 Impact
leading brands .
Post-renovation
31 As of 31 March 2011 .
95% 94% 95% 95% 93% 92% 96% 97% 96% 95% 96% 96% 96% 90% 100% 1 000 000 1,200,000 1,400,000
Chiangmai Festival Udonthani - Phase II
qm) Av 70% 80% 400 000 600,000 800,000 1,000,000
Surathani Rama 9 Pitsanulok
ail Leasable Area (sq verage Occupancy r 50% 60% 200,000 400,000 2001 2002 2003 2004 2005 2006 2007 2008 2009 2010 2011F 2012F 2013F
Chiangrai Existing retail area Occupancy rate (%)
Reta rate (%)
(1)
Leaseable area (Sq.m.) 2001 2002 2003 2004 2005 2006 2007 2008 2009 2010 2011F 2012F 2013F Shopping Center 281,623 518,894 598,587 591,007 617,299 684,587 697,038 761,111 967,430 964,612 1,100,412 1,157,012 1,203,512 Office Building 49,833 49,833 49,833 134,099 134,038 145,700 144,791 144,791 164,253 164,253 164,253 164,253 164,253 Residential 16,825 16,825 16,336 16,336 6,373 6,373 6,373 6,373 6,373 6,373 6,373 6,373 6,373 Total 348,281 585,552 664,756 741,442 757,710 836,660 848,202 912,275 1,176,056 1,173,238 1,309,038 1,365,638 1,412,139
32 Source: Company estimate as at 31 March 2011. Note1: Includes leaseable area of CentralPlaza Rama 2, CentralPlaza Rama 3, and CentralPlaza Pinklao which were partially transferred to CPNRF, but still under CPN’s management.
Major capital expenditure will be used to develop 16 new projects. Financing plan for future expansion includes: cash flow from operation, bond issuance and/or project finance, and property fund vehicle.
Developing Projects 2010 2011 2012 2013 2014
(Unit: MB)
CentralPlaza Chaengwattana 110 160
1,170 580
180 110
460 450
710 710 280
160 770 340
780 1,400 1,260
450 580 470 300
1,000 900 300 Enhancement Projects CentralWorld 820 1,980
510 1,030 500
200
50 540 1,000 620
500
500 500 500 1,000 1,000 Potential Projects New Projects (1) 300 2,110 4,690 7,750 9,220 Total 6,400 11,920 10,540 10,570 10,520
33 Source: Company estimate as of 31 March 2011. Note 1: Tentative development projects.
15,687 16,000 18,000 Bt mil 11,754 11,647 11,388 10,000 12,000 14,000 3,128 3,176 3,119 6,944 3,112 2 074 2,442 4,952 2 292 4,000 6,000 8,000 2,074 924 743 768 2,292 1,125 1,552 667 550 612 2,000 FY09 FY09 FY10 FY10 1Q10 4Q10 1Q11
(2)
Adjusted Adjusted Adjusted
(2),(3) (3)
Restated
(2),(3)
Total revenue Operating profit Net profit Growth (% Y-o-Y) (2),(3) 2007 2008 2009 Adj 2010 Adj 1Q11 Q-o-Q 1Q11 Y-o-Y Total revenue (1) 14% 12% 26% (3%) (2%) (0%) O ti fit (7%) 24% 3% (21%) 3% (17%) Operating profit (7%) 24% 3% (21%) 3% (17%) Net profit (7%) 38% 5% (32%) 11% (8%) Revenue same store growth (2) 14% 11% 5% 0% 3% 5% 35 Note1: Total Revenue includes rental & service, hotel operation, food & beverage, and other incomes. Excludes interest income and share of profit from investment. Note2: Excludes non-recurring items. Note3: Restated due to changes in accounting policy.
Bt mil
Revenue decreased by 4% y-o-y. This was mainly due to
2 500 3,000 3,500 3,176 3,128
This was mainly due to The closure of CentralPlaza Larprao for 6-month renovation. The lower revenues from CentralWorld during renovation. Retail
3,118 3,118 1,500 2,000 2,500
Office Revenue decreased by 2% y-o-y. This was mainly due to temporary low occupancy rate
renovation.
500 1,000
Hotel Revenue increased by 254% y-o-y. This was mainly due to the opening of Hilton Pattaya Hotel (Opened in December 2010).
1Q10 1Q11 4Q10 1Q11
F&B Revenue increased by 5% y-o-y. This was mainly due to improved consumer spending d hi h t d f th F d P k t
1Q10 1Q11 % YOY 4Q10 1Q11 % QoQ 2,539 2,431 (4%) 2,496 2,431 (3%) Retail
and higher revenues generated from the Food Park at CentralFestival Pattaya Beach.
189 186 (2%) 173 186 8% 37 131 254% 53 131 149% 135 142 5% 139 142 2% 7 5 (23%) 5 5 12% 221 223 1% 310 223 (28%)
(1) (2)
Other income Other rental F&B Office Hotel 36 Note1: Includes revenues from residential projects and water & amusement park. Note2: Includes property management fees from CPNRF. Note3: Excludes non-recurring income. 221 223 1% 310 223 (28%) Other income
Cost increased by 3% y-o-y. This was mainly due to the additional depreciation of
Bt mil 1,779 1,747 1,837
This was mainly due to the additional depreciation of the renovated works at CentralWorld. Cost decreased by 2% y-o-y. Retail
1,837 1,500 2,000
Office The decrease was due to lower utilities from the low
C i d b 282%
1,000
Hotel Cost increased by 282% y-o-y. The increase was mainly from the opening of Hilton Pattaya Hotel.
500 Retail 1Q10 1Q11 % YOY 4Q10 1Q11 % QoQ 1,485 1,532 3% 1,502 1,532 2%
F&B Cost increased by 7% y-o-y. The increase was in line with the increase in F&B Sales.
1Q10 1Q11 4Q10 1Q11 Others F&B Office , , , , 126 124 (2%) 127 124 (2%) 14 52 282% 24 52 116% 116 123 7% 121 123 2% 7 5 (26%) 5 5 (6%) Hotel 37 Note1: Excludes non-recurring items.
Bt mil
Personnel expenses increased by 9% y-o-y. Thi i l d t th i f Hilt P tt
750 676 521 521
People This was mainly due to the opening of Hilton Pattaya Hotel and an increase in number of employees to support business expansion.
500 463
Ads & Promo Marketing expenses decreased by 22% y-o-y. It was primarily a result of lower advertising & promotion expenses of new projects upon improving visitor traffic flow and shopper spending.
250 1Q10 1Q11 4Q10 1Q11 1Q10 1Q11 % YOY 4Q10 1Q11 % QoQ 225 245 9% 193 245 28% People 119 93 (22%) 223 93 (59%) 34 73 115% 42 73 74% 85 110 30% 218 110 (50%) Others Depreciation Ads&Promo p 38 Note1: Excludes non-recurring items.
Lower profitability in FY2010, reflecting the closure of Improved profitability after CentralWorld has resumed its ti i 4Q10
CentralWorld in 2Q10 – 3Q10
Key ratios (1) 2005 Adj 2006 2007 2008 2009 Adj 2010 Adj 1Q10 4Q10 1Q11 Gross profit margin (%) 49% 48% 46% 47% 43% 39% 44% 44% 41% Gross profit margin (%) 49% 48% 46% 47% 43% 39% 44% 44% 41% Operating profit margin (%) 27% 26% 22% 26% 20% 15% 24% 18% 19% Net profit margin (%) 21% 22% 18% 22% 18% 13% 21% 17% 19% ROA (%) 5% 5% 4% 5% 5% 3% 5% 4% 5% ROE (%) 15% 15% 13% 16% 14% 8% 14% 12% 13%
Declined profitability from closure
month renovation since Feb 2011.
Gross Profit Margin (%) (1) 2005 Adj (1) 2006 2007 2008 2009 Adj 2010 Adj 1Q10 4Q10 1Q11 Retail 51% 48% 45% 42% 40% 36% 42% 40% 37% Office 6% 25% 30% 37% 37% 23% 33% 27% 33% Hotel n/a n/a n/a n/a 61% 57% 63% 54% 60% F&B 23% 23% 24% 18% 17% 14% 14% 13% 13%
39 Note1: Excludes non-recurring items.
745 688 800 Bt mil
Interest Expense
Outstanding Borrowings Bt 19,849 mil (1) Financing Cost
621 581 543 688 400 500 600 700
ST-Loan 10% ST-Bond 8% LT-Bond 49%
168 170 178 100 200 300 2006 2007 2008 2009 2010 1Q10 4Q10 1Q11
LT-Loan 33%
30 000 Bt mil Fixed Floating
Fixed vs. Floating Mix of Existing Borrowings (2)
Weighted Avg. Interest Rate 5.6% 5.5% 5.2% 4.7% 4.4% 4.4% 4.3% 4.3%
(3)
5 000 10,000 15,000 20,000 25,000 30,000 38% 12,045 65% 35% 16,445 16,670 68% 32% 19,085 61% 39% 24,475 88% 12% 16,189 97% 3% 9,905 % 5,000 2007 2008 2009 2010 2011 2012 2013 Fixed Rate 5.1% 4.8% 4.7% 4.4% 4.3% 4.5% 4.4% Floating rate MLR-1.39% MLR-1.65% MLR-1.78% MLR-2.58% MLR-2.57% MLR-2.02% n/a F 62% 65% 68% 61% 100% F F 40 Note 1 : No loans from related parties as of 31 March 2011. Note 2: At year-end. Note 3: Weighted average interest rate was derived from interest expenses including interest capitalization for projects under development.
16 445 16,669 19,085 19,849 19,008 18,918 19,527
1.20
20,000 Bt mil Net D/E (Times)
11,112 12,045 16,445 , 12,574 13,639 15,173 0.59 0.59 0.84 0.74 0.92 0.97
0.60 0.80 1.00
8,000 12,000 16,000
3,691 3,983 3,677 2,541 1,632 873
0.00 0.20 0.40
4,000 , 2006 2007 2008 2009 2010 1Q 2011 Q
Cash and Current Investment Interest Bearing Debt Equity Net Interest Bearing Debt to Equity
Key ratios 2005 2006 2007 2008 2009 2010 1Q10 4Q10 1Q11 Net interest bearing debt to equity (times) (1) 0.5 0.6 0.6 0.8 0.7 0.9 0.7 0.9 1.0 Total debt to equity (times) 1.8 1.7 1.7 1.9 1.7 1.8 1.6 1.8 1.8 Net interest bearing debt to EBITDA (times) (1) 1.4 2.0 2.0 2.9 2.7 3.7 2.5 3.7 4.1 Interest coverage (times) (2) 6.0 6.0 7.2 7.2 8.9 6.9 6.2 10.1 6.5 41 Note1: Interest bearing debt excludes loans from related parties. Note2: Excludes avals of land payment.
Share Price Movement
1Q11 2010 2009 2008 2007
25,000 40
Volume ('000 shares) Share Price (Bt/share)
CPN Share price and Volume Close
CPN Property Index SET Index 2% 10% 9% 32% 25% 41% 42% 94% 63% (43%) (53%) (48%) 11% 13% 26%
5,000 10,000 15,000 20,000 5 10 15 20 25 30 35 Close Volume Jan‐03 Jun‐03 Oct‐03 Mar‐04 Aug‐04 Jan‐05 Jun‐05 Nov‐05 Apr‐06 Sep‐06 Feb‐07 Jul‐07 Nov‐07 Apr‐08 Sep‐08 Feb‐09 Jul‐09 Dec‐09 May‐10 Oct‐10
Share Overview Dividend Summary
Par Value (Bt) Stock Price (Bt) 1.00 27.25 Par Value (Bt) 2010 1 00 2009 1 00 2008 1 00 2007 1 00 2006 1 00 Consensus FY11 core EPS (Bt/share) P/E /1 (Times) P/BV /1 (Times) Market Capitalization (Bt mil) 1.10 24.78 3.05 59,373 Par Value (Bt) Dividend (Bt/share) Dividend Paid (Bt mil) Dividend Payout Ratio 1.00 0.25 545 48% 1.00 0.58 1,264 25%* 1.00 0.33 719 33% 1.00 0.33 719 40% 1.00 0.31 675 40% Share Capital (Shares) 2,178,816,000
Notes: Dividend policy is paid annually not less than 40% of net profit (unless there is a compelling reason against this). : Dividend payout ratio of 26% in 2005 was derived from 40% of normal net profit and 18% of gain from transferring assets into CPNRF. : Dividend payout ratio of 25% in 2009 was derived from 40% of normal net profit and 14% of gain from transferring assets into CPNRF. 42 Source: Factset as of 31 March 2011 Note 1: Based on analyst’s consensus FY11 core EPS
150 1,200
Loan (Issued Date) Bt mil Terms
Promissory Note Term Loan (Dec’10) 1 week – 3 months, 2.60 % 4 years, 2.55% 500 3,000 1,500 2,000 Term Loan (Mar’11) Unsecured Bond (Jun’07) Unsecured Bond (Sep’08) Unsecured Bond (May’09) 4 years, 3.84% 5 years, 4.25% 3 years, 4.80% 4 years, 4.50% 1,000 1,200 1,000 500 500 Unsecured Bond (May’09) Unsecured Bond (Jun’09) Unsecured Bond (Jul’09) Unsecured Bond (Jun’10) 5 years, 4.75% 4 years, 4.50% 3 years, 4.00% 2 years, 3-month fixed deposit rate + 1.15% 5 3 95% 500 500 552 130 1 850 Unsecured Bond (Jun’10) Unsecured Bond (Mar’11) Property Fund Bangna (Mar’03) Property Fund Bangna (Mar’03) Project Finance Chaengwattana (Oct’08) 5 years, 3.95% 4 years, 3.96% 15 years, minimum loan rate - 1.25% (amortising) 15 years, 6.00% (amortising) 7 years minimum loan rate - 2 00% (amortising) 1,850 967 1,000 1,350 950 Project Finance – Chaengwattana (Oct’08) Project Finance – Pattaya Beach (Feb’09) Project Finance – Pattaya Hotel (Feb’09) Project Finance – Khon Kean (Apr’09) Project Finance – Chonburi (Dec’09) 7 years, minimum loan rate - 2.00% (amortising) 7 years, minimum loan rate - 2.00% (amortising) 7 years, 4.25% (amortising) 7 years, minimum loan rate - 2.00% (amortising) 7 years, minimum loan rate - 1.75% (amortising) 950 19,849 (87) 18,976 Project Finance – Chonburi (Dec 09) Total (Long Term Borrowings & Current Portion) Less Cash and Current Investments Net 7 years, minimum loan rate 1.75% (amortising)
44 Source: Company data as of 31 March 2011.
Bt million 1Q10 4Q10 1Q11 Cash & cash equivalent 1,581 772 761 Current investment 1,504 861 112 Other current assets 1 524 2 133 2 224 Other current assets 1,524 2,133 2,224 Investment in associate 2,661 2,684 2,691 Investment properties n/a 30,011 31,858 Property & equipment, net n/a 2,298 2,363 Leasehold rights n/a 13,549 13,340 Other non current assets 1 615 1 529 1 585 Other non-current assets 1,615 1,529 1,585 Total assets 51,540 53,836 54,934 Current portion of long-term debt 2,093 2,990 3,406 Short-term loan 1,100 150 Other current liabilities 4,361 6,063 5,805 Long-term debt 14,549 14,995 16,293 Unearned rental / service income 4,817 4,235 4,188 Deposits received from customers 3,101 3,340 3,432 Other non-current liabilities 2,657 2,194 2,133 Total liabilities 31,578 34,918 35,407 Issued and Paid-up Share Capital 2,179 2,179 2,179 Retained Earnings 15,491 14,339 14,952 Total equities 19,962 18,918 19,527
45
Bt million 1Q10 4Q10 1Q11 Rental & service, hotel, F & B incomes 2,907 2,866 2,896 Retail 2,539 2,496 2,431 Office 189 173 186 Hotel 37 53 131 Food & beverage 135 139 142 Other rental incomes 7 5 5 Cost of rental & service, hotel, and F & B 1,747 1,779 1,837 Retail 1,485 1,502 1,532 , , , Office 126 127 124 Hotel 14 24 52 Food & beverage 116 121 123 Other rental incomes 7 5 5 Gross profit 1,160 1,087 1,059 p , , , Other income 383 407 223 Interest income 184 22 7 Administrative expenses 463 705 521 Losses from write-off of asset 775 Operating profit 1,264 35 768 p g p , Share of profit (loss) from investments 118 129 123 Interest expense 168 170 178 Income tax expense 263 149 104 Net loss (gain) of minority interest (3) (3) 4 Net profit 948 (158) 612 p ( ) Net profit excluding non-recurring items 667 550 612 EPS (Bt) 0.44 (0.07) 0.28 EPS (Bt) excluding non-recurring items 0.31 0.25 0.28
46
D l d &
Hotel
Developed &
Hotel (CENTEL) Owned by CPN – not damaged Owned by CPN
Owned by CPN – partially damaged & Now open
Owned by CPN & leased out to ZEN Department Store – under re-construction 48 Source: Company preliminary investigation. Note 1: Insurers and relevant independent experts are investigating and assessing the actual damage.