Cenovus delivers strong second quarter perform ance Planned - - PDF document

cenovus delivers strong second quarter perform ance
SMART_READER_LITE
LIVE PREVIEW

Cenovus delivers strong second quarter perform ance Planned - - PDF document

Cenovus delivers strong second quarter perform ance Planned divestitures and Deep Basin asset integration on track Calgary, Alberta ( July 2 7 , 2 0 1 7 ) Cenovus Energy Inc. (TSX: CVE) (NYSE: CVE) had a strong second quarter that reflected


slide-1
SLIDE 1

Cenovus delivers strong second quarter perform ance

Planned divestitures and Deep Basin asset integration on track

Calgary, Alberta ( July 2 7 , 2 0 1 7 ) – Cenovus Energy Inc. (TSX: CVE) (NYSE: CVE) had a strong second quarter that reflected 45 days of results from the assets recently acquired from ConocoPhillips. The acquisition gives Cenovus 100% ownership of its oil sands operations and a new production platform in the liquids-rich Deep Basin. Integration of the Deep Basin assets is on track. To further optimize its portfolio and deleverage its balance sheet, the company is pursuing the sale of its legacy conventional oil and natural gas assets, and the sale processes are proceeding well. Cenovus continues to target between $4 billion and $5 billion in announced asset sale agreements during 2017. Key highlights  Increased second quarter adjusted funds flow by 80% to $792 million or $0.71 per share compared with the same period in 2016  Increased free funds flow by 128% from the second quarter of 2016 to $465 million  Reduced planned 2017 capital spending by approximately $200 million to $1.7 billion at the midpoint, with no expected impact to forecast production volumes

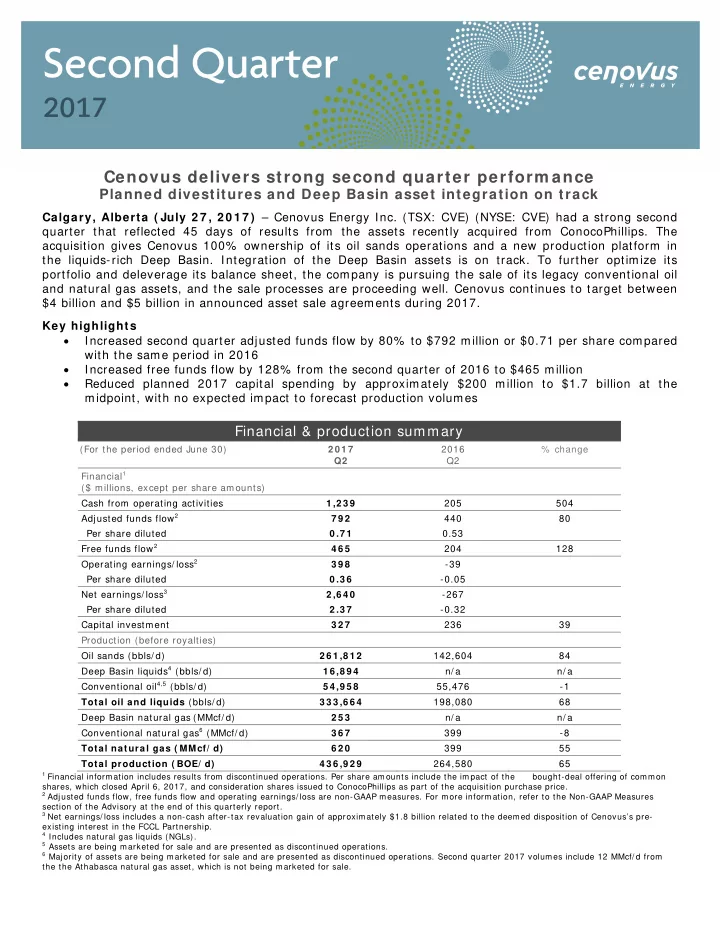
Financial & production summary

(For the period ended June 30) 2 0 1 7 Q2 2016 Q2 % change Financial1 ($ millions, except per share amounts) Cash from operating activities 1 ,2 3 9 205 504 Adjusted funds flow2 7 9 2 440 80 Per share diluted 0 .7 1 0.53 Free funds flow 2 4 6 5 204 128 Operating earnings/ loss2 3 9 8

  • 39

Per share diluted 0 .3 6

  • 0.05

Net earnings/ loss3 2 ,6 4 0

  • 267

Per share diluted 2 .3 7

  • 0.32

Capital investment 3 2 7 236 39 Production (before royalties) Oil sands (bbls/ d) 2 6 1 ,8 1 2 142,604 84 Deep Basin liquids4 (bbls/ d) 1 6 ,8 9 4 n/ a n/ a Conventional oil4,5 (bbls/ d) 5 4 ,9 5 8 55,476

  • 1

Total oil and liquids (bbls/ d) 3 3 3 ,6 6 4 198,080 68 Deep Basin natural gas (MMcf/ d) 2 5 3 n/ a n/ a Conventional natural gas6 (MMcf/ d) 3 6 7 399

  • 8

Total natural gas ( MMcf/ d) 6 2 0 399 55 Total production ( BOE/ d) 4 3 6 ,9 2 9 264,580 65

1 Financial information includes results from discontinued operations. Per share amounts include the impact of the bought-deal offering of common

shares, which closed April 6, 2017, and consideration shares issued to ConocoPhillips as part of the acquisition purchase price.

2 Adjusted funds flow, free funds flow and operating earnings/ loss are non-GAAP measures. For more information, refer to the Non-GAAP Measures

section of the Advisory at the end of this quarterly report.

3 Net earnings/ loss includes a non-cash after-tax revaluation gain of approximately $1.8 billion related to the deemed disposition of Cenovus’s pre-

existing interest in the FCCL Partnership.

4 Includes natural gas liquids (NGLs). 5 Assets are being marketed for sale and are presented as discontinued operations. 6 Majority of assets are being marketed for sale and are presented as discontinued operations. Second quarter 2017 volumes include 12 MMcf/ d from

the the Athabasca natural gas asset, which is not being marketed for sale.

slide-2
SLIDE 2

Overview

In the second quarter of 2017, Cenovus began to see the benefits of its acquisition of western Canadian assets from ConocoPhillips. The acquisition closed on May 17 and included taking full ownership of Cenovus’s best-in-class oil sands assets in northern Alberta and adding a new production platform in the Deep Basin. With 45 days of contribution from the acquired assets, the company increased adjusted funds flow by 80%, free funds flow by 128% and total production by 65% compared with the second quarter of 2016. “These results demonstrate that we’re solidly on track with our updated strategy to focus on increasing funds flows through disciplined capital allocation to our two production platforms,” said Brian Ferguson, Cenovus President & Chief Executive Officer. “With our increased size and scale and continued commitment to deleverage our balance sheet – our number one near-term priority – I believe the new Cenovus is well positioned to deliver significant value to shareholders in the years ahead.” Planned asset divestitures As part of its updated strategy, the company is focused on its production platforms in the oil sands and the Deep Basin. To further optimize its portfolio, Cenovus has put its legacy conventional oil and natural gas assets up for sale and intends to apply the proceeds from these divestitures against the company’s asset-sale bridge facility. Data rooms for the Pelican Lake and Suffield assets in Alberta have been open since late March, and data rooms for the Palliser assets in Alberta and Weyburn assets in Saskatchewan were opened this month. “While they are no longer core to Cenovus, these are high-quality assets that continued to deliver solid cash flows and safe and reliable performance in the second quarter,” said

  • Ferguson. “We anticipate announcing sale agreements for both Pelican Lake and Suffield

later in the third quarter and for Palliser and Weyburn in the fourth quarter. With the successful completion of these divestitures we expect to make substantial progress towards

  • ur target of between $4 billion and $5 billion in announced asset sale agreements during

2017.” Financial perform ance During the second quarter, Cenovus generated adjusted funds flow of $792 million or $0.71 per share compared with $440 million or $0.53 per share in the same period a year earlier, even as West Texas Intermediate (WTI) averaged below US$50/barrel (bbl) in the quarter. This was mostly due to higher liquids and natural gas sales volumes related to the acquisition and incremental volumes from new oil sands phases as well as increased liquids and natural gas sales prices, a realized risk management gain on foreign exchange contracts and a higher current tax recovery compared with 2016. The increase in adjusted funds flow was partially offset by higher finance costs primarily associated with additional debt incurred to finance the acquisition. Second quarter cash from operating activities was $1.2 billion, compared with $205 million in the same period in 2016. Cenovus’s average liquids sales price rose 22% to $41.35/bbl in the second quarter, largely in line with improved crude oil benchmark prices during the period. Including realized hedges, Cenovus had a company-wide netback of $19.02 per barrel of oil equivalent (BOE)

  • n its liquids and natural gas production in the second quarter, compared with $13.43/BOE

in the year earlier period.

Cenovus Energy Inc. Second Quarter 2017 Report Page 2 News Release

slide-3
SLIDE 3

Cenovus had second quarter free funds flow of $465 million compared with $204 million in the same period of 2016. Operating margin net of capital investment from the company’s upstream oil and natural gas operations was $480 million in the second quarter, including the 45 days of contribution from the Deep Basin assets. Hedging Cenovus has an active hedging program to support cash outflows and help maintain financial resilience. To further support the company’s financial resilience while the asset-sale bridge facility remains outstanding, Cenovus has hedged a greater percentage of forecast liquids and natural gas volumes. As of July 24, 2017, the company has crude oil hedges in place on approximately 232,000 barrels per day (bbls/d) for the remainder of this year at an average Brent floor price of approximately US$50.74/bbl and 105,000 bbls/d for the first half of 2018 at an average floor price of approximately US$48.55/bbl using both WTI and Brent hedges. Hedges in place for the second half of 2018 consist of 27,000 bbls/d at an average WTI price of US$48.34/bbl. Cenovus also has natural gas hedges in place at an average New York Mercantile Exchange (NYMEX) price of approximately US$3.08 per million British thermal units (MMBtu) on approximately 116,000 MMBtu per day for the remainder

  • f 2017.

Current hedge positions for 2017

Hedges at July 2 4 , 2 0 1 7 Volum e Price Crude – Brent Fixed Price July - December ~127,000 bbls/d US$51.34/bbl Crude – W TI Collars July - December 50,000 bbls/d US$44.84/bbl - US$56.47/bbl Crude – Brent Put Contracts July - December 55,000 bbls/d US$53.00/bbl Crude – Brent - W TI Spread July - December 50,000 bbls/d US$(1.88)/bbl Natural Gas – NYMEX Fixed Price July - December ~116,000 MMBtu/d US$3.08/MMBtu

Current hedge positions for 2018

Hedges at July 2 4 , 2 0 1 7 Volum e Price Crude – Brent Collars January - June 30,000 bbls/d US$49.78/bbl - US$62.08/bbl Crude – Brent Fixed Price January - June 10,000 bbls/d US$54.06/bbl Crude – W TI Collars January - June 10,000 bbls/d US$45.30/bbl - US$62.77/bbl Crude – W TI Fixed Price January - June 55,000 bbls/d US$47.47/bbl Crude – W TI Fixed Price July - December 27,000 bbls/d US$48.34/bbl

Continued cost leadership & capital discipline Since 2014, Cenovus has achieved significant cost reductions across its business, including reducing its per-barrel oil sands non-fuel operating costs by more than 30% and its per- barrel oil sands sustaining capital costs by 50%. As part of its continued commitment to

Cenovus Energy Inc. Second Quarter 2017 Report Page 3 News Release

slide-4
SLIDE 4

cost leadership, the company plans to achieve an additional $1 billion of cumulative capital,

  • perating and general and administrative (G&A) cost reductions over the next three years.

To reflect the expected ongoing cost savings and efficiency improvements in its base business as well as the company’s continued focus on capital discipline, Cenovus has further updated its capital spending guidance for 2017. Compared with the company’s June 20, 2017 guidance, total planned capital expenditures this year have been reduced by approximately $200 million at the midpoint of the range, with no expected impact to forecast production volumes for the year. The reduced capital spending is largely due to continued improvements in drilling performance, development planning and optimized scheduling of well startups at Cenovus’s oil sands operations as well as the company’s decision to suspend its drilling program at Palliser for the remainder of the year. Cenovus will continue to evaluate additional opportunities to reduce capital spending across its

  • business. Updated guidance is available at cenovus.com under Investors.

CEO succession plan Brian Ferguson will retire as President & Chief Executive Officer and as a director of the company on October 31, 2017 and will then continue in an advisory role reporting to the Board Chair until March 31, 2018 to facilitate the leadership transition. Cenovus has engaged an executive search firm which is currently conducting a global search for a new Chief Executive Officer. A committee of the Board of Directors has been appointed to

  • versee the process.

“Brian has provided Cenovus with strong leadership through the best and worst of the commodity price cycle, and with our recent acquisition, he has left the company well positioned for the future,” said Patrick Daniel, Chair of the Cenovus Board. “As we look for a suitable successor, the Board will consider candidates who have the experience and dynamism to advance and execute the company’s strategy.” Oil sands production Production at Cenovus’s Christina Lake and Foster Creek oil sands operations rose to nearly 262,000 bbls/d in the second quarter of 2017, an increase of 84% from the same period a year ago. The increase was mainly due to the acquisition and to incremental volumes from Foster Creek phase G and Christina Lake phase F, both of which began producing in the second half of 2016. Construction at Christina Lake phase G resumed in the first quarter of 2017, and activity is expected to ramp up through the second half of the year. The expansion, which is expected to be completed with go-forward capital investment of between $16,000 and $18,000 per flowing barrel, is anticipated to begin production in 2019. Deep Basin production The integration of Cenovus’s new Deep Basin leadership team, staff and assets is proceeding as planned. Production from the Deep Basin between the acquisition closing date

  • n May 17, 2017 and the end of the quarter averaged more than 119,000 barrels of oil

equivalent per day (BOE/d), in line with the company’s expectations. Averaged across the second quarter, Deep Basin production was approximately 59,000 BOE/d. Cenovus has identified approximately 1,500 net drilling opportunities in the Deep Basin with the potential to generate strong returns, and the company plans to increase production from the assets to an average of 240,000 BOE/d in 2021. Cenovus spudded its first Deep Basin well during the second quarter.

Cenovus Energy Inc. Second Quarter 2017 Report Page 4 News Release

slide-5
SLIDE 5

“We brought over an experienced, talented and engaged team from ConocoPhillips,” said

  • Ferguson. “They’re focused on the safe and reliable delivery of our Deep Basin program, and

I’m confident that the wealth of experience they bring will help drive significant value from these high-quality assets.”

Second quarter details

Financial

 Operating margin was $778 million in the second quarter, a 44% increase from the same period in 2016. Upstream operating margin increased largely due to higher liquids and natural gas sales volumes as a result of the acquisition, as well as increased liquids and natural gas sales prices. This increase was partially offset by higher transportation and blending expenses, and the increase in operating expenses primarily related to the acquisition, higher fuel costs and the planned turnaround at Foster Creek. Higher royalties and a decrease in risk management gains compared with a year ago also impacted upstream operating margin.  Cash from operating activities was $1.2 billion compared with $205 million in the second quarter of 2016. Adjusted funds flow was $792 million or $0.71 per share compared with $440 million or $0.53 per share in the second quarter a year earlier. The increase in cash from operating activities and adjusted funds flow was primarily the result of higher operating margin, a realized risk management gain on foreign exchange contracts due to hedging activity and a higher current tax recovery compared with 2016. This was partially offset by higher finance costs primarily associated with additional debt incurred to finance the acquisition.  Operating earnings were $398 million or $0.36 per share in the second quarter of 2017 compared with an operating loss of $39 million or $0.05 per share in the same period a year earlier. The increase in operating earnings was primarily due to higher cash from operating activities and adjusted funds flow, unrealized foreign exchange gains related to operating activities and the remeasurement of the contingent payment to ConocoPhillips. The increase in operating earnings was partially offset by higher depreciation, depletion and amortization (DD&A).  Cenovus had net earnings of $2.6 billion or $2.37 per share in the second quarter of

  • 2017. This compares with a net loss of $267 million or $0.32 per share in the same

period a year earlier. Net earnings in this year’s quarter included a non-cash, after- tax revaluation gain of $1.8 billion related to the deemed disposition of the company’s pre-existing interest in the FCCL partnership, as well as unrealized risk management gains of $132 million in the second quarter compared with unrealized losses of $284 million in the same period a year earlier. Net earnings in the quarter also included non-operating unrealized foreign exchange gains of $279 million related to the translation of Cenovus’s U.S. dollar denominated debt compared with unrealized losses of $18 million in 2016.  G&A costs were $58 million, down from $94 million in the second quarter of 2016. The decrease was primarily due to lower long-term employee incentive costs related to a drop in Cenovus’s share price, compared with the same period in 2016, and a slight recovery this year for certain Calgary office space in excess of the company’s current and near-term requirements compared with a non-cash expense in the same period a year ago. Cenovus also recorded $19 million of severance costs in the second quarter of 2016.

Cenovus Energy Inc. Second Quarter 2017 Report Page 5 News Release

slide-6
SLIDE 6

 Cenovus had second quarter free funds flow of $465 million compared with $204 million in the same period in 2016.  The company ended the second quarter of 2017 with total liquidity of about $5 billion comprised of cash and cash equivalents of approximately $489 million as well as $4.5 billion in undrawn capacity under its committed credit facility and no long-term fixed debt maturities until the fourth quarter of 2019.  For the third quarter of 2017, the Board of Directors has declared a dividend of $0.05 per share, payable on September 29, 2017 to common shareholders of record as of September 15, 2017. Based on the July 26, 2017 closing share price on the Toronto Stock Exchange of $9.95, this represents an annualized yield of about 2.0%. Declaration of dividends is at the sole discretion of the Board and will continue to be evaluated on a quarterly basis.

Oil sands

Foster Creek  Production averaged 107,859 bbls/d in the second quarter, 67% higher than in the same period of 2016, primarily due to the acquisition, which added 36,534 bbls/d during the quarter. June volumes averaged nearly 166,000 bbls/d. During the quarter, Cenovus safely completed a 20-day planned turnaround, including several days each for ramp-down and ramp-up. The turnaround was completed within budget.  Non-fuel per-barrel operating costs increased 11% to $9.42 compared with the second quarter of 2016, primarily as a result of the turnaround, which increased costs for repairs and maintenance, and fluid, waste handling and trucking. Including the impact of higher natural gas prices, total per-barrel operating costs were $12.31, 21% higher than in the same period in 2016.  The steam to oil ratio (SOR), the amount of steam needed to produce one barrel of

  • il, was 2.5 in the second quarter of 2017, compared with 2.9 in the same period of

2016. Christina Lake  In the second quarter, production averaged 153,953 bbls/d, a 97% increase from the same period in 2016, primarily due to the acquisition, which added 51,709 bbls/d during the quarter. June volumes averaged more than 205,000 bbls/d.  Non-fuel per-barrel operating costs were $ 4.66, a 5% decrease from a year ago, primarily due to higher production. Including the impact of higher natural gas prices, total per-barrel operating costs were $7.04, 11% higher than in the second quarter a year earlier.  The SOR was 1.7 in the second quarter of 2017, compared with 1.8 a year earlier.

Deep Basin

 Liquids production, including light and medium crude oil as well as natural gas liquids (NGLs) for the first 45 days of Deep Basin operations, was 34,163 bbls/d, while natural gas production amounted to 512 million cubic feet per day (MMcf/d).  Averaged across the quarter, production of natural gas was 253 MMcf/d, while liquids production averaged 16,894 bbls/d.  Operating costs were $8.84/BOE, driven by workforce, repairs and maintenance, property tax and lease costs, and electricity.

Cenovus Energy Inc. Second Quarter 2017 Report Page 6 News Release

slide-7
SLIDE 7

 Cenovus started development activities and began a disciplined 28 net well drilling program for 2017, focusing on horizontal production wells targeting liquids-rich natural gas.

Dow nstream

 The Wood River Refinery in Illinois and Borger Refinery in Texas, which Cenovus jointly owns with the operator, Phillips 66, processed a combined average of 449,000 bbls/d gross of oil (98% utilization) in the second quarter of 2017, compared with 458,000 bbls/d gross in the year earlier period (100% utilization).

Cenovus had refining and marketing operating margin of $20 million in the quarter, compared with $193 million in the same period of 2016. The decrease was the result

  • f narrowing heavy crude oil differentials and lower average market crack spreads.

The company’s refining operating margin is calculated on a first-in, first-out (FIFO) inventory accounting basis. Using the last-in, first-out (LIFO) accounting method employed by most U.S. refiners, Cenovus’s operating margin from refining and marketing would have been $31 million higher in the quarter. In the second quarter

  • f 2016, operating margin would have been $110 million lower on a LIFO reporting

basis.

Other developm ents

 Corporate Knights magazine recognized Cenovus as one of the Best 50 Corporate Citizens in Canada for 2016, the seventh consecutive year the company has been included in the listing.

Cenovus Energy Inc. Second Quarter 2017 Report Page 7 News Release

slide-8
SLIDE 8

MANAGEMENT’S DISCUSSION AND ANALYSIS

This Management’s Discussion and Analysis (“MD&A”) for Cenovus Energy Inc. (which includes references to “we”, “our”, “us”, “its”, or “Cenovus”, mean Cenovus Energy Inc., the subsidiaries of, and partnership interests held by, Cenovus Energy Inc. and its subsidiaries) dated July 26, 2017, should be read in conjunction with our June 30, 2017 unaudited interim Consolidated Financial Statements and accompanying notes (“interim Consolidated Financial Statements”), the December 31, 2016 audited Consolidated Financial Statements and accompanying notes (“Consolidated Financial Statements”) and the December 31, 2016 MD&A (“annual MD&A”). All of the information and statements contained in this MD&A are made as of July 26, 2017, unless

  • therwise indicated. This MD&A provides an update to our annual MD&A and contains forward-looking information about our current expectations,

estimates, projections and assumptions. The information in this MD&A, as it relates to our operations for the three and six months ended June 30, 2017, reflects the closing of the Acquisition (as defined in this MD&A) on May 17, 2017. See the Transformational Acquisition section of this MD&A for more

  • details. See the Advisory for information on the risk factors that could cause actual results to differ materially and the assumptions underlying our

forward-looking information. Cenovus Management prepared the MD&A. The interim MD&As are approved by the Audit Committee of the Cenovus Board

  • f Directors (the “Board”) and the annual MD&A is reviewed by the Audit Committee and recommended for its approval by the Board. Additional

information about Cenovus, including our quarterly and annual reports, the Annual Information Form (“AIF”) and Form 40-F, is available on SEDAR at sedar.com, on EDGAR at sec.gov, and on our website at cenovus.com. Information on or connected to our website, even if referred to in this MD&A, does not constitute part of this MD&A. Basis of Presentation This MD&A and the Consolidated Financial Statements and comparative information have been prepared in Canadian dollars, except where another currency has been indicated, and in accordance with International Financial Reporting Standards (“IFRS” or “GAAP”) as issued by the International Accounting Standards Board (“IASB”). Production volumes are presented on a before royalties basis. Non-GAAP Measures and Additional Subtotals Certain financial measures in this document do not have a standardized meaning as prescribed by IFRS, such as Netbacks, Adjusted Funds Flow, Operating Earnings, Free Funds Flow, Debt, Net Debt, Capitalization and Adjusted Earnings Before Interest, Taxes, Depreciation and Amortization (“Adjusted EBITDA”) and therefore are considered non-GAAP measures. In addition, Operating Margin is considered an additional subtotal found in note 1 and note 8 of our interim Consolidated Financial Statements. These measures may not be comparable to similar measures presented by other issuers. These measures have been described and presented in order to provide shareholders and potential investors with additional measures for analyzing our ability to generate funds to finance our operations and information regarding our liquidity. This additional information should not be considered in isolation or as a substitute for measures prepared in accordance with IFRS. The definition and reconciliation, if applicable, of each non-GAAP measure or additional subtotal is presented in the Financial Results, Operating Results, Liquidity and Capital Resources, or Advisory sections of this MD&A.

OVERVIEW OF CENOVUS

We are a Canadian integrated oil company headquartered in Calgary, Alberta, with our shares listed on the Toronto and New York stock exchanges. On June 30, 2017, we had an enterprise value of approximately $24 billion. We are in the business of developing, producing and marketing crude oil, natural gas liquids (“NGLs”) and natural gas in Western Canada. We also conduct marketing activities and have refining operations in the United States (“U.S.”). Our average crude oil and NGLs (collectively, “liquids”) production for the six months ended June 30, 2017 was approximately 284,565 barrels per day, our average natural gas production was 492 MMcf per day, and our total reported production was 366,556 BOE per day. The refining operations processed an average of 428,000 gross barrels per day of crude oil feedstock into an average of 455,000 gross barrels per day of refined products. Oil Sands and Deep Basin Acquisition On May 17, 2017, we closed an acquisition from ConocoPhillips Company and certain of its subsidiaries (collectively, “ConocoPhillips”) where we acquired their 50 percent interest in FCCL Partnership (“FCCL”) and the majority of their western Canadian conventional crude oil and natural gas assets in Alberta and British Columbia (the “Acquisition”). The Acquisition provides us with control over our oil sands operations, doubles our oil sands production, and almost doubles our proved bitumen reserves. In addition, the Acquisition provides a second growth platform with more than three million net acres of land, exploration and production assets, and related infrastructure in Alberta and British Columbia (collectively, the “Deep Basin Assets”). The Deep Basin Assets are expected to provide short-cycle development opportunities that complement our long-term oil sands growth portfolio. Concurrent with the March 29, 2017 announcement of the Acquisition, we commenced marketing for sale our Pelican Lake heavy oil assets, including the adjacent Grand Rapids project in the Greater Pelican Lake region, and

  • ur Suffield crude oil and natural gas assets in southern Alberta to help fund the Acquisition. On June 20, 2017, we

announced our intention to divest the remainder of our legacy Conventional assets, including our Palliser assets in southern Alberta and our Weyburn oil operation in southern Saskatchewan. Our Conventional segment has been classified as a discontinued operation in our interim Consolidated Financial Statements. Our Strategy We have updated our strategy to reflect the Acquisition and our increased focus on free funds flow. Our strategy is to increase cash flows through disciplined production growth from our vast portfolio of oil sands and Deep Basin natural gas and liquids assets in Western Canada. We are focused on maximizing shareholder value through cost leadership and realizing the best margins for our products to help us maintain financial resilience and deliver sustainable dividend growth. We plan to achieve our strategy by drawing on the expertise of our people and leveraging our strategic differentiators: premium asset quality, executional excellence, value-added integration, focused innovation and trusted reputation. Cenovus Energy Inc. Second Quarter 2017 Report Page 8 Management's Discussion and Analysis

slide-9
SLIDE 9

We measure our performance through a balanced scorecard that reflects our financial, operational, safety, environmental and organizational health goals. Our Key Strategic Differentiators Premium Asset Quality Cenovus has a deep portfolio of premium-quality oil sands, conventional oil, and natural gas assets that we believe provide us with significant cost and environmental performance advantages. Our in-situ oil sands projects and Deep Basin Assets in Western Canada offer long and short cycle opportunities that provide the capital investment flexibility to position us to deliver value growth at various points of the price cycle. In addition to our exploration and production assets, we have complementary interests in refineries and product transportation infrastructure. Executional Excellence Our team is committed to delivering on our business plan in a safe, disciplined and responsible manner and continuously improving our performance to help manage risk and optimize returns. We use a manufacturing approach to support consistent performance and enhance reliability. This involves applying standardized and repeatable designs and processes to the construction and operation of our facilities to reduce costs and improve efficiencies at all project stages. We strive to execute our work in an agile manner with a focus on using our resources effectively. Value-Added Integration Our integrated business approach helps provide stability to our cash flows and maximize value for the oil and natural gas we produce. Having ownership in oil refineries positions us to capture the full value chain from production to high-quality end products like transportation fuels. In addition, our pipeline commitments, marine capability, crude-by-rail loading facility and product marketing activities position us to obtain global pricing for our

  • il. As a consumer of natural gas at our oil sands facilities and refineries, our natural gas production acts as an

economic hedge to help manage price volatility. In addition, our cogeneration plants efficiently provide power for

  • ur oil sands facilities with the added value of excess electricity being sold to the grid.

Focused Innovation We focus our innovation efforts on accelerating the adoption of technology solutions and methods of operating to enhance safety, aggressively reduce costs, improve margins and lower emissions. We expect innovation at Cenovus to mean significant improvements and game-changing developments that are implemented to generate

  • value. We embrace the “fail fast” mentality as essential to encouraging behaviours that can transform how we
  • perate. The application of digital innovation across our business is expected to be a key contributor to our

competitive advantage. We aim to complement our internal technology development efforts with external collaboration that brings together smart people with diverse ideas that leverage our technology spend. Trusted Reputation We are a responsible, progressive company that is committed to providing a safe and healthy workplace, building strong external relationships, minimizing our environmental footprint and being a part of a zero-emissions future. Our actions are intended to support our trusted reputation and enable us to attract and retain top-quality staff and to engage with and be respected by our stakeholders: investors, the communities in which we operate, environmental groups, governments, Aboriginal people, media, project partners and the general public. Our Operations Oil Sands Our oil sands assets include steam-assisted gravity drainage (“SAGD”) oil sands projects in northern Alberta, namely Foster Creek, Christina Lake, Narrows Lake and other emerging projects. Foster Creek and Christina Lake are producing, while Narrows Lake is in the initial stages of development. These three projects, located in the Athabasca region of northeastern Alberta, are 100 percent owned by Cenovus following the Acquisition. Our 100 percent-owned emerging project at Telephone Lake is located within the Borealis region of northeastern Alberta.

Six Months Ended June 30, 2017 ($ millions) Crude Oil Natural Gas Operating Margin 791 3 Capital Investment 384 3 Operating Margin Net of Related Capital Investment 407

  • Deep Basin

The Deep Basin includes approximately three million net acres of land rich in natural gas and natural gas liquids. The assets are located primarily in the Elmworth-Wapiti, Kaybob-Edson, and Clearwater operating areas and Cenovus Energy Inc. Second Quarter 2017 Report Page 9 Management's Discussion and Analysis

slide-10
SLIDE 10

include interests in numerous natural gas processing facilities. The Deep Basin Assets are expected to provide short-cycle development opportunities with high return potential that complement our long-term oil sands development and provide an economic hedge for the natural gas required as a fuel source at both our oil sands and refining operations. The Deep Basin Assets were acquired on May 17, 2017.

($ millions) May 17 – June 30, 2017 Operating Margin 55 Capital Investment 13 Operating Margin Net of Related Capital Investment 42

Conventional Our Conventional segment has been classified as a discontinued operation. We are currently marketing for sale all assets within our Conventional segment. This includes our Pelican Lake heavy oil assets, our Suffield crude oil and natural gas assets, our carbon dioxide (“CO2”) enhanced oil recovery project at Weyburn, and our Palliser assets in southern Alberta. Crude oil production from our Conventional business segment generates dependable near-term cash flows while the natural gas production acts as an economic hedge for the natural gas required as a fuel source at both our oil sands and refining operations.

Six Months Ended June 30, 2017 ($ millions) Liquids Natural Gas Operating Margin 214 89 Capital Investment 132 6 Operating Margin Net of Related Capital Investment 82 83

Refining and Marketing Our operations include two refineries located in Illinois and Texas that are jointly owned with (50 percent interest) and operated by Phillips 66, an unrelated U.S. public company. The gross crude oil capacity at the Wood River and Borger refineries (the “Refineries”) is approximately 314,000 barrels per day and 146,000 barrels per day,

  • respectively. This includes processing capability of up to 255,000 gross barrels per day of blended heavy crude oil.

The refining operations allows us to capture the value from crude oil production through to refined products, such as diesel, gasoline and jet fuel, to partially mitigate volatility associated with regional North American light/heavy crude oil price differential fluctuations. This segment also includes our crude-by-rail terminal operations, located in Bruderheim, Alberta, and the marketing of third-party purchases and sales of product undertaken to provide operational flexibility for transportation commitments, product quality, delivery points and customer diversification.

($ millions) Six Months Ended June 30, 2017 Operating Margin 73 Capital Investment 86 Operating Margin Net of Related Capital Investment (13)

OIL SANDS AND DEEP BASIN ACQUISITION

On May 17, 2017, we closed an acquisition acquiring ConocoPhillips’ 50 percent interest in FCCL and the majority of ConocoPhillips’ western Canadian conventional assets in Alberta and British Columbia. The Acquisition provides us with control over our oil sands operations, doubles our oil sands production, and almost doubles our proved bitumen reserves. The Deep Basin Assets provide an additional growth platform with more than three million net acres of land, exploration and production assets, and related infrastructure in Alberta and British Columbia. The Deep Basin Assets are expected to provide complementary short-cycle development opportunities with high return potential. Total consideration for the Acquisition includes US$10.6 billion in cash, before adjustments, and 208 million Cenovus common shares. To finance the cash portion of the purchase price, we:  Completed a Bought-Deal Common Share Offering on April 6, 2017 for 187.5 million common shares at a price

  • f $16.00 per share, raising gross proceeds of $3.0 billion;

 Completed an offering in the U.S. on April 7, 2017 for US$2.9 billion of senior unsecured notes – US$1.2 billion 4.25 percent senior unsecured notes due April 2027, US$700 million 5.25 percent senior unsecured notes due June 2037, and US$1.0 billion 5.40 percent senior unsecured notes due June 2047;  Borrowed $3.6 billion under a committed asset sale bridge credit facility (“Bridge Facility”); and  Funded the remainder of the purchase price through cash on hand and a draw on our existing committed credit facility. Cenovus Energy Inc. Second Quarter 2017 Report Page 10 Management's Discussion and Analysis

slide-11
SLIDE 11

The committed Bridge Facility consists of three tranches which mature 12 months, 18 months and 24 months, respectively, following the Acquisition closing date. We expect to repay the committed Bridge Facility through the sale of certain assets including our legacy Conventional assets. The Acquisition has an effective date of January 1, 2017. The majority of the purchase price was allocated to Property, Plant and Equipment (“PP&E”), Exploration and Evaluation (“E&E”) assets, and goodwill. Refer to Note 4 in the interim Consolidated Financial Statements for a summary of the recognized amounts of acquired assets and liabilities assumed at the date of the Acquisition. For accounting purposes, total consideration includes $361 million related to a contingent payment. See the Corporate and Eliminations section of this MD&A for more details. Prior to the Acquisition, Cenovus’s 50 percent interest in FCCL was jointly controlled with ConocoPhillips and met the definition of a joint operation under IFRS 11, “Joint Arrangements” and as such Cenovus recognized its share of the assets, liabilities, revenues and expenses in its consolidated results. Subsequent to the Acquisition, Cenovus controls FCCL, as defined under IFRS 10, “Consolidated Financial Statements” and accordingly, FCCL has been

  • consolidated. As required by IFRS 3, when control is achieved in stages, the previously held interest in FCCL was

re-measured to its fair value of $12.3 billion and a non-cash revaluation gain of $2.5 billion ($1.8 billion, after-tax) was recorded in net earnings. The safe and efficient integration of the Deep Basin Assets is a top priority for Cenovus. We are committed to ensuring strong stakeholder and community relations as we establish ourselves as a new operator in the Deep Basin area. Additional information on the Acquisition is available in our news release, dated March 29, 2017 available on SEDAR at sedar.com, on EDGAR at sec.gov, and on our website at cenovus.com, in our material change report dated April 5, 2017 and in our Business Acquisitions Report dated July 19, 2017, both available on SEDAR and EDGAR.

QUARTERLY HIGHLIGHTS

We successfully closed the Acquisition in the second quarter of 2017, resulting in control of our oil sands operations and more than doubling our total production. Incremental production from the Acquisition was 297,720 BOE per day for the period May 17 to June 30, 2017 or 147,224 BOE per day for the three months ended June 30, 2017. Our previously announced divestiture process for the Pelican Lake and Suffield assets is progressing well and is on

  • track. On June 20, 2017, we announced our plan to divest our Palliser asset in southern Alberta and our Weyburn
  • il operation in southern Saskatchewan. Proceeds from the sale of these assets will be used to repay the

committed Bridge Facility and deleverage our balance sheet. During the quarter, crude oil prices continued to be volatile. Although West Texas Intermediate (“WTI”) averaged approximately US$48 per barrel, a six percent increase from the same period in 2016, it ranged from a high of US$53.40 per barrel to a low of US$42.53 per barrel. In addition, AECO averaged $2.77 per Mcf, more than doubling from the second quarter of 2016. AECO ranged from a high of $3.03 per Mcf to a low of $2.15 per Mcf. Our average sales price increased 29 percent from 2016, contributing to a companywide Netback of $18.74 per BOE in the second quarter, before realized hedging. We continue to focus on cost leadership and capital discipline to help maintain financial resilience, while delivering safe and reliable operations. In the second quarter, we:  Increased total liquids production by 68 percent from the second quarter of 2016, primarily due to incremental production volumes from the Acquisition as well as from Foster Creek phase G and Christina Lake phase F, both of which started up in the second half of 2016;  Generated combined upstream revenues, including the Conventional segment, of $2,082 million compared with $967 million in 2016, primarily related to increased sales volumes and higher liquids sales prices;  Reported upstream operating costs, including the Conventional segment, of $387 million, an increase of $176 million compared with the second quarter of 2016 primarily due to the Acquisition, higher fuel costs as a result of an increase in natural gas prices, and costs related to Foster Creek turnaround activities;  Achieved Cash From Operating Activities and Adjusted Funds Flow of $1,239 million and $792 million, respectively, an increase from the second quarter of 2016 of $1,034 million and $352 million, respectively; and  Recorded net earnings of $2.6 billion, which included an after-tax revaluation gain of $1.8 billion on our pre- existing interest in FCCL. Cenovus Energy Inc. Second Quarter 2017 Report Page 11 Management's Discussion and Analysis

slide-12
SLIDE 12

OPERATING RESULTS

Our upstream assets continued to perform well in the three and six months ended June 30, 2017. Total production increased primarily due to the Acquisition and our recent oil sands expansion phases. Production Volumes

Three Months Ended June 30, Six Months Ended June 30, 2017 Percent Change 2016 2017 Percent Change 2016 Liquids (barrels per day) Oil Sands Foster Creek 107,859 67% 64,544 94,437 51% 62,713 Christina Lake 153,953 97% 78,060 127,442 64% 77,577 261,812 84% 142,604 221,879 58% 140,290 Deep Basin Light and Medium Oil 3,059

  • %
  • 1,538
  • %
  • NGLs

13,835

  • %
  • 6,956
  • %
  • 16,894
  • %
  • 8,494
  • %
  • Conventional (Discontinued Operations)

Heavy Oil 26,593 (7)% 28,500 26,933 (10)% 29,873 Light and Medium Oil 27,233 4% 26,177 26,167 (2)% 26,649 NGLs 1,132 42% 799 1,090 9% 1,003 54,958 (1)% 55,476 54,190 (6)% 57,525 Total Liquids Production (barrels per day) 333,664 68% 198,080 284,563 44% 197,815 Natural Gas (MMcf per day) Oil Sands 12 (33)% 18 13 (24)% 17 Deep Basin 253

  • %
  • 127
  • %
  • Conventional (Discontinued Operations)

355 (7)% 381 352 (9)% 386 Total Natural Gas Production (MMcf per day) 620 55% 399 492 22% 403 Total Production (BOE per day) 436,929 65% 264,580 366,556 38% 264,982

Production at Foster Creek and Christina Lake was higher in the three and six months ended June 30, 2017 due to the incremental production volumes from the Acquisition and expansion phases, partially offset by the impact of a 20-day planned turnaround, including ramp down and ramp up, at Foster Creek. The planned turnaround was the largest scale turnaround executed to date at Foster Creek. The increase in production at Foster Creek and Christina Lake from May 17, 2017 to June 30, 2017, due to the Acquisition, was 73,880 barrels per day and 104,567 barrels per day, respectively. Total production from the Deep Basin for the 45 days of operations averaged 119,273 BOE per day, equivalent to 58,981 BOE per day for the three months ended June 30, 2017, and 29,654 BOE per day for the six months ended June 30, 2017. Deep Basin liquids production from May 17, 2017 to June 30, 2017 was 34,163 barrels per day, equivalent to 16,894 barrels per day for the three months ended June 30, 2017 and 8,494 barrels per day for the six months ended June 30, 2017. Our Conventional liquids production declined in the second quarter and on a year-to-date basis compared to 2016 primarily due to expected natural declines, partially offset by an increase in production associated with the tight oil drilling program in southern Alberta. In the second quarter of 2016, production at Pelican Lake was shut-down for two days as a safety precaution due to a nearby forest fire resulting in lost production of approximately 650 barrels per day for the quarter. In the second quarter and on a year-to-date basis, our natural gas production increased compared with 2016 due to the Acquisition, partially offset by expected natural declines in our Conventional segment. Natural gas production from the Deep Basin for the 45 days of operation was approximately 512 MMcf per day. Cenovus Energy Inc. Second Quarter 2017 Report Page 12 Management's Discussion and Analysis

slide-13
SLIDE 13

Netbacks Netback is a non-GAAP measure commonly used in the oil and gas industry to assist in measuring operating performance on a per-unit basis. Netbacks reflect our margin on a per-barrel of oil equivalent basis. Netback is defined as gross sales less royalties, transportation and blending, operating expenses and production and mineral taxes divided by sales volumes. Netbacks do not reflect the non-cash write-downs of product inventory until the product is sold. The sales price, transportation and blending costs, and sales volumes exclude the impact of purchased condensate. Condensate is blended with the heavy oil to reduce its thickness in order to transport it to

  • market. Our Netback calculation is aligned with the definition found in the Canadian Oil and Gas Evaluation
  • Handbook. For a reconciliation of our Netbacks see the Advisory section of this MD&A.

Three Months Ended June 30, Six Months Ended June 30, ($/BOE) 2017 2016 2017 2016 Sales Price 35.58 27.56 35.89 21.41 Royalties 2.34 1.51 2.62 1.16 Transportation and Blending 4.78 5.07 4.55 4.79 Operating Expenses 9.59 8.89 9.67 9.52 Production and Mineral Taxes 0.13 0.12 0.16 0.10 Netback Excluding Realized Risk Management (1) 18.74 11.97 18.89 5.84 Realized Risk Management Gain (Loss) 0.28 1.46 (1.21) 3.81 Netback Including Realized Risk Management (1) 19.02 13.43 17.68 9.65

(1)

Includes results from our Conventional segment, which has been classified as a discontinued operation.

Our average Netback for the second quarter of 2017 and on a year-to-date basis, excluding realized risk management gains and losses, was substantially higher compared with 2016. The rise in our average Netback was primarily due to increased sales prices, consistent with the rise in benchmark prices, a weakening of the Canadian dollar relative to the U.S. dollar, and the increase in diversity of products with higher light and medium crude oil and NGLs being produced as a result of the Acquisition, partially offset by higher royalties. On a year-to-date basis, the weakening of the Canadian dollar compared with 2016 had a positive impact on our sales price of approximately $0.10 per BOE. Refining In the second quarter, crude oil runs and refined product output declined slightly compared with 2016 primarily due to unplanned maintenance at both Refineries. On a year-to-date basis, crude oil runs and refined product

  • utput declined due to the larger scope of the planned turnarounds at both Refineries during the first quarter of

2017 compared to 2016. In the three and six months ended June 30, 2017, lower heavy crude oil volumes were processed due to optimization of the total crude input slate.

Three Months Ended June 30, Six Months Ended June 30, 2017 Percent Change 2016 2017 Percent Change 2016 Crude Oil Runs (1) (Mbbls/d) 449 (2)% 458 428 (4)% 446 Heavy Crude Oil (1) 201 (12)% 228 201 (14)% 235 Refined Product (1) (Mbbls/d) 476 (1)% 483 455 (4)% 472 Crude Utilization (1) (percent) 98 (2)% 100 93 (4)% 97

(1)

Represents 100 percent of the Wood River and Borger refinery operations.

Operating Margin from Refining and Marketing in the three and six months ended June 30, 2017 was $20 million and $73 million, respectively (2016 – $193 million and $170 million, respectively). The decline in the second quarter was primarily due to a decrease in our gross margin, consistent with narrowing heavy crude oil differentials and lower average market crack spreads, partially offset by a decline in realized risk management losses in the second quarter of 2017 and the weakening of the Canadian dollar. On a year-to-date basis, the decline in Operating Margin was primarily due to narrowing of heavy crude oil differentials, lower crude utilization rates, higher operating costs and lower margins on the sale of secondary products. Further information on the changes in our production volumes, items included in our Netbacks and refining results can be found in the Reportable Segments section of this MD&A. Further information on our risk management activities can be found in the Risk Management section of this MD&A and in the notes to the June 30, 2017 interim Consolidated Financial Statements. Cenovus Energy Inc. Second Quarter 2017 Report Page 13 Management's Discussion and Analysis

slide-14
SLIDE 14

COMMODITY PRICES UNDERLYING OUR FINANCIAL RESULTS

Key performance drivers for our financial results include commodity prices, price differentials, refining crack spreads as well as the U.S./Canadian dollar exchange rate. The following table shows selected market benchmark prices and the U.S./Canadian dollar average exchange rates to assist in understanding our financial results. Selected Benchmark Prices and Exchange Rates (1)

Six Months Ended June 30, (US$/bbl, unless otherwise indicated) 2017 2016 Percent Change Q2 2017 Q1 2017 Q2 2016 Crude Oil Prices Brent Average 52.79 41.03 29% 50.92 54.66 46.97 End of Period 47.92 49.68 (4)% 47.92 52.83 49.68 WTI Average 50.10 39.52 27% 48.29 51.91 45.59 End of Period 46.04 48.33 (5)% 46.04 50.60 48.33 Average Differential Brent-WTI 2.69 1.51 78% 2.63 2.75 1.38 WCS Average 37.25 25.75 45% 37.16 37.33 32.29 Average (C$/bbl) 49.67 34.24 45% 49.95 49.38 41.61 End of Period 36.36 35.79 2% 36.36 39.77 35.79 Average Differential WTI-WCS 12.85 13.77 (7)% 11.13 14.58 13.30 Condensate (C5 @ Edmonton) Average (2) 50.35 39.23 28% 48.44 52.26 44.07 Average Differential WTI-Condensate (Premium)/Discount (0.25) 0.29 (186)% (0.15) (0.35) 1.52 Average Differential WCS-Condensate (Premium)/Discount (13.10) (13.48) (3)% (11.28) (14.93) (11.78) Mixed Sweet Blend (“MSW” @ Edmonton) Average 47.20 36.13 31% 46.03 48.37 42.51 End of Period 43.66 46.19 (5)% 43.66 50.07 46.19 Average Refined Product Prices Chicago Regular Unleaded Gasoline (“RUL”) 63.28 53.12 19% 63.44 63.13 64.25 Chicago Ultra-low Sulphur Diesel (“ULSD”) 63.02 51.98 21% 62.18 63.86 59.40 Refining Margin: Average 3-2-1 Crack Spreads (3) Chicago 13.16 13.36 (1)% 14.78 11.54 17.15 Average Natural Gas Prices AECO (C$/Mcf) 2.86 1.68 70% 2.77 2.94 1.25 NYMEX (US$/Mcf) 3.25 2.02 61% 3.18 3.32 1.95 Basis Differential NYMEX-AECO (US$/Mcf) 1.12 0.78 44% 1.13 1.10 0.99 Foreign Exchange Rate (US$ per C$1) Average 0.750 0.752

  • %

0.744 0.756 0.776

(1)

These benchmark prices do not reflect our realized sales prices. For our average realized sales prices and realized risk management results, refer to the Netbacks table in the Operating Results section of this MD&A.

(2)

The average Canadian dollar condensate benchmark price for the second quarter of 2017 was $65.11 per barrel (2016 – $56.79 per barrel) and for the six months ended June 30, 2017 was $67.13 per barrel (2016 – $52.17 per barrel).

(3)

The average 3-2-1 Crack Spread is an indicator of the refining margin and is valued on a last in, first out accounting basis.

Crude Oil Benchmarks The average Brent, WTI and Western Canadian Select (“WCS”) benchmark prices improved in the first six months

  • f 2017 as compliance with the production cuts agreed to in the fourth quarter of 2016 by the Organization of

Petroleum Exporting Countries (“OPEC”) led to wide-spread market expectations at the beginning of 2017 of an accelerated return to normal inventory levels without supporting supply and demand drivers. However, near the end of the first half of 2017 prices continued to be volatile as crude oil and product inventories did not decrease as expected partially due to the rising U.S. rig count and growing supply from the U.S., Libya and Nigeria. WTI is an important benchmark for Canadian crude oil since it reflects inland North American crude oil prices and its Canadian dollar equivalent is the basis for determining royalties for a number of our crude oil properties. WTI benchmark prices weakened relative to Brent compared with the second quarter of 2016 and on a year-to-date basis due to the combination of growing U.S. crude oil supply and OPEC’s compliance with production cuts. WCS is blended heavy oil which consists of both conventional heavy oil and unconventional diluted bitumen. The average WTI-WCS differential narrowed in the second quarter of 2017 and on a year-to-date basis compared with

  • 2016. The differential narrowed due to significant production outages in Alberta and OPEC cuts.

Cenovus Energy Inc. Second Quarter 2017 Report Page 14 Management's Discussion and Analysis

slide-15
SLIDE 15

Blending condensate with bitumen and heavy oil enables our production to be transported through pipelines. Our blending ratios range from approximately 10 percent to 33 percent. The WCS-Condensate differential is an important benchmark as a narrower differential generally results in an increase in the recovery of condensate costs when selling a barrel of blended crude oil. When the supply of condensate in Alberta does not meet the demand, Edmonton condensate prices may be driven by U.S. Gulf Coast condensate prices plus the cost attributed to transporting the condensate to Edmonton. The average WTI-Condensate differential narrowed in the second quarter of 2017 and on a year-to-date basis as a result of seasonal changes in blending requirements. MSW, is an Alberta based, Canadian light sweet crude oil benchmark that is representative of Canadian conventional production and comparable to the crude oil produced by our Deep Basin Assets. Refining Benchmarks The Chicago Regular Unleaded Gasoline (“RUL”) and Chicago Ultra-low Sulphur Diesel (“ULSD”) benchmark prices are representative of inland refined product prices and are used to derive the Chicago 3-2-1 crack spread. The 3-2-1 crack spread is an indicator of the refining margin generated by converting three barrels of crude oil into two barrels of regular unleaded gasoline and one barrel of ultra-low sulphur diesel using current month WTI-based crude oil feedstock prices and valued on a last in, first out accounting basis. Average Chicago refined product prices increased in the second quarter of 2017 and on a year-to-date basis primarily due to higher crude oil prices, partially offset by higher refinery utilization which increased supply. Average Chicago 3-2-1 crack spreads declined during the three and six months ended June 30, 2017 compared with 2016 due to higher refinery utilization. Our realized crack spreads are affected by many other factors such as the variety of crude oil feedstock, refinery configuration and product output, the time lag between the purchase and delivery of crude oil feedstock, and the cost of feedstock which is valued on a first in, first out (“FIFO”) accounting basis. Natural Gas Benchmarks Average natural gas prices in the second quarter and on a year-to-date basis increased significantly compared with

  • 2016. Natural gas prices strengthened in 2017 as North American inventory levels declined due to lower production

and stronger demand. Production decreased as a result of reduced drilling programs while demand increased from additional capacity to export North American natural gas to foreign markets, partially offset by mild weather and less natural gas used for domestic electricity generation. In 2016, natural gas prices were negatively impacted by an exceptionally warm winter that resulted in poor heating demand and record-high seasonal North American natural gas storage levels.

10 20 30 40 50 60 70 Jan Feb Mar Apr May June Jul Aug Sep Oct Nov Dec (average US$/bbl)

WTI Benchmark Price

2015 2016 Q1 Q2 Q3 Q4 2017 10 20 30 40 50 60 Jan Feb Mar Apr May June Jul Aug Sep Oct Nov Dec (average US$/bbl)

WCS Benchmark Price

2016 2015 Q4 Q1 Q2 Q3 2017 5 15 25 35 45 55 65 75 85 95 Jan Feb Mar Apr May June Jul Aug Sep Oct Nov Dec (average US$/bbl)

RUL Refined Product Price

2016 Q4 2015 Q1 Q2 Q3 2017 5 10 15 20 25 30 35 Jan Feb Mar Apr May June Jul Aug Sep Oct Nov Dec (average US$/bbl)

Chicago 3-2-1 Crack Spread

2016 Q4 2015 Q1 Q2 Q3 2017

Cenovus Energy Inc. Second Quarter 2017 Report Page 15 Management's Discussion and Analysis

slide-16
SLIDE 16

Foreign Exchange Benchmark Revenues are subject to foreign exchange exposure as the sales prices of our crude oil, natural gas and refined products are determined by reference to U.S. benchmark prices. A decrease in the value of the Canadian dollar compared with the U.S. dollar has a positive impact on our reported results. Likewise, as the Canadian dollar strengthens, our reported results are lower. In addition to our revenues being denominated in U.S. dollars, a portion of our long-term debt is also U.S. dollar denominated. In periods of a strengthening Canadian dollar, our U.S. dollar debt gives rise to unrealized foreign exchange gains when translated to Canadian dollars. In the second quarter and on a year-to-date basis, the Canadian dollar weakened relative to the U.S. dollar due to differing interest rate expectations between Canada and the U.S. The weakening of the Canadian dollar in the first half of the year, compared with 2016, had a positive impact of approximately $22 million on our revenues, including our Conventional segment. As at June 30, 2017, the Canadian dollar was stronger relative to the U.S. dollar on December 31, 2016, which resulted in $335 million of unrealized foreign exchange gains on the translation of our U.S. dollar debt.

FINANCIAL RESULTS

Selected Consolidated Financial Results The Acquisition and improvements in commodity prices in the first half of 2017 were the primary drivers of our financial results. The following key performance measures are discussed in more detail within this MD&A.

($ millions, except per share Six Months Ended June 30, 2017 2016 2015 amounts) 2017 2016 Q2 Q1 Q4 Q3 Q2 Q1 Q4 Q3 Q2 Revenues (1) (2) 7,578 4,737 4,037 3,541 3,324 2,945 2,746 1,991 2,601 2,905 3,244 Operating Margin (2) Total Operating Margin 1,228 685 778 450 595 487 541 144 357 602 932 From Continuing Operations 924 446 619 305 442 335 424 22 153 360 631 Cash From Operating Activities Total Cash From Operating Activities 1,567 387 1,239 328 164 310 205 182 322 542 335 From Continuing Operations 1,297 215 1,102 94 22 189 121 94 123 366 86 Adjusted Funds Flow (3) Total Adjusted Funds Flow 1,115 466 792 323 535 422 440 26 275 444 477 From Continuing Operations 833 287 650 (65) 382 296 352 (65) 71 266 227 Operating Earnings (Loss) (3) Total Operating Earnings (Loss) 359 (462) 398 (39) 321 (236) (39) (423) (438) (28) 151 Per Share – Diluted ($) 0.37 (0.55) 0.36 (0.05) 0.39 (0.28) (0.05) (0.51) (0.53) (0.03) 0.18 From Continuing Operations 305 (272) 344 (39) 21 (40) (3) (269) (245) (23) 201 Per Share – Diluted ($) 0.31 (0.33) 0.31 (0.05) 0.03 (0.05)

  • (0.32)

(0.29) (0.03) 0.24 Net Earnings (Loss) From Continuing Operations 2,792 (195) 2,581 211 (209) (55) (231) 36 (448) 1,806 176 Per Share – Basic and Diluted ($) 2.87 (0.23) 2.32 0.25 (0.25) (0.07) (0.28) 0.04 (0.54) 2.17 0.21 Net Earnings (Loss) 2,851 (385) 2,640 211 91 (251) (267) (118) (641) 1,801 126 Per Share – Basic and Diluted ($) 2.93 (0.46) 2.37 0.25 0.11 (0.30) (0.32) (0.14) (0.77) 2.16 0.15 Capital Investment (4) 640 559 327 313 259 208 236 323 428 400 357 Dividends Cash Dividends 102 83 61 41 42 41 42 41 132 133 125 In Shares from Treasury

  • 98

Per Share ($) 0.10 0.10 0.05 0.05 0.05 0.05 0.05 0.05 0.16 0.16 0.2662

(1)

Excludes revenues from discontinued operations. For the three and six months ending June 30, 2017, revenues related to discontinued operations were $336 million and $660 million, respectively (2016 – $261 million and $515 million, respectively). The comparative periods have been restated to reflect discontinued operations.

(2)

Additional subtotal found in Note 1 and Note 8 of the interim Consolidated Financial Statements and defined in this MD&A.

(3)

Non-GAAP measure defined in this MD&A.

(4)

Includes expenditures on PP&E, E&E assets, assets held for sale and discontinued operations.

Cenovus Energy Inc. Second Quarter 2017 Report Page 16 Management's Discussion and Analysis

slide-17
SLIDE 17

Revenues

($ millions) Three Months Ended Six Months Ended Revenues for the Periods Ended June 30, 2016 2,746 4,737 Increase (Decrease) due to: Oil Sands 924 1,489 Deep Basin 116 116 Refining and Marketing 268 1,284 Corporate and Eliminations (17) (48) Revenues for the Periods Ended June 30, 2017 4,037 7,578

Combined upstream revenues, excluding Conventional revenues, increased in the second quarter and on a year-to- date basis, compared with 2016. The increase was primarily related to an increase in sales volumes due to the Acquisition and the Foster Creek phase G and Christina Lake phase F expansion phases in our Oil Sands segment, higher commodity prices and the weakening of the Canadian dollar relative to the U.S. dollar. These increases were partially offset by a rise in royalties. Conventional revenues have been reported in net earnings from discontinued

  • perations and are discussed below.

Revenues from our Refining and Marketing segment in the three and six months ended June 30, 2017 increased 13 percent and 35 percent, respectively. Refining revenues rose due to the increase in refined product pricing, consistent with higher average Chicago refined product benchmark prices and the weakening of the Canadian dollar relative to the U.S. dollar. The rise was partially offset by decreased refined product output. Revenues from third-party crude oil and natural gas sales undertaken by the marketing group increased in the three and six months ended June 30, 2017 compared with 2016. In the second quarter, the increase was primarily due to higher crude oil and natural gas sales prices, partially offset by a decrease in purchased crude oil, natural gas and condensate volumes. On a year-to-date basis, the rise in marketing revenues was due to higher crude oil and natural gas sales prices and an increase in purchased crude oil and condensate volumes, partially offset by a decline in natural gas volumes. Corporate and Eliminations revenues relate to sales and operating revenues between segments and are recorded at transfer prices based on current market prices. We intend to divest all of our legacy Conventional assets. As such, our Conventional segment has been classified as a discontinued operation. For the three and six months ended June 30, 2017, Conventional revenues were $336 million and $660 million, respectively. The increase in revenues compared with 2016 was primarily due to higher commodity prices and the weakening of the Canadian dollar relative to the U.S. dollar. These increases were partially offset by a rise in royalties. Further information regarding our revenues can be found in the Reportable Segments section of this MD&A. Operating Margin Operating Margin is an additional subtotal found in Note 1 and Note 8 of the interim Consolidated Financial Statements and is used to provide a consistent measure of the cash generating performance of our assets for comparability of our underlying financial performance between periods. Operating Margin is defined as revenues less purchased product, transportation and blending, operating expenses, production and mineral taxes plus realized gains less realized losses on risk management activities. Items within the Corporate and Eliminations segment are excluded from the calculation of Operating Margin. Total Operating Margin

Three Months Ended June 30, Six Months Ended June 30, ($ millions) 2017 2016 2017 2016 Revenues 4,479 3,096 8,442 5,408 (Add) Deduct: Purchased Product 2,183 1,712 4,513 3,140 Transportation and Blending 943 440 1,560 891 Operating Expenses 579 393 1,048 845 Production and Mineral Taxes 5 3 10 5 Realized (Gain) Loss on Risk Management Activities (9) 7 83 (158) Total Operating Margin (1) 778 541 1,228 685

(1)

Includes results from our Conventional segment, which has been classified as a discontinued operation.

Cenovus Energy Inc. Second Quarter 2017 Report Page 17 Management's Discussion and Analysis

slide-18
SLIDE 18

Three Months Ended June 30, 2017 Compared With June 30, 2016 Total Operating Margin increased 44 percent in the second quarter of 2017 compared with 2016 primarily due to:  A 72 percent increase in our liquids sales volumes as well as a 55 percent rise in our natural gas sales volumes, primarily related to the Acquisition and our recent oil sands expansion phases; and  Our average liquids sales price rising 22 percent and our average natural gas sales price increasing 84 percent, consistent with higher associated benchmark prices and the increase in diversity of products with higher light and medium crude oil and NGLs being produced by our Deep Basin Assets. These increases in Operating Margin were partially offset by:  A rise in transportation and blending expenses due to higher blending costs, related to an increase in condensate volumes required for blending our increased oil sands production along with higher condensate prices;  An increase in operating expenses primarily due to the Acquisition, higher fuel costs as a result of an increase in natural gas prices, and a rise in repairs and maintenance activities primarily related to the planned turnaround at Foster Creek that was in line with budget;  Lower Operating Margin from Refining and Marketing due to narrowing heavy crude oil differentials and a decline in average market crack spreads, partially offset by lower realized risk management losses;  Higher royalties primarily due to an increase in the WTI benchmark price (which determines the royalty rate), a rise in our liquids sales price, and an increase in sales volumes due to the Acquisition; and  Realized risk management gains of $11 million, associated with our upstream assets, compared with gains of $35 million in the second quarter of 2016. Total Operating Margin Variance

(1)

Other includes the value of condensate sold as heavy oil blend recorded in revenues and condensate costs recorded in transportation and blending

  • expense. The crude oil price excludes the impact of condensate purchases.

544 55 159 20 231

  • 117

193 100 200 300 400 500 600 Oil Sands Deep Basin Conventional Refining and Marketing ($ millions)

Total Operating Margin by Segment

Q2 2017 Q2 2016

778 24 58 176 173 96 302 462 541 200 400 600 800 1,000 1,200 1,400 1,600 Three Months Ended June 30, 2016 Upstream Price Upstream Volumes Upstream Realized Risk Management Royalties Upstream Operating Expenses Refining and Marketing Operating Margin Other (1) Three Months Ended June 30, 2017 ($ millions)

Cenovus Energy Inc. Second Quarter 2017 Report Page 18 Management's Discussion and Analysis

slide-19
SLIDE 19

Six Months Ended June 30, 2017 Compared With June 30, 2016 Operating Margin increased 79 percent in the first six months of 2017 compared with 2016 primarily due to:  Our average liquids sales price increasing 67 percent and our average natural gas sales price rising 50 percent, consistent with higher associated benchmark prices and the increase in diversity of products with higher light and medium crude oil and NGLs being produced by

  • ur Deep Basin Assets; and

 A 41 percent increase in our liquids sales volumes as well as a 22 percent rise in our natural gas sales volumes, primarily related to the Acquisition and our recent oil sand expansion phases. These increases to Operating Margin were partially offset by:  A rise in transportation and blending expenses due to higher blending costs, related to an increase in condensate volumes required for blending our increased oil sands production along with higher condensate prices;  Realized risk management losses of $79 million, associated with our upstream assets, compared with gains of $180 million in 2016;  An increase in operating expenses primarily due to the Acquisition and higher fuel costs related to the increase in natural gas pricing;  Higher royalties primarily due to an increase in the WTI benchmark price (which determines the royalty rate), a rise in our liquids sales price, and an increase in sales volumes due to the Acquisition; and  Lower Operating Margin from Refining and Marketing due to narrowing heavy crude oil differentials, a decline in crude utilization rates and higher operating costs related to the larger scope of turnaround activities in the first quarter, and lower margins on the sale of secondary products. Total Operating Margin Variance

(1)

Other includes the value of condensate sold as heavy oil blend recorded in revenues and condensate costs recorded in transportation and blending

  • expense. The crude oil price excludes the impact of condensate purchases.

Additional details explaining the changes in Operating Margin can be found in the Reportable Segments section of this MD&A.

796 55 304 73 276

  • 239

170 200 400 600 800 1,000 Oil Sands Deep Basin Conventional Refining and Marketing ($ millions)

Total Operating Margin by Segment

YTD 2017 YTD 2016

1,228 259 115 177 97 118 921 388 685 500 1,000 1,500 2,000 2,500 Six Months Ended June 30, 2016 Upstream Price Upstream Volumes Upstream Realized Risk Management Royalties Upstream Operating Expenses Refining and Marketing Operating Margin Other (1) Six Months Ended June 30, 2017 ($ millions)

Cenovus Energy Inc. Second Quarter 2017 Report Page 19 Management's Discussion and Analysis

slide-20
SLIDE 20

Operating Margin From Continuing Operations Operating Margin From Continuing Operations excludes results from our Conventional segment, which has been classified as a discontinued operation.

Three Months Ended June 30, Six Months Ended June 30, ($ millions) 2017 2016 2017 2016 Revenues 4,143 2,835 7,782 4,893 (Add) Deduct: Purchased Product 2,183 1,712 4,513 3,140 Transportation and Blending 889 395 1,455 799 Operating Expenses 464 286 823 616 Production and Mineral Taxes

  • Realized (Gain) Loss on Risk Management Activities

(12) 18 67 (108) Operating Margin From Continuing Operations 619 424 924 446

Cash From Operating Activities and Adjusted Funds Flow Adjusted Funds Flow is a non-GAAP measure commonly used in the oil and gas industry to assist in measuring a company’s ability to finance its capital programs and meet its financial obligations. Adjusted Funds Flow is defined as Cash From Operating Activities excluding net change in other assets and liabilities and net change in non-cash working capital. Net change in other assets and liabilities is composed of site restoration costs and pension funding. Non-cash working capital is composed of current assets and current liabilities, excluding cash and cash equivalents and risk management. Total Cash From Operating Activities and Adjusted Funds Flow

Three Months Ended June 30, Six Months Ended June 30, ($ millions) 2017 2016 2017 2016 Cash From Operating Activities (1) 1,239 205 1,567 387 (Add) Deduct: Net Change in Other Assets and Liabilities (25) (17) (56) (46) Net Change in Non-Cash Working Capital 472 (218) 508 (33) Adjusted Funds Flow (1) 792 440 1,115 466

(1)

Includes results from our Conventional segment, which has been classified as a discontinued operation.

In the three and six months ended June 30, 2017, Cash From Operating Activities and Adjusted Funds Flow increased primarily as a result of higher Operating Margin, as discussed above, a realized risk management gain on foreign exchange contracts due to hedging activity undertaken to support the Acquisition, and a higher current tax recovery, partially offset by higher finance costs primarily associated with additional debt incurred to finance the Acquisition. The change in non-cash working capital for the three months ended June 30, 2017 was primarily due to a decline in accounts receivable, partially offset by an increase in income tax receivable. For the three months ended June 30, 2016, the change in non-cash working capital was primarily due to an increase in accounts receivable, partially

  • ffset by a rise in accounts payable.

The change in non-cash working capital for the six months ended June 30, 2017 was primarily due to a decline in accounts receivable, partially offset by an increase in income tax receivable. For the six months ended June 30, 2016, the change in non-cash working capital was primarily due to an increase in accounts receivable and a rise in inventory, partially offset by an increase in accounts payable. Cash From Operating Activities From Continuing Operations and Adjusted Funds Flow From Continuing Operations Cash From Operating Activities From Continuing Operations and Adjusted Funds Flow From Continuing Operations excludes results from our Conventional segment, which has been classified as a discontinued operation.

Three Months Ended June 30, Six Months Ended June 30, ($ millions) 2017 2016 2017 2016 Cash From Operating Activities From Continuing Operations 1,102 121 1,297 215 (Add) Deduct: Net Change in Other Assets and Liabilities (20) (13) (44) (39) Net Change in Non-Cash Working Capital 472 (218) 508 (33) Adjusted Funds Flow From Continuing Operations 650 352 833 287

Cenovus Energy Inc. Second Quarter 2017 Report Page 20 Management's Discussion and Analysis

slide-21
SLIDE 21

Operating Earnings (Loss) Operating Earnings (Loss) is a non-GAAP measure used to provide a consistent measure of the comparability of our underlying financial performance between periods by removing non-operating items. Operating Earnings (Loss) is defined as Earnings (Loss) Before Income Tax excluding gain (loss) on discontinuance, revaluation gain, gain on bargain purchase, unrealized risk management gains (losses) on derivative instruments, unrealized foreign exchange gains (losses) on translation of U.S. dollar denominated notes issued from Canada, foreign exchange gains (losses) on settlement of intercompany transactions, gains (losses) on divestiture of assets, less income taxes on Operating Earnings (Loss) before tax, excluding the effect of changes in statutory income tax rates and the recognition of an increase in U.S. tax basis. Total Operating Earnings

Three Months Ended June 30, Six Months Ended June 30, ($ millions) 2017 2016 2017 2016 Earnings (Loss), Before Income Tax (1) 3,342 (348) 3,602 (683) Add (Deduct): Unrealized Risk Management (Gain) Loss (2) (132) 284 (411) 433 Non-Operating Unrealized Foreign Exchange (Gain) Loss (3) (279) 18 (335) (395) Revaluation (Gain) (2,524)

  • (2,524)
  • (Gain) Loss on Divestiture of Assets
  • 1

1 1 Operating Earnings (Loss), Before Income Tax 407 (45) 333 (644) Income Tax Expense (Recovery) 9 (6) (26) (182) Operating Earnings (Loss) 398 (39) 359 (462)

(1)

Includes discontinued operations.

(2)

Includes the reversal of unrealized (gains) losses recorded in prior periods.

(3)

Includes unrealized foreign exchange (gains) losses on translation of U.S. dollar denominated notes issued from Canada and foreign exchange (gains) losses on settlement of intercompany transactions.

Operating Earnings increased in the three and six months ended June 30, 2017 compared with 2016 primarily due to higher Cash from Operating Activities and Adjusted Funds Flow, as discussed above, unrealized foreign exchange gains related to operating activities as compared with losses in 2016, and the re-measurement of the contingent

  • payment. In the three months ended June 30, 2017, the increase in Operating Earnings was partially offset by an

increase in DD&A. On a year-to-date basis, DD&A declined slightly improving Operating Earnings. Operating Earnings From Continuing Operations Operating Earnings From Continuing Operations excludes results from our Conventional segment, which has been classified as a discontinued operation.

Three Months Ended June 30, Six Months Ended June 30, ($ millions) 2017 2016 2017 2016 Earnings (Loss) From Continuing Operations, Before Income Tax 3,263 (296) 3,523 (406) Add (Deduct): Unrealized Risk Management (Gain) Loss (1) (132) 284 (411) 433 Non-Operating Unrealized Foreign Exchange (Gain) Loss (2) (279) 18 (335) (395) Revaluation (Gain) (2,524)

  • (2,524)
  • (Gain) Loss on Divestiture of Assets
  • 1

1 1 Operating Earnings (Loss) From Continuing Operations, Before Income Tax 328 7 254 (367) Income Tax Expense (Recovery) (16) 10 (51) (95) Operating Earnings (Loss) From Continuing Operations 344 (3) 305 (272)

(1)

Includes the reversal of unrealized (gains) losses recorded in prior periods.

(2)

Includes unrealized foreign exchange (gains) losses on translation of U.S. dollar denominated notes issued from Canada and foreign exchange (gains) losses on settlement of intercompany transactions.

Cenovus Energy Inc. Second Quarter 2017 Report Page 21 Management's Discussion and Analysis

slide-22
SLIDE 22

Net Earnings

($ millions) Three Months Ended Six Months Ended Net Earnings (Loss) for the Periods Ended June 30, 2016 (267) (385) Increase (Decrease) due to: Operating Margin From Continuing Operations 195 478 Corporate and Eliminations: Unrealized Risk Management Gain (Loss) 416 844 Unrealized Foreign Exchange Gain (Loss) 414 77 Revaluation (Gain) 2,524 2,524 Re-measurement of Contingent Payment 66 66 Gain (Loss) on Divestiture of Assets 1

  • Expenses (1)

105 123 DD&A (162) (184) Exploration Expense

  • 1

Income Tax Recovery (Expense) (747) (942) Earnings From Discontinued Operations, Net of Tax 95 249 Net Earnings (Loss) for the Periods Ended June 30, 2017 2,640 2,851

(1)

Includes realized risk management (gains) losses, general and administrative, finance costs, interest income, realized foreign exchange (gains) losses, transaction costs, research costs, other (income) loss, net and Corporate and Eliminations revenues, purchased product, transportation and blending, and operating expenses.

Net Earnings for the three months ended June 30, 2017 increased primarily due to:  A revaluation gain of $2,524 million related to the deemed disposition of our pre-existing interest in FCCL. See the Corporate and Eliminations or the Oil Sands and Deep Basin Acquisition sections of this MD&A for more details;  Higher Operating Earnings, as discussed above;  Unrealized risk management gains of $132 million in the quarter compared with unrealized losses of $284 million in the second quarter of 2016; and  Non-operating unrealized foreign exchange gains of $279 million related to the translation of our U.S. dollar denominated debt compared with unrealized losses of $18 million in 2016. These decreases were partially offset by higher deferred income tax expense in 2017 primarily due to the gain on the revaluation of our pre-existing partnership interest in FCCL in connection with the Acquisition compared with a deferred tax recovery in 2016. Net Earnings improved for the six months ended June 30, 2017 primarily due to the revaluation gain, unrealized risk management gains of $411 million compared with unrealized losses of $433 million in 2016, and higher Operating Earnings, as discussed above. These increases were partially offset by a deferred income tax expense compared with a deferred income tax recovery in 2016 and non-operating unrealized foreign exchange gains of $335 million compared with unrealized gains of $395 million in 2016. Net Capital Investment

Three Months Ended June 30, Six Months Ended June 30, ($ millions) 2017 2016 2017 2016 Oil Sands 215 139 387 366 Deep Basin 13

  • 13
  • Conventional

50 34 138 73 Refining and Marketing 40 53 86 105 Corporate and Eliminations 9 10 16 15 Capital Investment 327 236 640 559 Acquisitions (1) 29,835 11 29,835 11 Divestitures (1) (9,081)

  • (9,081)
  • Net Capital Investment (2)

21,081 247 21,394 570

(1)

In connection with the Acquisition, Cenovus was deemed to have disposed of its pre-existing interest in FCCL and re-acquired it at fair value as required by IFRS 3.

(2)

Includes expenditures on PP&E, E&E assets, assets held for sale and discontinued operations.

Cenovus Energy Inc. Second Quarter 2017 Report Page 22 Management's Discussion and Analysis

slide-23
SLIDE 23

Capital investment in the three months and six months ended June 30, 2017 increased 39 percent and 14 percent, respectively compared to 2016. In the first half of 2017, Oil Sands capital investment focused primarily on sustaining capital related to existing production; stratigraphic test wells to determine pad placement for sustaining wells, near-term expansion phases, and progression of certain emerging assets; and for Christina Lake expansion phase G. Deep Basin capital investment in the first 45 days of ownership focused on asset development planning and the commencement of our drilling program. Drilling activity will be focused on drilling horizontal production wells targeting liquids rich gas in the Deep Basin corridor. In the first half of 2017, Conventional capital investment focused on sustaining capital and the tight oil drilling program in southern Alberta. Capital investment in the Refining and Marketing segment focused on capital maintenance and reliability work. Further information regarding our capital investment can be found in the Reportable Segments section of this MD&A. Capital Investment Decisions We are intently focused on completing divestitures of our legacy Conventional assets in order to deleverage our balance sheet. Repaying the committed Bridge Facility is our number one priority. Our disciplined approach to long-term capital allocation includes prioritizing our uses of cash in the following manner:  First, to sustaining and maintenance capital for our existing business operations;  Second, to paying our current dividend as part of providing strong total shareholder return; and  Third, for growth or discretionary capital. Our approach to capital allocation includes evaluating all opportunities using specific rigorous criteria with the

  • bjective of maintaining a prudent and flexible capital structure and strong balance sheet metrics, which position

us to be financially resilient in times of lower cash flows. In addition, we continue to evaluate other corporate and financial opportunities, including generating cash from our existing portfolio. Refer to the Liquidity and Capital Resources section of this MD&A for further information.

Three Months Ended June 30, Six Months Ended June 30, ($ millions) 2017 2016 2017 2016 Adjusted Funds Flow (1) 792 440 1,115 466 Capital Investment (Sustaining and Growth) 327 236 640 559 Free Funds Flow (1) (2) 465 204 475 (93) Cash Dividends 61 42 102 83 404 162 373 (176)

(1)

Includes discontinued operations.

(2)

Free Funds Flow is a non-GAAP measure defined as Adjusted Funds Flow less capital investment.

Upon further review of our capital program following our June 20, 2017 news release, we updated our 2017 guidance estimates, including future capital investment, as cost savings opportunities have been identified. We now expect to spend between $1.6 billion and $1.8 billion. Guidance has decreased from June 20, 2017 by approximately 11 percent. In the first half of 2016, capital investment in excess of Adjusted Funds Flow was funded through our cash balance

  • n hand.

Cenovus Energy Inc. Second Quarter 2017 Report Page 23 Management's Discussion and Analysis

slide-24
SLIDE 24

REPORTABLE SEGMENTS

Our reportable segments are as follows: Oil Sands, which includes the development and production of bitumen and natural gas in northeast

  • Alberta. Cenovus’s bitumen assets include Foster

Creek, Christina Lake and Narrows Lake as well as projects in the early stages of development, such as Telephone Lake. Our interest in certain of our

  • perated oil sands properties, notably Foster Creek,

Christina Lake and Narrows Lake increased from 50 percent to 100 percent on May 17, 2017. Deep Basin, which includes approximately three million net acres of land primarily in the Elmworth- Wapiti, Kaybob-Edson, and Clearwater operating areas, rich in natural gas and natural gas liquids. The assets reside in Alberta and British Columbia and include interests in numerous natural gas processing facilities. The Deep Basin Assets were acquired on May 17, 2017. Conventional, which has been classified as a discontinued operation as we have commenced marketing for sale our Conventional assets. This segment includes the development and production

  • f conventional crude oil, NGLs and natural gas in

Alberta and Saskatchewan, including the heavy oil assets at Pelican Lake, the CO2 enhanced oil recovery project at Weyburn and emerging tight oil

  • pportunities.

Refining and Marketing, which is responsible for transporting, selling and refining crude oil into petroleum and chemical products. Cenovus jointly owns two refineries in the U.S. with the operator Phillips 66, an unrelated U.S. public company. In addition, Cenovus owns and operates a crude-by-rail terminal in Alberta. This segment coordinates Cenovus’s marketing and transportation initiatives to optimize product mix, delivery points, transportation commitments and customer diversification. Corporate and Eliminations, which primarily includes unrealized gains and losses recorded on derivative financial instruments, gains and losses on divestiture of assets, as well as other Cenovus-wide costs for general and administrative, financing activities and research costs. As financial instruments are settled, the realized gains and losses are recorded in the reportable segment to which the derivative instrument relates. Eliminations relate to sales and operating revenues, and purchased product between segments, recorded at transfer prices based on current market prices, and to unrealized intersegment profits in inventory. Revenues by Reportable Segment (1)

Three Months Ended June 30, Six Months Ended June 30, ($ millions) 2017 2016 2017 2016 Oil Sands (2) 1,630 706 2,665 1,176 Deep Basin (3) 116

  • 116
  • Refining and Marketing

2,397 2,129 5,001 3,717 Corporate and Eliminations (106) (89) (204) (156) 4,037 2,746 7,578 4,737

(1)

In the first quarter of 2017, we announced the sale of certain assets, including our Pelican Lake and Suffield assets, as part of our plan to repay the committed Bridge Facility associated with the Acquisition. In the second quarter of 2017, we announced our intention to divest the remaining Conventional segment assets, including our Palliser and Weyburn assets. The Conventional segment has been classified as a discontinued operation. For the three and six months ending June 30, 2017, revenues related to discontinued operations were $336 million and $660 million, respectively (2016 – $261 million and $515 million, respectively).

(2)

Our second quarter results include 45 days of FCCL operations at 100 percent interest from May 17, 2017 until June 30, 2017. See the Oil Sands and Deep Basin Acquisition section and the Oil Sands segment section of this MD&A for more details.

(3)

Our second quarter results include 45 days of operations from the Deep Basin Assets from May 17, 2017 until June 30, 2017. See the Oil Sands and Deep Basin Acquisition section and the Deep Basin segment section of this MD&A for more details.

Cenovus Energy Inc. Second Quarter 2017 Report Page 24 Management's Discussion and Analysis

slide-25
SLIDE 25

OIL SANDS

In northeastern Alberta, we now own 100 percent of the Foster Creek, Christina Lake and Narrows Lake oil sands projects following the completion of the Acquisition. We have several emerging projects in the early stages of development, including our 100 percent-owned project at Telephone Lake. The Oil Sands segment also includes the Athabasca natural gas property, from which a portion of the natural gas production is used as fuel at the adjacent Foster Creek operations. Significant developments in our Oil Sands segment in the second quarter of 2017 compared with 2016 include:  Increasing our ownership of FCCL from 50 percent to 100 percent upon closing of the Acquisition on May 17, 2017;  Increasing crude oil production by 84 percent due to the Acquisition and incremental production volumes from Foster Creek phase G and Christina Lake phase F, both of which started-up in the second half of 2016;  Crude oil netbacks, excluding realized risk management activities, of $22.34 per barrel, a 55 percent increase from the second quarter of 2016; and  Generating Operating Margin net of capital investment of $329 million, an increase of $237 million. Oil Sands – Crude Oil Three Months Ended June 30, 2017 Compared With June 30, 2016 Financial Results

Three Months Ended June 30, ($ millions) 2017 2016 Gross Sales 1,661 707 Less: Royalties 36 3 Revenues 1,625 704 Expenses Transportation and Blending 879 395 Operating 218 101 (Gain) Loss on Risk Management (14) (24) Operating Margin 542 232 Capital Investment 215 138 Operating Margin Net of Related Capital Investment 327 94

Operating Margin Variance

(1)

Revenues include the value of condensate sold as heavy oil blend. Condensate costs are recorded in transportation and blending expense. The crude oil price excludes the impact of condensate purchases.

Revenues Price In the second quarter of 2017, our average crude oil sales price increased significantly to $39.73 per barrel (2016 – $30.59 per barrel). The rise in our crude oil price was consistent with the increase in the WCS and Christina Dilbit Blend (“CDB”) benchmark prices, the narrowing of the WCS-Condensate differential, and the weakening of the Canadian dollar relative to the U.S. dollar. The WCS-CDB differential narrowed to a discount of US$1.53 per barrel (2016 – discount of US$2.64 per barrel). Our crude oil sales price is influenced by the cost of condensate used in blending. Our blending ratios range between 25 percent and 33 percent. As the cost of condensate increases relative to the price of blended crude oil,

  • ur bitumen sales price decreases. Due to high demand for condensate at Edmonton, we also purchase condensate

from U.S. markets. As such, our average cost of condensate is generally higher than the Edmonton benchmark

232 542 10 33 484 117 216 341 397 200 400 600 800 1,000 1,200 1,400 1,600 Three Months Ended June 30, 2016 Price (1) Volume Condensate Revenue (1) Realized Risk Management Royalties Transportation and Blending (1) Operating Expenses Three Months Ended, June 30, 2017

($ millions)

Cenovus Energy Inc. Second Quarter 2017 Report Page 25 Management's Discussion and Analysis

slide-26
SLIDE 26

price due to transportation between market hubs and transportation to field locations. In addition, up to three months may elapse from when we purchase condensate to when we blend it with our production. In a rising price environment, we expect to see some benefit in our bitumen sales price as we are using condensate purchased at a lower price earlier in the year. Production Volumes

Three Months Ended June 30, (barrels per day) 2017 Percent Change 2016 Foster Creek 107,859 67% 64,544 Christina Lake 153,953 97% 78,060 261,812 84% 142,604

Production at Foster Creek was higher compared with 2016 primarily due to the Acquisition and incremental production volumes from the phase G expansion, partially offset by the impact of a 20-day planned turnaround, including ramp down and ramp up, at Foster Creek. The total increase in production volumes related to the Acquisition in the three months ended June 30, 2017 was 36,534 barrels per day. The impact of the planned turnaround was approximately 11,073 barrels per day in the second quarter of 2017. Production from Christina Lake increased in the three months ended June 30, 2017 primarily due to the Acquisition and incremental production volumes from the phase F expansion. The total increase in production volumes related to the Acquisition in the three months ended June 30, 2017 was 51,709 barrels per day. Condensate The bitumen currently produced by Cenovus must be blended with condensate to reduce its thickness in order to transport it to market through pipelines. Revenues represent the total value of blended crude oil sold and include the value of condensate. Consistent with the narrowing of the WCS-Condensate differential during the second quarter, the proportion of the cost of condensate recovered increased. The amount of condensate used increased as a result of the Acquisition. Royalties Royalty calculations for our oil sands projects are based on government prescribed pre- and post-payout royalty rates which are determined on a sliding scale using the Canadian dollar equivalent WTI benchmark price. Royalty calculations differ between properties. Royalties at Foster Creek, a post-payout project, are based on an annualized calculation which uses the greater of: (1) the gross revenues multiplied by the applicable royalty rate (one to nine percent, based on the Canadian dollar equivalent WTI benchmark price); or (2) the net profits of the project multiplied by the applicable royalty rate (25 to 40 percent, based on the Canadian dollar equivalent WTI benchmark price). Gross revenues are a function of sales volumes and sales prices. Net profits are a function of sales volumes, sales prices and allowed operating and capital costs. In the three months ended June 30, 2017, our royalty calculation was based on net profits as compared with a calculation based on gross revenues for 2016. Royalties at Christina Lake, a pre-payout project, are based on a monthly calculation that applies a royalty rate (ranging from one to nine percent, based on the Canadian dollar equivalent WTI benchmark price) to the gross revenues from the project. Effective Royalty Rates

Three Months Ended June 30, (percent) 2017 2016 Foster Creek 7.3 1.0 Christina Lake 2.6 1.2

Royalties increased $33 million in the second quarter compared with 2016, primarily due to an increase in the WTI benchmark price (which determines the royalty rate). Expenses Transportation and Blending Transportation and blending costs increased $484 million. Blending costs increased due to a rise in condensate volumes required for our increased production along with higher condensate prices. Our condensate costs were higher than the average Edmonton benchmark price in the second quarter, primarily due to the transportation expense associated with moving the condensate between market hubs and to our oil sands projects. Cenovus Energy Inc. Second Quarter 2017 Report Page 26 Management's Discussion and Analysis

slide-27
SLIDE 27

Transportation costs increased primarily due to higher sales volumes due to the Acquisition and ramp up of the expansion phases. To help ensure adequate capacity for our expected production growth, we have capacity commitments in excess of our current production. Production growth is expected to reduce our per-barrel transportation costs. In addition, rail costs rose as a result of moving higher volumes by rail in the second quarter compared with 2016. We transported an average of 8,280 barrels per day of crude oil by rail (2016 – 5,405 barrels per day). Per-unit Transportation Expenses At Foster Creek, per-barrel transportation costs declined $1.00 per barrel and at Christina Lake transportation costs declined $0.80 per barrel. The decreases were primarily due to an increase in sales volumes and an increase in the proportion of Canadian to U.S. sales resulting in lower costs associated with pipeline tariffs. The decline at Foster Creek was partially offset by an increase in rail costs related to an increase in volumes shipped via unit trains. Operating Primary drivers of our operating expenses for the second quarter were workforce, fuel, repairs and maintenance, and chemical costs. Total operating expenses increased $117 million primarily due to the Acquisition, increased fuel costs with the rise in natural gas prices, and higher repairs and maintenance primarily due to the turnaround at Foster Creek. Per-unit Operating Expenses

Three Months Ended June 30, ($/bbl) 2017 Percent Change 2016 Foster Creek Fuel 2.89 76% 1.64 Non-fuel 9.42 11% 8.51 Total 12.31 21% 10.15 Christina Lake Fuel 2.38 68% 1.42 Non-fuel 4.66 (5)% 4.93 Total 7.04 11% 6.35 Total 9.19 14% 8.06

At Foster Creek, per-barrel fuel costs rose compared with 2016 primarily due to higher natural gas prices. Non-fuel

  • perating expenses increased on a per-barrel basis primarily due to higher repairs and maintenance, and fluid and

waste handling and trucking costs related to turnaround activities, partially offset by higher production. At Christina Lake, fuel costs increased on a per-barrel basis in 2017 primarily due to higher natural gas prices. Non-fuel operating expenses declined due to higher production, partially offset by an increase in workforce and chemical costs related to phase F. Netbacks (1)

Foster Creek Christina Lake Three Months Ended June 30, ($/bbl) 2017 2016 2017 2016 Sales Price 44.38 33.40 36.54 28.31 Royalties 2.49 0.23 0.85 0.28 Transportation and Blending 10.44 11.44 4.10 4.90 Operating Expenses 12.31 10.15 7.04 6.35 Netback Excluding Realized Risk Management 19.14 11.58 24.55 16.78 Realized Risk Management Gain (Loss) 1.01 1.88 0.34 1.96 Netback Including Realized Risk Management 20.15 13.46 24.89 18.74

(1)

Netbacks reflect our margin on a per-barrel basis of unblended crude oil.

Risk Management Risk management activities in the second quarter resulted in realized gains of $14 million (2016 – realized gains of $24 million), consistent with our contract prices exceeding average benchmark prices. Cenovus Energy Inc. Second Quarter 2017 Report Page 27 Management's Discussion and Analysis

slide-28
SLIDE 28

Six Months Ended June 30, 2017 Compared With June 30, 2016 Financial Results

Six Months Ended June 30, ($ millions) 2017 2016 Gross Sales 2,716 1,172 Less: Royalties 63 3 Revenues 2,653 1,169 Expenses Transportation and Blending 1,445 799 Operating 354 223 (Gain) Loss on Risk Management 63 (130) Operating Margin 791 277 Capital Investment 384 365 Operating Margin Net of Related Capital Investment 407 (88)

In 2016, capital investment in excess of Operating Margin from Oil Sands was funded through Operating Margin generated by our Conventional and Refining and Marketing segments, as well as our cash balance on hand. Operating Margin Variance

(1)

Revenues include the value of condensate sold as heavy oil blend. Condensate costs are recorded in transportation and blending expense. The crude oil price excludes the impact of condensate purchases.

Revenues Price In the six months ended June 30, 2017, our average crude oil sales price increased significantly to $39.09 per barrel (2016 – $20.28 per barrel). The significant rise in our crude oil price was consistent with the increase in the WCS and Christina Dilbit Blend (“CDB”) benchmark prices, the narrowing of the WCS-Condensate differential, and the weakening of the Canadian dollar relative to the U.S. dollar. The WCS-CDB differential narrowed to a discount

  • f US$1.66 per barrel (2016 – discount of US$2.30 per barrel).

Production Volumes

Six Months Ended June 30, (barrels per day) 2017 Percent Change 2016 Foster Creek 94,437 51% 62,713 Christina Lake 127,442 64% 77,577 221,879 58% 140,290

Production at Foster Creek was higher compared with 2016 due to incremental production volumes from the phase G expansion and the Acquisition, partially offset by the impact of a 20-day planned turnaround at Foster Creek. Production from Christina Lake increased in the six months ended June 30, 2017 primarily due to the Acquisition and incremental production volumes from the phase F expansion. The total increase in production volumes related to the Acquisition in the six months ended June 30, 2017 was 18,453 barrels per day and 25,998 barrels per day for Foster Creek and Christina Lake, respectively. The impact of the Foster Creek turnaround was approximately 5,567 barrels per day in 2017.

277 791 193 60 646 131 730 274 540 200 400 600 800 1,000 1,200 1,400 1,600 1,800 2,000 Six Months Ended June 30, 2016 Price (1) Volume Condensate Revenue (1) Realized Risk Management Royalties Transportation and Blending (1) Operating Expenses Six Months Ended June 30, 2017

($ millions)

Cenovus Energy Inc. Second Quarter 2017 Report Page 28 Management's Discussion and Analysis

slide-29
SLIDE 29

Royalties Effective Royalty Rates

Six Months Ended June 30, (percent) 2017 2016 Foster Creek 7.8 0.3 Christina Lake 2.6 1.2

Royalties increased $60 million. On a year-to-date basis, our Foster Creek royalty calculation was based on net profits as compared with a calculation based on gross revenues in 2016. Our royalties at Foster Creek increased primarily due to an increase in the WTI benchmark price (which determines the royalty rate). In 2016, the low royalty rate was primarily due to low crude oil sales prices and a true-up of the 2015 royalty calculation. Christina Lake royalties increased in 2017 primarily as a result of a rise in the WTI benchmark price (which determines the royalty rate) and higher sales prices. Expenses Transportation and Blending Transportation and blending costs increased $646 million. Blending costs increased due to a rise in condensate volumes required for our increased production along with higher condensate prices. Our condensate costs were higher than the average Edmonton benchmark price in the six months ended June 30, 2017, primarily due to the transportation expense associated with moving the condensate between market hubs and to our oil sands projects. Transportation costs increased primarily due to higher sales volumes related to the ramp up of the expansion phases and the Acquisition. In addition, rail costs rose as a result of moving higher volumes by rail compared with 2016. We transported an average of 9,370 barrels per day of crude oil by rail (2016 – 3,859 barrels per day). Per-unit Transportation Expenses At Foster Creek, per-barrel transportation costs declined $0.80 per barrel and at Christina Lake transportation costs declined $0.99 per barrel. The decreases were primarily due to an increase in sales volumes and an increase in the proportion of Canadian to U.S. sales resulting in lower costs associated with pipeline tariffs. The decline at Foster Creek was partially offset by an increase in rail costs related to an increase in volumes shipped via unit trains. Operating Primary drivers of our operating expenses in the first half of 2017 were workforce, fuel, repairs and maintenance, workovers, and chemicals. Total operating expenses increased $131 million primarily due to increased fuel costs with the rise in natural gas prices, the Acquisition, and higher repairs and maintenance primarily due to the turnaround at Foster Creek. Per-unit Operating Expenses

Six Months Ended June 30, ($/bbl) 2017 Percent Change 2016 Foster Creek Fuel 2.91 42% 2.05 Non-fuel 8.42 (7)% 9.04 Total 11.33 2% 11.09 Christina Lake Fuel 2.45 44% 1.70 Non-fuel 4.97 (6)% 5.30 Total 7.42 6% 7.00 Total 9.10 4% 8.79

At Foster Creek, per-barrel fuel costs increased primarily due to the rise in natural gas prices. Per-barrel non-fuel

  • perating expenses declined primarily due to higher production and a true-up of the 2016 emissions charge under

the Specified Gas Emitters Regulation (“SGER”), partially offset by higher repairs and maintenance, fluid and waste handling and trucking costs related to turnaround activities, an increase in workover costs due to a higher number

  • f pump changes, and higher electrical consumption.

At Christina Lake, fuel costs rose on a per-barrel basis due to higher natural gas prices. Per-barrel non-fuel

  • perating expenses decreased primarily due to higher production, partially offset by a true-up of the 2016

emissions charged under the SGER, and an increase in workforce and chemical costs related to phase F. Christina Lake’s emissions are below the threshold set by the SGER program and generate performance credits which are applied to the charges incurred at Foster Creek. Cenovus Energy Inc. Second Quarter 2017 Report Page 29 Management's Discussion and Analysis

slide-30
SLIDE 30

Netbacks (1)

Foster Creek Christina Lake Six Months Ended June 30, ($/bbl) 2017 2016 2017 2016 Sales Price 42.79 22.78 36.29 18.33 Royalties 2.64 0.04 0.85 0.16 Transportation and Blending 9.29 10.09 4.11 5.10 Operating Expenses 11.33 11.09 7.42 7.00 Netback Excluding Realized Risk Management 19.53 1.56 23.91 6.07 Realized Risk Management Gain (Loss) (1.84) 5.63 (1.44) 4.77 Netback Including Realized Risk Management 17.69 7.19 22.47 10.84

(1)

Netbacks reflect our margin on a per-barrel basis of unblended crude oil.

Risk Management Risk management activities in the first six months of 2017 resulted in realized losses of $63 million (2016 – realized gains of $130 million), consistent with average benchmark prices exceeding our contract prices. Oil Sands – Natural Gas Oil Sands includes our natural gas operations in northeastern Alberta. A portion of the natural gas produced from

  • ur Athabasca property is used as fuel at Foster Creek. Our natural gas production for the three and six months

ended June 30, 2017, net of internal usage, was 12 MMcf per day and 13 MMcf per day, respectively (2016 – 18 MMcf per day and 17 MMcf per day, respectively). Operating Margin from our Oil Sands natural gas production was $2 million in the second quarter (2016 – $nil) and $3 million on a year-to-date basis (2016 – $1 million), increasing primarily due to higher natural gas sales prices. Oil Sands – Capital Investment

Three Months Ended June 30, Six Months Ended June 30, ($ millions) 2017 2016 2017 2016 Foster Creek 120 68 190 157 Christina Lake 77 61 140 175 197 129 330 332 Narrows Lake 3 1 8 5 Telephone Lake 5 3 29 10 Grand Rapids 1 1 1 6 Other (1) 9 5 19 13 Capital Investment (2) 215 139 387 366

(1)

Includes new resource plays and Athabasca natural gas.

(2)

Includes expenditures on PP&E, E&E assets, and assets held for sale.

Existing Projects Capital investment reflects our 100 percent ownership of FCCL from May 17, 2017 forward. Capital investment at Foster Creek in the first half of 2017 focused on sustaining capital related to existing production and stratigraphic test wells. In 2016, capital investment remained low due to spending reductions in response to the low commodity price environment. In the first half of 2017, Christina Lake capital investment focused on sustaining capital related to existing production, the phase G expansion and stratigraphic test wells. Capital investment increased in the second quarter

  • f 2017 compared with 2016 due to our 100 percent ownership of FCCL from May 17, 2017 forward. On a year-to-

date basis, capital investment declined in 2017 due to the completion of the phase F expansion. In 2016, capital was focused on sustaining capital related to existing production, the completion of expansion phase F and stratigraphic test wells. Capital investment at Narrows Lake in the first half of 2017 focused on drilling of stratigraphic test wells to further progress the project. Capital investment remained relatively consistent in 2017 compared with 2016. Emerging Projects In the first half of 2017, Telephone Lake capital investment focused on the drilling of stratigraphic test wells to further assess the project. In 2017, Telephone Lake capital investment increased compared with 2016. In 2016, spending was reduced in response to the low commodity price environment and focused on front-end engineering work for the central processing facility. Cenovus Energy Inc. Second Quarter 2017 Report Page 30 Management's Discussion and Analysis

slide-31
SLIDE 31

Drilling Activity

Gross Stratigraphic Test Wells Gross Production Wells (1) Six Months Ended June 30, 2017 2016 2017 2016 Foster Creek 93 95 20 11 Christina Lake 98 97 8 19 191 192 28 30 Narrows Lake 2

  • Telephone Lake

13

  • Other

1 5

  • 207

197 28 30

(1)

SAGD well pairs are counted as a single producing well.

Stratigraphic test wells were drilled to help identify well pad locations for sustaining wells and near-term expansion phases and to further progress the evaluation of emerging assets. Future Capital Investment Upon further review of our capital program following our June 20, 2017 news release, we updated our 2017 guidance estimate. Our revised full year 2017 Oil Sands capital investment is forecast to be between $1,000 million and $1,120 million. Guidance has decreased from June 20, 2017 by approximately seven percent. Foster Creek is currently producing from phases A through G. Capital investment for 2017 is forecast to be between $480 million and $530 million. We plan to continue focusing on sustaining capital related to existing production and to progress phase H, a potential 40,000 barrels per day phase, towards being sanction ready. Christina Lake is producing from phases A through F. Capital investment for 2017 is forecast to be between $450 million and $500 million, focused on sustaining capital and construction of the phase G expansion, which had previously been deferred. Field construction of phase G, which has an initial design capacity of 50,000 barrels per day, resumed in the first quarter of 2017 and remains on track. Phase G is expected to start producing in late 2019. Capital investment at Narrows Lake and our new resource plays in 2017 is forecast to be between $70 million and $90 million, focusing on a stratigraphic test well programs at Telephone Lake and Narrows Lake, and engineering and equipment preservation related to the suspension of construction at Narrows Lake. DD&A and Exploration Expense We deplete crude oil and natural gas properties on a unit-of-production basis over proved reserves. The unit-of- production rate takes into account expenditures incurred to date, together with future development expenditures required to develop those proved reserves. This rate, calculated at an area level, is then applied to our sales volume to determine DD&A in a given period. We believe that this method of calculating DD&A charges each barrel

  • f crude oil equivalent sold with its proportionate share of the cost of capital invested over the total estimated life
  • f the related asset as represented by proved reserves.

The following calculation illustrates how the implied depletion rate for our total upstream assets could be determined using the reported consolidated data and includes our Conventional segment, which has been classified as held for sale. Once classified as held for sale depletion stops.

($ millions, unless otherwise indicated) As at December 31, 2016 Upstream Property, Plant and Equipment Carrying Value 11,878 Estimated Future Development Capital 18,378 Total Estimated Upstream Cost Base 30,256 Total Proved Reserves (MMBOE) 2,667 Implied Depletion Rate ($/BOE) 11.34

While this illustrates the calculation of the implied depletion rate, our depletion rates result in a total average rate ranging between $9.40 to $9.90 per BOE. Amounts related to assets under construction, assets held for sale, and discontinued operations which would be included in the total upstream cost base and would have proved reserves attributed to them, are not depleted. Property specific rates will exclude upstream assets that are depreciated on a straight-line basis. As such, our actual depletion will differ from depletion calculated by applying the above implied depletion rate. Further information on our accounting policy for DD&A is included in our notes to the December 31, 2016 Consolidated Financial Statements. In the three and six months ended June 30, 2017, Oil Sands DD&A increased $117 and $139 million, respectively, from 2016. The increase was due to higher sales volumes primarily due to the Acquisition. The average depletion rate for the first six months of 2017 was approximately $10.99 per barrel compared with $11.55 per barrel in Cenovus Energy Inc. Second Quarter 2017 Report Page 31 Management's Discussion and Analysis

slide-32
SLIDE 32
  • 2016. Our DD&A rate decreased due to proved reserves additions and lower future development costs. The

decrease in DD&A rates was partially offset by an increase in the carrying value of our assets due to the re- measurement of our pre-existing and the acquisition of the additional 50 percent interest at fair value. Future development costs declined due to cost savings at both Foster Creek and Christina Lake related to a reduction in per well costs and increased well pair spacing. This decline was partially offset by an increase in costs related to the expansion of the development area and inclusion of phase G costs at Christina Lake. There was no exploration expense recorded in 2017 (2016 – $1 million). Assets and Liabilities Held for Sale Concurrent with the announcement to acquire ConocoPhillips’ 50 percent interest in FCCL and the majority of ConocoPhillips’ Deep Basin Assets, which occurred on March 29, 2017, we commenced marketing for sale certain non-core properties. This includes our Grand Rapids project, which is adjacent to our Pelican Lake heavy oil asset. As a result, our Grand Rapids project was reclassified as assets held for sale. The assets are recorded at the lesser

  • f their carrying amount and fair value less costs to sell. The estimated fair value exceeds our carrying value.

DEEP BASIN

On May 17, 2017, we acquired the majority of ConocoPhillips’ western Canadian conventional crude oil and natural gas assets including undeveloped land, exploration and production assets, and related infrastructure in Alberta and British Columbia. Our Deep Basin Assets include approximately three million net acres of land primarily in the Elmworth-Wapiti, Kaybob-Edson, and Clearwater operating areas, with an average 70 percent working interest. In addition, the Deep Basin Assets include interests in numerous natural gas processing plants with an estimated net processing capacity of 1.4 Bcf per day. The Deep Basin Assets are expected to provide short-cycle development

  • pportunities with high return potential that complement our long-term oil sands development. Deep Basin

production is expected to provide an economic hedge for the natural gas required as a fuel source at both our oil sands and refining operations, as well as NGLs that could be used as inputs for future solvent aided oil sands projects. Our second quarter results include 45 days of operations from the Deep Basin Assets commencing May 17, 2017. The safe and efficient integration of the Deep Basin Assets is a top priority for Cenovus. We are committed to ensuring strong stakeholder and community relations as we establish ourselves as a new operator in the Deep Basin area. Significant developments that impacted our Deep Basin segment included:  Netbacks of $9.66 per BOE;  Total production from the date of acquisition averaging 119,273 BOE per day, equivalent to 58,981 BOE per day for the three months ended June 30, 2017, and 29,654 BOE per day for the six months ended June 30, 2017;  Revenues of $116 million;  Total operating costs of $51 million or $8.84 per BOE; and  Generating Operating Margin net of capital investment of $42 million. Financial Results

($ millions) May 17 – June 30, 2017 Gross Sales 124 Less: Royalties 8 Revenues 116 Expenses Transportation and Blending 10 Operating 51 Operating Margin 55 Capital Investment 13 Operating Margin Net of Related Capital Investment 42

Revenues Price

May 17 – June 30, 2017 NGLs ($/bbl) 27.22 Light and Medium Oil ($/bbl) 62.29 Natural Gas ($/mcf) 2.88 Total Oil Equivalent ($/BOE) 21.94

Cenovus Energy Inc. Second Quarter 2017 Report Page 32 Management's Discussion and Analysis

slide-33
SLIDE 33

Our Deep Basin Assets produce a diverse spectrum of products from natural gas, condensate, other NGLs (including, ethane, propane, butane and pentane) and light and medium oil. Our total oil equivalent sales price averaged $21.94 per BOE for the period ending June 30, 2017. Revenues include $6 million of processing fee revenue related to our interest in natural gas processing facilities. We do not include processing fee revenue in our per-unit pricing metrics or our netbacks. Production Volumes

Three Months Ended June 30, 2017 Six Months Ended June 30, 2017 Liquids NGLs (barrels per day) 13,835 6,956 Light and Medium Oil (barrels per day) 3,059 1,538 16,894 8,494 Natural Gas (MMcf per day) 253 127 Total Production (BOE/d) 58,981 29,654 Natural Gas Production (percentage of total) 71% 71% Liquids Production (percentage of total) 29% 29%

Total production from the date of acquisition to June 30, 2017 was 119,273 BOE per day, equivalent to 58,981 BOE per day for the three months ended June 30, 2017, and 29,654 BOE per day for the six months ended June 30, 2017. Royalties The Deep Basin Assets are subject to royalty regimes in both Alberta and British Columbia. In Alberta, royalties benefit from a number of different programs that reduce the royalty rate on natural gas production. Natural gas wells in Alberta also benefit from the Gas Cost Allowance (“GCA”), which reduces royalties, to account for capital and operating costs incurred to process and transport the Crown’s portion of natural gas production. Effective January 1, 2017, the Alberta Government released a new Royalty Regime, Alberta’s Modernized Royalty Framework (“MRF”), which applies to all producing wells after January 1, 2017. Under this new framework, Cenovus will pay a five percent pre-payout royalty on all production until the total revenue from a well equals the drilling and completion cost allowance calculated for each well that meets certain MRF criteria. Subsequently, a higher post-payout royalty rate will apply and will vary based on product-specific market prices. Once a well reaches a maturity threshold, the royalty rate will drop to better match declining production rates. Wells drilled before January 1, 2017 will be managed under the old framework until 2027 and then will convert to the MRF. In British Columbia, royalties also benefit from programs to reduce the royalty rate on natural gas production. British Columbia applies a GCA, but only on natural gas processed through producer-owned plants. British Columbia also offers a Producer Cost of Service (“PCOS”) allowance, which reduces the royalty for the processing

  • f the Crown’s portion of natural gas production.

For the three and six months ended June 30, 2017, the effective liquids royalty rate for our Deep Basin properties was 11.7 percent. For the three and six months ended June 30, 2017, the effective natural gas royalty rate for our Deep Basin properties was 4.1 percent. Expenses Operating Primary drivers of our operating expenses from May 17 to June 30, 2017 related to workforce, repairs and maintenance, property tax and lease costs, and electricity. Operating costs were $8.84 per BOE. Transportation Transportation costs were $1.96 per BOE and includes charges for the transportation of crude oil, natural gas and NGLs to the sales point. Netbacks

($/BOE) May 17 – June 30, 2017 Sales Price 21.94 Royalties 1.45 Transportation and Blending 1.96 Operating Expenses 8.84 Production and Mineral Taxes 0.03 Netback 9.66

Cenovus Energy Inc. Second Quarter 2017 Report Page 33 Management's Discussion and Analysis

slide-34
SLIDE 34

Deep Basin – Capital Investment and Drilling Activity In the Deep Basin, we are taking a disciplined approach to restarting development activities, including the commencement of our drilling program in the second quarter. Our drilling activity will be focused on drilling horizontal production wells targeting liquids rich gas within the Deep Basin corridor. Future Capital Investment Upon further review of our capital program following our June 20, 2017 news release, we updated our 2017 guidance. We are taking a disciplined development approach on the Deep Basin Assets through 2017 and anticipate ramping up our activity levels through 2020. We plan to focus capital investment on a number of drilling opportunities that have the potential to generate strong returns and start to use facilities that are currently underutilized. Our 2017 Deep Basin capital investment post May 17, 2017 is forecast to be between $160 million and $180 million. DD&A We deplete crude oil and natural gas properties on a unit-of-production basis over proved reserves. The unit-of- production rate takes into account expenditures incurred to date, together with future development expenditures required to develop those proved reserves. This rate, calculated at an area level, is then applied to our sales volume to determine DD&A in a given period. We believe that this method of calculating DD&A charges each barrel

  • f crude oil equivalent sold with its proportionate share of the cost of capital invested over the total estimated life
  • f the related asset as represented by proved reserves. Deep Basin DD&A for the 45 days ended June 30, 2017

was $45 million.

CONVENTIONAL (DISCONTINUED OPERATIONS)

We plan to divest our legacy Conventional assets. This includes our Pelican Lake heavy oil assets that use polymer flood and waterflood technology, our Suffield crude oil and natural gas assets in southern Alberta, a CO2 enhanced

  • il recovery project at Weyburn, and emerging tight oil assets in the Palliser area of Alberta. As such, our

Conventional segment has been classified as a discontinued operation. The established assets in this segment have long life reserves, stable operations and produce a diversity of crude oil. Significant developments that impacted our Conventional segment in the second quarter of 2017 compared with 2016 include:  Our average liquids sales price increasing 22 percent to $51.22 per barrel;  Liquids and natural gas Netbacks, excluding realized risk management activities, of $23.02 per barrel (2016 – $18.06 per barrel) and $1.42 per Mcf (2016 – $0.28 per Mcf), respectively;  Liquids production averaging 54,958 barrels per day, declining slightly from 2016 primarily due to expected natural declines, partially offset by an increase in production associated with the tight oil drilling program in southern Alberta; and  Generating Operating Margin net of capital investment of $109 million, an increase of 31 percent. Conventional – Liquids Three Months Ended June 30, 2017 Compared With June 30, 2016 Financial Results

Three Months Ended June 30, ($ millions) 2017 2016 Gross Sales 293 239 Less: Royalties 44 31 Revenues 249 208 Expenses Transportation and Blending 51 40 Operating 76 70 Production and Mineral Taxes 5 3 (Gain) Loss on Risk Management 3 (11) Operating Margin 114 106 Capital Investment 47 32 Operating Margin Net of Related Capital Investment 67 74

Cenovus Energy Inc. Second Quarter 2017 Report Page 34 Management's Discussion and Analysis

slide-35
SLIDE 35

Operating Margin Variance

(1)

Revenues include the value of condensate sold as heavy oil blend. Condensate costs are recorded in transportation and blending expense. The crude

  • il price excludes the impact of condensate purchases.

Revenues Price Our Conventional assets produce a diverse spectrum of crude oils, ranging from heavy oil, which realizes a price based on the WCS benchmark, to light oil, which realizes a price closer to the WTI benchmark. Our liquids sales price averaged $51.22 per barrel in the second quarter of 2017, a 22 percent increase from 2016, due to higher crude oil benchmark prices, adjusted for applicable differentials, the narrowing of the WCS- Condensate differential and the weakening of the Canadian dollar relative to the U.S. dollar. As the cost of condensate decreases relative to the price of blended crude oil, our heavy oil sales price increases. Due to high demand for condensate at Edmonton, we also purchase condensate from U.S. markets. As such, our average cost

  • f condensate is generally higher than the Edmonton benchmark price due to transportation between market hubs

and to field locations. In addition, up to three months may elapse from when we purchase condensate to when we blend it with our production. In a rising price environment, we expect to see some benefit in our heavy oil sales price as we are using condensate purchased at a lower price earlier in the year. Production Volumes

Three Months Ended June 30, (barrels per day) 2017 Percent Change 2016 Heavy Oil 26,593 (7)% 28,500 Light and Medium Oil 27,233 4% 26,177 NGLs 1,132 42% 799 54,958 (1)% 55,476

Total production declined slightly in 2017 compared with 2016 primarily as a result of expected natural declines. In the second quarter of 2016, production at Pelican Lake was shut down for two days as a safety precaution due to a nearby forest fire, resulting in lost production of approximately 650 barrels per day for the quarter. Light and medium oil increased in 2017 associated with our tight oil drilling program in southern Alberta. NGLs increased compared to 2016 primarily due to improved NGL plant performance. Condensate The heavy oil currently produced by Cenovus must be blended with condensate to reduce its thickness in order to transport it to market through pipelines. Our blending ratios for Conventional heavy oil range between 10 percent and 16 percent. Revenues represent the total value of blended crude oil sold and includes the value of condensate. Consistent with the narrowing of the WCS-Condensate differential in the second quarter of 2017, the proportion of the cost of condensate recovered increased. Royalties Conventional liquids royalties increased primarily due to higher sales prices. In the second quarter of 2017, the effective liquids royalty rate for our Conventional properties was 18.4 percent (2016 – 15.5 percent). Crown royalties at Pelican Lake are determined under oil sands royalty calculations. Pelican Lake is a post-payout project, therefore royalties are based on an annualized calculation which uses the greater of: (1) the gross revenues multiplied by the applicable royalty rate (one to nine percent, based on the Canadian dollar equivalent WTI benchmark price); or (2) the net profits of the project multiplied by the applicable royalty rate (25 to 40 percent, based on the Canadian dollar equivalent WTI benchmark price). Gross revenues are a function of sales volumes and sales prices. Net profits are a function of sales volumes, sales prices and allowed operating and capital costs. The Pelican Lake crown royalty calculation was based on net profits for the second quarter of 2016 and 2017.

106 114 14 13 11 6 2 46 2 6 50 100 150 200 250 Three Months Ended June 30, 2016 Price (1) Volume Condensate Revenue (1) Realized Risk Management Royalties Transportation and Blending (1) Operating Expenses Production and Mineral Taxes Three Months Ended June 30, 2017

($ millions)

Cenovus Energy Inc. Second Quarter 2017 Report Page 35 Management's Discussion and Analysis

slide-36
SLIDE 36

Expenses Transportation and Blending Transportation and blending costs increased in the second quarter of 2017. Blending costs rose primarily due to higher condensate prices. Transportation charges were slightly higher. Operating Primary drivers of our operating expenses in the second quarter of 2017 were workforce, workovers, electricity, property taxes and lease costs, and repairs and maintenance. Operating costs increased seven percent to $14.99 per barrel primarily due to:  An increase in workover costs and repairs and maintenance as a result of increased activity;  An increase in electricity costs; and  Higher fluid and waste handling and trucking costs. In the second quarter of 2017, production and mineral taxes increased slightly, consistent with the rise in crude oil prices. Netbacks (1)

Heavy Oil Light and Medium Oil Three Months Ended June 30, ($/bbl) 2017 2016 2017 2016 Sales Price 46.67 36.77 56.40 48.09 Royalties 6.15 3.95 11.58 8.52 Transportation and Blending 4.48 3.85 2.82 2.77 Operating Expenses 14.56 12.34 16.08 16.21 Production and Mineral Taxes 0.01 0.01 1.85 1.18 Netback Excluding Realized Risk Management 21.47 16.62 24.07 19.41 Realized Risk Management Gain (Loss) (0.50) 2.12 (0.79) 2.09 Netback Including Realized Risk Management 20.97 18.74 23.28 21.50

(1)

Netbacks reflect our margin on a per-barrel basis of unblended crude oil.

Risk Management Risk management activities for the second quarter resulted in realized losses of $3 million (2016 – realized gains of $11 million), consistent with average benchmark prices exceeding our contract prices. Six Months Ended June 30, 2017 Compared With June 30, 2016 Financial Results

Six Months Ended June 30, ($ millions) 2017 2016 Gross Sales 572 428 Less: Royalties 90 48 Revenues 482 380 Expenses Transportation and Blending 98 84 Operating 145 148 Production and Mineral Taxes 9 5 (Gain) Loss on Risk Management 16 (51) Operating Margin 214 194 Capital Investment 132 69 Operating Margin Net of Related Capital Investment 82 125

Cenovus Energy Inc. Second Quarter 2017 Report Page 36 Management's Discussion and Analysis

slide-37
SLIDE 37

Operating Margin Variance

(1)

Revenues include the value of condensate sold as heavy oil blend. Condensate costs are recorded in transportation and blending expense. The crude

  • il price excludes the impact of condensate purchases.

Revenues Price Our average liquids sales price increased 45 percent to $51.65 per barrel consistent with the improvement in crude

  • il benchmark prices, net of applicable differentials.

Production Volumes

Six Months Ended June 30, (barrels per day) 2017 Percent Change 2016 Heavy Oil 26,933 (10)% 29,873 Light and Medium Oil 26,167 (2)% 26,649 NGLs 1,090 9% 1,003 54,190 (6)% 57,525

Total production decreased primarily as a result of expected natural declines, partially offset by an increase in production associated with our tight oil drilling program in southern Alberta and a rise in our NGLs production related to improved NGL plant performance. Royalties Royalties increased $42 million primarily due to higher sales prices and lower allowable costs for royalty purposes in Weyburn, partially offset by a reduction in sales volumes. In the first six months of 2017, the effective liquids royalty rate for our Conventional properties was 19.3 percent (2016 – 14.3 percent). The Pelican Lake crown royalty calculation was based on net profits in both 2017 and 2016. Expenses Transportation and Blending Transportation and blending costs increased $14 million. Blending costs rose due to higher condensate prices, partially offset by a decrease in condensate volumes, consistent with lower production. Transportation charges were lower largely due to a decline in sales volumes. Operating Primary drivers of our operating expenses in the first six months of 2017 were workforce costs, workover activities, electricity, property taxes and lease costs, repairs and maintenance, and chemical consumption. Operating expenses increased $0.34 per barrel. The per unit increase was primarily due to lower production volume and higher energy costs and an increase in workover activities. This increase was partially offset by:  A decrease in chemical costs associated with reduced polymer consumption;  Lower property taxes and lease costs;  A decline in fluid and waste handling and trucking costs; and  Lower electricity costs as a result of a decline in prices. Production and mineral taxes increased on a year-to-date basis due to the rise in crude oil prices.

194 214 22 67 42 14 4 155 11 3 100 200 300 400 Six Months Ended June 30, 2016 Price (1) Volume Condensate Revenue (1) Realized Risk Management Royalties Transportation and Blending (1) Operating Expenses Production and Mineral Taxes Six Months Ended June 30, 2017 ($ millions)

Cenovus Energy Inc. Second Quarter 2017 Report Page 37 Management's Discussion and Analysis

slide-38
SLIDE 38

Netbacks

Heavy Oil Light and Medium Oil Six Months Ended June 30, ($/bbl) 2017 2016 2017 2016 Sales Price 47.20 31.15 56.61 41.12 Royalties 6.57 2.62 12.14 6.82 Transportation and Blending 3.96 4.33 2.76 2.75 Operating Expenses 13.74 13.19 16.41 16.28 Production and Mineral Taxes 0.02

  • 1.90

1.00 Netback Excluding Realized Risk Management 22.91 11.01 23.40 14.27 Realized Risk Management Gain (Loss) (1.74) 5.17 (1.62) 5.04 Netback Including Realized Risk Management 21.17 16.18 21.78 19.31

(1)

Netbacks reflect our margin on a per-barrel basis of unblended crude oil.

Risk Management Risk management activities in the first half of the year resulted in realized losses of $16 million (2016 – realized gains of $51 million), consistent with average benchmark prices exceeding our contract prices. Conventional – Natural Gas Financial Results

Three Months Ended June 30, Six Months Ended June 30, ($ millions) 2017 2016 2017 2016 Gross Sales 91 53 185 135 Less: Royalties 6 2 10 5 Revenues 85 51 175 130 Expenses Transportation and Blending 3 5 7 8 Operating 37 36 78 78 Production and Mineral Taxes

  • 1
  • (Gain) Loss on Risk Management
  • 1

Operating Margin 45 10 89 43 Capital Investment 3 2 6 4 Operating Margin Net of Related Capital Investment 42 8 83 39

Operating Margin from natural gas continued to help fund growth opportunities in our Oil Sands segment. Three and Six Months Ended June 30, 2017 Compared With June 30, 2016 Revenues Price In the three and six months ended June 30, 2017, our average natural gas sales price increased 84 percent to $2.80 per Mcf and 51 percent to $2.90 per Mcf, respectively. This is consistent with the rise in the AECO benchmark price. Production Production decreased seven percent to 355 MMcf per day in the second quarter. On a year-to-date basis, production declined nine percent to 352 MMcf per day due to expected natural declines. Royalties Royalties increased as a result of higher prices, partially offset by production declines. The average royalty rate in the second quarter was 5.2 percent (2016 – 4.1 percent) and 5.0 percent (2016 – 4.3 percent) on a year-to-date basis. Expenses Transportation In the three and six months ended June 30, 2017, transportation costs declined slightly compared with 2016 primarily due to the decline in sales volumes. Cenovus Energy Inc. Second Quarter 2017 Report Page 38 Management's Discussion and Analysis

slide-39
SLIDE 39

Operating Primary drivers of our operating expenses in the three and six months ended June 30, 2017 were property taxes and lease costs, and workforce. Operating expenses increased slightly in the second quarter of 2017 primarily due to an increase in repairs and maintenance. On a year-to-date basis, operating costs remained consistent compared with 2016. Risk Management Risk management activities resulted in an impact of $nil in the second quarter and on a year-to-date basis (2016 – $nil in the second quarter and realized losses of $1 million on a year-to-date basis), consistent with average benchmark prices being relatively similar to our contract prices. Conventional – Capital Investment

Three Months Ended June 30, Six Months Ended June 30, ($ millions) 2017 2016 2017 2016 Heavy Oil 8 13 16 23 Light and Medium Oil 39 19 116 46 Natural Gas 3 2 6 4 Capital Investment (1) 50 34 138 73

(1)

Includes expenditures on PP&E, E&E assets, and assets classified as discontinued operations.

Capital investment in the first half of 2017 was primarily related to sustaining capital and tight oil development

  • pportunities in southern Alberta. Capital investment increased compared with 2016 as a result of limited crude oil

capital investment activities in 2016 in response to the low commodity price environment. Drilling Activity

Six Months Ended June 30, (net wells, unless otherwise stated) 2017 2016 Crude Oil 23 1 Recompletions

  • 65

Gross Stratigraphic Test Wells 26 4

Drilling activity in the first six months of 2017 focused on drilling stratigraphic test wells and horizontal production wells for tight oil in southern Alberta. Future Capital Investment Our updated 2017 crude oil capital investment forecast is between $225 million and $275 million with spending plans mainly focused on sustaining capital. Guidance has decreased from June 20, 2017 by approximately 23 percent. DD&A and Exploration Expense We deplete crude oil and natural gas properties on a unit-of-production basis over proved reserves. The unit-of- production rate takes into account expenditures incurred to date, together with future development expenditures required to develop those proved reserves. This rate, calculated at an area level, is then applied to our sales volume to determine DD&A in a given period. We believe that this method of calculating DD&A charges each barrel

  • f crude oil equivalent sold with its proportionate share of the cost of capital invested over the total estimated life
  • f the related asset as represented by proved reserves.

Conventional DD&A decreased $74 million in the second quarter of 2017 due to a decline in sales volumes and lower DD&A rates. We stopped recording DD&A on our Pelican Lake and Suffield assets at the end of the first quarter of 2017 due to their held for sale status, as required by IFRS. We stopped recording DD&A on our remaining conventional assets at the end of the second quarter due to our divestiture plans. DD&A decreased $275 million on a year-to-date basis due to impairment charges of $170 million recorded in the first quarter of 2016 associated with our Northern Alberta cash-generating unit (“CGU”), a decline in sales volumes and the plans to divest of our conventional assets.

REFINING AND MARKETING

Cenovus is a 50 percent partner in the Wood River and Borger refineries, which are located in the U.S. and

  • perated by our partner, Phillips 66. Our Refining and Marketing segment positions us to capture the value from

crude oil production through to refined products such as diesel, gasoline and jet fuel. Our integrated approach provides a natural economic hedge against widening crude oil price differentials by providing lower feedstock prices to the Refineries. This segment captures our marketing and transportation initiatives as well as our crude-by-rail terminal operations located in Bruderheim, Alberta. In the three and six months ended June 30, 2017, we loaded an average of 11,079 and 11,482 gross barrels per day, respectively (2016 – 15,531 and 11,122 gross barrels per day, respectively). Cenovus Energy Inc. Second Quarter 2017 Report Page 39 Management's Discussion and Analysis

slide-40
SLIDE 40

Refinery Operations (1)

Three Months Ended June 30, Six Months Ended June 30, 2017 2016 2017 2016 Crude Oil Capacity (Mbbls/d) 460 460 460 460 Crude Oil Runs (Mbbls/d) 449 458 428 446 Heavy Crude Oil 201 228 201 235 Light/Medium 248 230 227 211 Refined Products (Mbbls/d) 476 483 455 472 Gasoline 225 240 226 235 Distillate 154 150 143 146 Other 97 93 86 91 Crude Utilization (percent) 98 100 93 97

(1)

Represents 100 percent of the Wood River and Borger refinery operations.

On a 100-percent basis, the Refineries have a total processing capacity of approximately 460,000 gross barrels per day of crude oil, including processing capability of up to 255,000 gross barrels per day of blended heavy crude oil and 45,000 gross barrels per day of NGLs. The ability to process a wide slate of crude oils allows the Refineries to economically integrate heavy crude oil production. Processing less expensive crude oil relative to WTI creates a feedstock cost advantage, illustrated by the discount of WCS relative to WTI. The amount of heavy crude oil processed, such as WCS and CDB, is dependent on the quality and quantity of available crude oil with the total input slate optimized at each refinery to maximize economic benefit. Crude utilization represents the percentage of total crude oil processed in the Refineries relative to the total capacity. In the second quarter, crude oil runs and refined product output declined slightly compared to 2016 primarily due to unplanned maintenance at both Refineries. Lower heavy crude oil volumes were processed due to optimization

  • f the total crude input slate as a result of narrowing heavy crude oil differentials.

On a year-to-date basis, crude oil runs and refined product output decreased compared with 2016 primarily due to the larger scope of the planned turnarounds at both Refineries in the first quarter of 2017. Consistent performance

  • f the Refineries in the second quarter of 2016 was offset by planned and unplanned maintenance at both

Refineries in the first quarter of 2016. Lower heavy crude oil volumes were processed due to the planned turnarounds in the first quarter of 2017 and optimization of the total crude input slate. Financial Results

Three Months Ended June 30, Six Months Ended June 30, ($ millions) 2017 2016 2017 2016 Revenues 2,397 2,129 5,001 3,717 Purchased Product 2,183 1,712 4,513 3,140 Gross Margin 214 417 488 577 Expenses Operating 192 182 411 385 (Gain) Loss on Risk Management 2 42 4 22 Operating Margin 20 193 73 170 Capital Investment 40 53 86 105 Operating Margin Net of Related Capital Investment (20) 140 (13) 65

Gross Margin The refining realized crack spread, which is the gross margin on a per barrel basis, is affected by many factors, such as the variety of feedstock crude oil processed; refinery configuration and the proportion of gasoline, distillate and secondary product output; the time lag between the purchase of crude oil feedstock and the processing of that crude oil through the Refineries; and the cost of feedstock. Feedstock costs are valued on a FIFO accounting basis. In the three months ended June 30, 2017, our gross margin declined primarily due to narrowing heavy crude oil differentials, lower average market crack spreads, a decrease in crude utilization rates and a decline in the gross margin from third-party crude oil and natural gas sales undertaken by the marketing group. This was partially

  • ffset by the weakening of the Canadian dollar relative to the U.S. dollar in the second quarter compared with

2016, which had a positive impact of approximately $8 million on our refining and marketing gross margin. In the six months ended June 30, 2017, our gross margin declined primarily due to narrowing heavy crude oil differentials, lower crude utilization rates, decreased margins on the sale of our secondary products due to higher

  • verall feedstock costs, and a decline in the gross margin from third-party crude oil and natural gas sales

undertaken by the marketing group. In the three and six months ended June 30, 2017, the costs associated with Renewable Identification Numbers (“RINs”) were $66 million and $127 million, respectively (2016 – $67 million and $129 million, respectively). The costs of RINs remained relatively consistent as the decrease in RINs benchmark prices was offset by an increase in the required RINs volume obligation. Cenovus Energy Inc. Second Quarter 2017 Report Page 40 Management's Discussion and Analysis

slide-41
SLIDE 41

Operating Expense Primary drivers of operating expenses in the second quarter of 2017 were labour, maintenance, utilities and

  • supplies. On a year-to-date basis, the primary drivers were maintenance, labour, utilities and supplies. Reported
  • perating expenses increased in the second quarter compared with 2016 primarily due to an increase in utility

costs resulting from higher natural gas prices and a weakening of the Canadian dollar relative to the U.S. dollar. On a year-to-date basis, operating expenses increased due to higher utility costs resulting from higher natural gas prices, and an increase in maintenance costs associated with the plant turnarounds in the first quarter of 2017. Refining and Marketing – Capital Investment

Three Months Ended June 30, Six Months Ended June 30, ($ millions) 2017 2016 2017 2016 Wood River Refinery 22 38 56 75 Borger Refinery 17 13 29 26 Marketing 1 2 1 4 40 53 86 105

Capital expenditures in the first half of 2017 focused on capital maintenance and reliability work. Capital investment declined in the three and six months ended June 30, 2017. In the first half of 2016, work continued on the debottlenecking project at the Wood River refinery that was successfully completed in the third quarter of 2016. In 2017, we expect to invest between $185 million and $215 million mainly related to capital maintenance and reliability work. DD&A Refining and the crude-by-rail terminal assets are depreciated on a straight-line basis over the estimated service life of each component of the facilities, which range from three to 40 years. The service lives of these assets are reviewed on an annual basis. Refining and Marketing DD&A increased by $5 million in the second quarter and $4 million on a year-to-date basis, primarily due to the change in the U.S./Canadian dollar exchange rate.

CORPORATE AND ELIMINATIONS

The Corporate and Eliminations segment includes intersegment eliminations relating to transactions that have been recorded at transfer prices based on current market prices, as well as unrealized intersegment profits in inventory. The gains and losses on risk management represent the unrealized mark-to-market gains and losses related to derivative financial instruments used to mitigate fluctuations in commodity prices, power costs, interest rates, and foreign exchange rates, as well as realized risk management gains on interest rate swaps and foreign exchange

  • contracts. In the second quarter of 2017, our risk management activities resulted in $132 million of unrealized

gains (2016 – $284 million of unrealized losses). On a year-to-date basis, we had $411 million of unrealized risk management gains (2016 – $433 million of unrealized losses). As financial instruments are settled, the realized gains and losses are recorded in the reportable segment to which the derivative instrument relates. In the three and six months ended June 30, 2017, we realized $143 million of risk management gains on foreign exchange contracts due to hedging activity undertaken to support the Acquisition. The Corporate and Eliminations segment also includes Cenovus-wide costs for general and administrative, financing costs, interest income, foreign exchange, revaluation gain, transaction costs, re-measurement of the contingent payment, research costs, and (gain) loss on divestiture of assets.

Three Months Ended June 30, Six Months Ended June 30, ($ millions) 2017 2016 2017 2016 General and Administrative 58 94 101 154 Finance Costs 168 96 267 195 Interest Income (10) (7) (27) (18) Foreign Exchange (Gain) Loss, Net (410) 20 (486) (383) Revaluation (Gain) (2,524)

  • (2,524)
  • Transaction Costs

26

  • 55
  • Re-measurement of the Contingent Payment

(66)

  • (66)
  • Research Costs

5 7 9 25 (Gain) Loss on Divestiture of Assets

  • 1

1 1 Other (Income) Loss, Net (2) 2 (2) 2 (2,755) 213 (2,672) (24)

Cenovus Energy Inc. Second Quarter 2017 Report Page 41 Management's Discussion and Analysis

slide-42
SLIDE 42

Expenses General and Administrative Primary drivers of our general and administrative expenses in 2017 were workforce and office rent. General and administrative expenses decreased by $36 million in the second quarter and by $53 million on a year-to-date basis. The declines resulted from:  Lower long-term employee incentive costs related to a drop in our share price;  A recovery of $3 million in the second quarter and a non-cash expense of $5 million on a year-to-date basis for certain Calgary office space in excess of Cenovus’s current and near-term requirements, compared with $17 million and $31 million, respectively, recorded in the three and six months ended June 30, 2016; and  Lower workforce costs primarily related to $19 million of severance costs recorded in the second quarter of 2016. These decreases were partially offset by costs related to transitional services provided by ConocoPhillips. Under the purchase and sales agreement, Cenovus and ConocoPhillips agreed to certain transitional services where ConocoPhillips will provide certain day-to-day services required by Cenovus for a period of approximately nine

  • months. These transactions are in the normal course of operations and are measured at the exchange amounts.

Costs related to the transitional services were approximately $10 million to date. Finance Costs Finance costs include interest expense on our long-term debt and short-term borrowings as well as the unwinding

  • f the discount on decommissioning liabilities. In both the three and six months ended June 30, 2017, finance costs

increased $72 million primarily due to costs associated with additional debt incurred to finance the Acquisition, including US$2.9 billion of senior unsecured notes, $3.6 billion borrowed under a committed Bridge Facility and borrowings through our existing committed credit facility. The weighted average interest rate on outstanding debt for the three and six months ended June 30, 2017 was 4.8 percent and 5.0 percent, respectively (2016 – 5.3 percent). Foreign Exchange

Three Months Ended June 30, Six Months Ended June 30, ($ millions) 2017 2016 2017 2016 Unrealized Foreign Exchange (Gain) Loss (396) 18 (468) (391) Realized Foreign Exchange (Gain) Loss (14) 2 (18) 8 (410) 20 (486) (383)

Unrealized foreign exchange gains resulted from the translation of our U.S. dollar denominated debt and translation

  • f U.S. cash that was accumulated leading up to the acquisition. The Canadian dollar relative to the U.S. dollar was

stronger at June 30, 2017 compared with March 31, 2017, resulting in unrealized gains. The Canadian dollar relative to the U.S. dollar strengthened by three percent at June 30, 2017 compared with December 31, 2016 resulting in year-to-date unrealized gains. Transaction Costs In the six months ended June 30, 2017, we expensed $55 million of transaction costs related to the Acquisition. See the Oil Sands and Deep Basin Acquisition section of this MD&A for more details. Revaluation (Gain) Prior to the Acquisition, our 50 percent interest in FCCL was jointly controlled with ConocoPhillips and met the definition of a joint operation under IFRS 11, “Joint Arrangements” and as such Cenovus recognized its share of the assets, liabilities, revenues and expenses in its consolidated results. Subsequent to the Acquisition, we control FCCL, as defined under IFRS 10, “Consolidated Financial Statements” and accordingly, FCCL has been consolidated. As required by IFRS 3 when control is achieved in stages, the previously held interest in FCCL was re-measured to its fair value of $12.3 billion and a non-cash revaluation gain of $2.5 billion ($1.8 billion, after-tax) was recorded in net earnings. Re-measurement of Contingent Payment Related to oil sands production, Cenovus has agreed to make quarterly payments to ConocoPhillips during the five years subsequent to the closing date for quarters in which the average WCS crude oil price exceeds $52 per barrel during the quarter. The quarterly payment will be $6 million for each dollar that the WCS price exceeds $52 per

  • barrel. There are no maximum payment terms. The calculation includes an adjustment mechanism related to

certain significant production outages at Foster Creek and Christina Lake, which may reduce the amount of a contingent payment. As production capacity increases with future expansions, the percentage of upside available to Cenovus will increase further. Cenovus Energy Inc. Second Quarter 2017 Report Page 42 Management's Discussion and Analysis

slide-43
SLIDE 43

The contingent payment is accounted for as a financial option. The fair value of $361 million on May 17, 2017 was estimated by calculating the present value of the future expected cash flows using an option pricing model. The contingent payment will subsequently be re-measured at fair value at each reporting date with changes in fair value recognized in net earnings. At June 30, 2017, the contingent payment was valued at $295 million and a re- measurement gain of $66 million was recorded. WCS in the second quarter averaged less than $52 per barrel, therefore no amount was payable. Average WCS forward pricing for the remaining term of the contingent payment is US$32.25 or C$43.86 per barrel. Our estimated quarterly WCS forward prices for the remaining term of the agreement range between approximately C$43 per barrel and C$46 per barrel. DD&A Corporate and Eliminations DD&A includes provisions in respect of corporate assets, such as computer equipment, leasehold improvements and office furniture. Costs associated with corporate assets are depreciated on a straight-line basis over the estimated service life of the assets, which range from three to 25 years. The service lives of these assets are reviewed on an annual basis. DD&A in the second quarter was $14 million (2016 – $19 million) and $32 million on a year-to-date basis (2016 – $36 million). Income Tax

Three Months Ended June 30, Six Months Ended June 30, ($ millions) 2017 2016 2017 2016 Current Tax Canada (183) (59) (209) (116) United States

  • 1

(1) 1 Total Current Tax Expense (Recovery) (183) (58) (210) (115) Deferred Tax Expense (Recovery) 865 (7) 941 (96) Tax Expense (Recovery) From Continuing Operations 682 (65) 731 (211)

The following table reconciles income taxes calculated at the Canadian statutory rate with the recorded income taxes:

Six Months Ended June 30, ($ millions) 2017 2016 Earnings (Loss) From Continuing Operations Before Income Tax 3,523 (406) Canadian Statutory Rate 27.0% 27.0% Expected Income Tax (Recovery) 951 (110) Effect of Taxes Resulting From: Foreign Tax Rate Differential (35) (23) Non-Taxable Capital (Gains) Losses (88) (53) Non-Recognition of Capital (Gains) Losses (63) (53) Recognition of Previously Unrecognized Capital Losses (63)

  • Non-Deductible Expenses

10 5 Other 19 23 Total Expense (Recovery) From Continuing Operations 731 (211) Effective Tax Rate 20.7% 52.0%

Tax interpretations, regulations and legislation in the various jurisdictions in which Cenovus and its subsidiaries

  • perate are subject to change. We believe that our provision for income taxes is adequate. There are usually a

number of tax matters under review and as a result, income taxes are subject to measurement uncertainty. The timing of the recognition of income and deductions for the purpose of current tax expense is determined by relevant tax legislation. In the three and six months ended June 30, 2017, a current tax recovery was recorded due to the carry back of current and prior year losses. A deferred tax expense was recorded in the second quarter and on a year-to-date basis in 2017 compared with a recovery in 2016 due to the revaluation gain of our pre-existing partnership interest in connection with the Acquisition and an increase in unrealized gains on risk management activities. In the three and six months ended June 30, 2017, we recorded income tax of $20 million related to discontinued

  • perations (three and six months ended June 30, 2016 – $16 million and $87 million income tax recovery,

respectively). Our effective tax rate is a function of the relationship between total tax expense (recovery) and the amount of earnings (loss) before income taxes. The effective tax rate differs from the statutory tax rate as it reflects higher U.S. tax rates, non-taxable unrealized foreign exchange (gains) losses, adjustments for changes in tax rates and

  • ther tax legislation, adjustments to the tax basis of the refining assets, variations in the estimate of reserves,

differences between the provision and the actual amounts subsequently reported on the tax returns, and other permanent differences. Cenovus Energy Inc. Second Quarter 2017 Report Page 43 Management's Discussion and Analysis

slide-44
SLIDE 44

LIQUIDITY AND CAPITAL RESOURCES

Three Months Ended June 30, Six Months Ended June 30, ($ millions) 2017 2016 2017 2016 Cash From (Used In) Operating Activities 1,239 205 1,567 387 Investing Activities (14,706) (270) (15,165) (639) Net Cash Provided (Used) Before Financing Activities (13,467) (65) (13,598) (252) Financing Activities 10,288 (43) 10,236 (84) Foreign Exchange Gain (Loss) on Cash and Cash Equivalents Held in Foreign Currency 120 5 131 11 Increase (Decrease) in Cash and Cash Equivalents (3,059) (103) (3,231) (325) June 30, 2017 December 31, 2016 Cash and Cash Equivalents 489 3,720 Committed and Undrawn Credit Facilities 4,500 4,000

Cash From (Used In) Operating Activities Cash From Operating Activities increased for the three and six months ended June 30, 2017 mainly due to higher Operating Margin, as discussed in the Financial Results section of this MD&A. Excluding risk management assets and liabilities, assets and liabilities held for sale, and the contingent payment we had a working capital of $15 million at June 30, 2017 compared with a surplus of $4,423 million at December 31, 2016. The change in working capital was primarily due to the Acquisition. We anticipate that we will continue to meet our payment obligations as they come due. Cash From (Used In) Investing Activities In the three and six months ended June 30, 2017, the change in Cash Used In Investing Activities was primarily due to the Acquisition. Capital investment increased in the current quarter and on a year-to-date basis. In 2016, capital investment was limited due to spending reductions in response to the low commodity price environment. Cash From (Used In) Financing Activities Cash From Financing Activities increased in the second quarter of 2017 and on a year-to-date basis primarily related to the issuance of debt and common shares to help finance the Acquisition. Total debt, including the current portion as at June 30, 2017 was $13,413 million (December 31, 2016 – $6,332 million), which includes $9,927 million of U.S. denominated senior unsecured notes with no principal payments due until October 15, 2019 (US$1.3 billion) and $3.6 billion under a committed Bridge Facility, both amounts are partially offset by debt discount and transaction costs. The $7,081 million increase in total debt is primarily due to Acquisition financing through the offering for US$2.9 billion of senior unsecured notes and the committed Bridge Facility. The current portion of the committed Bridge Facility is $893 million and it matures May 17, 2018. As at June 30, 2017, we were in compliance with all of the terms of our debt agreements. Senior Unsecured Notes In connection with the Acquisition, on April 7, 2017, Cenovus completed an offering in the United States for US$2.9 billion of senior unsecured notes issued in three tranches, US$1.2 billion 4.25 percent senior unsecured notes due April 2027, US$700 million 5.25 percent senior unsecured notes due June 2037, and US$1.0 billion 5.40 percent senior unsecured notes due June 2047. Committed Bridge Facility On May 17, 2017, concurrent with the close of the Acquisition, we borrowed $3.6 billion under a committed Bridge

  • Facility. The Bridge Facility consists of a $0.9 billion tranche maturing on May 17, 2018, a $1.8 billion tranche

maturing on November 17, 2018, and a $0.9 billion tranche maturing on May 17, 2019. As at June 30, 2017, $3.6 billion remained outstanding on our committed Bridge Facility. We expect to repay the committed Bridge Facility through the sale of assets. See the Oil Sands and Deep Basin Acquisition section of this MD&A for more details. Dividends In the three and six months ended June 30, 2017, we paid dividends of $0.05 per share or $61 million and $0.10 per share or $102 million, respectively (2016 – $0.05 per share or $42 million and $0.10 per share or $83 million, respectively). The declaration of dividends is at the sole discretion of the Board and is considered quarterly. Cenovus Energy Inc. Second Quarter 2017 Report Page 44 Management's Discussion and Analysis

slide-45
SLIDE 45

Available Sources of Liquidity We expect cash flows from our liquids, natural gas and refining operations to fund a portion of our cash

  • requirements. Any potential shortfalls may be required to be funded through prudent use of our balance sheet

capacity, management of our asset portfolio and other corporate and financial opportunities that may be available to us. We remain committed to maintaining our investment grade credit ratings at S&P Global Ratings, DBRS Limited, and Fitch Ratings. The following sources of liquidity are available at June 30, 2017:

($ billions) Term Amount Cash and Cash Equivalents Not applicable 0.5 Committed Credit Facility – Tranche A November 2021 3.3 Committed Credit Facility – Tranche B November 2020 1.2 Base Shelf Prospectus (1) March 2018 US$2.8

(1)

Availability is subject to market conditions. See below and the Oil Sands and Deep Basin Acquisition section of this MD&A for details related to the Acquisition.

Committed Credit Facility On April 28, 2017, we amended our existing committed credit facility to increase the capacity of the facility by $0.5 billion to $4.5 billion and to extend the maturity dates. The committed credit facility consists of a $1.2 billion tranche maturing on November 30, 2020 and $3.3 billion tranche maturing on November 30, 2021. As of June 30, 2017, we had $4.5 billion available under our committed credit facility. Under the committed credit facility, Cenovus is required to maintain a debt to capitalization ratio not to exceed 65 percent; we are well below this limit. See below for the Debt to Capitalization ratio used by Cenovus to monitor our capital structure. Base Shelf Prospectus In 2016, Cenovus filed a base shelf prospectus. The base shelf prospectus allows us to offer, from time to time, up to US$5.0 billion, or the equivalent in other currencies, of debt securities, common shares, preferred shares, subscription receipts, warrants, share purchase contracts and units in Canada, the U.S. and elsewhere, where permitted by law. The base shelf prospectus will expire in March 2018. In connection with the Acquisition, on April 6, 2017, Cenovus closed a Bought-Deal Common Share Offering for 187.5 million common shares under the base shelf prospectus for gross proceeds of $3.0 billion. As at June 30, 2017, US$2.8 billion remains available under the base shelf prospectus. See the Oil Sands and Deep Basin Acquisition section of this MD&A for more details. Financial Metrics We monitor our capital structure and financing requirements using, among other things, non-GAAP financial measures consisting of Debt to Capitalization and Debt to Adjusted EBITDA. We define our non-GAAP measure of Debt as short-term borrowings and the current and long-term portions of long-term debt. We define Capitalization as Debt plus Shareholders’ Equity. We define Adjusted EBITDA as net earnings before finance costs, interest income, income tax expense, DD&A, goodwill impairments, asset impairments and reversals, unrealized gains (losses) on risk management, foreign exchange gains (losses), revaluation gain, re-measurement of contingent payment, gains (losses) on divestiture of assets and other income (loss), net, calculated on a trailing 12-month

  • basis. These measures are used to steward our overall debt position and as measures of our overall financial

strength. Over the long-term, we target a Debt to Capitalization ratio of between 30 percent to 40 percent and a Debt to Adjusted EBITDA of between 1.0 times to 2.0 times. At different points within the economic cycle, we expect these ratios may periodically be outside of the target range.

June 30, December 31, As at 2017 2016 Net Debt to Capitalization (1) (2) 40% 18% Debt to Capitalization 41% 35% Net Debt to Adjusted EBITDA (1) 6.1x 1.9x Debt to Adjusted EBITDA 6.4x 4.5x

(1)

Net Debt is defined as Debt net of cash and cash equivalents.

(2)

Net Debt to Capitalization is defined as Net Debt divided by Net Debt plus Shareholders’ Equity.

Debt to Capitalization increased as the higher long-term debt balance, related to the Acquisition and the weakening

  • f the Canadian dollar relative to the U.S. dollar, partially offset by the increase in Shareholders’ Equity. Debt to

Adjusted EBITDA increased as a result of a higher long-term debt balance, partially offset by a higher Adjusted EBITDA from an increase in commodity prices and the rise in sales volumes as a result of the Acquisition. We are intently focused on completing divestitures of our legacy Conventional assets in order to deleverage our balance sheet. Cenovus Energy Inc. Second Quarter 2017 Report Page 45 Management's Discussion and Analysis

slide-46
SLIDE 46

As at June 30, 2017, Cenovus’s Debt to Adjusted EBITDA and Net Debt to Adjusted EBITDA are 6.4x and 6.1x,

  • respectively. These ratios are well outside our target range. However, it is important to note that Adjusted EBITDA

is calculated on a rolling twelve month basis and as such, only includes the financial results from the Deep Basin Assets and the additional 50 percent of FCCL for the period May 17, 2017 to June 30, 2017. Debt and Net Debt are as at June 30, 2017; therefore, the ratios are fully burdened by the debt issued to finance the Acquisition. If Adjusted EBITDA reflected a full twelve months of earnings from the acquired assets, Cenovus’s Debt and Net Debt to Adjusted EBITDA ratios would be substantially lower. Additional information regarding our financial measures and capital structure can be found in the notes to the December 31, 2016 Consolidated Financial Statements and the June 30, 2017 interim Consolidated Financial Statements. Share Capital and Stock-Based Compensation Plans As part of our long-term incentive program, Cenovus has an employee Stock Option Plan as well as Performance Share Unit (“PSU”) Plan, a Restricted Share Unit (“RSU”) Plan and two Deferred Share Unit (“DSU”) Plans. Certain directors, officers or employees chose prior to December 31, 2016 to convert a portion of their remuneration, paid in the first quarter of 2017, into DSUs. The election for any particular year is irrevocable. DSUs may not be redeemed until departure. Directors also received an annual grant of DSUs. Refer to Note 21 of the interim Consolidated Financial Statements for more details on our Stock Option Plan and

  • ur PSU, RSU and DSU Plans.

As at June 30, 2017 Units Outstanding (thousands) Units Exercisable (thousands) Common Shares 1,228,790 N/A Stock Options 44,164 37,096 Other Stock-Based Compensation Plans 14,581 1,613

In connection with the Acquisition, Cenovus closed a Bought-Deal Common Share financing on April 6, 2017 for 187.5 million common shares, raising gross proceeds of $3.0 billion ($2.9 billion net of $101 million of share issuance costs). In addition, we issued 208 million common shares to ConocoPhillips on May 17, 2017 as partial consideration for the Acquisition. In relation to the share consideration, Cenovus and ConocoPhillips entered into an investor agreement, and a registration rights agreement which, among other things, restricts ConocoPhillips from selling or hedging its Cenovus common shares until November 17, 2017. ConocoPhillips is also restricted from nominating new members to Cenovus’s Board of Directors and must vote its Cenovus common shares in accordance with management recommendations or abstain from voting until such time ConocoPhillips owns 3.5 percent or less of the outstanding common shares of Cenovus. Contractual Obligations and Commitments Cenovus has obligations for goods and services that were entered into in the normal course of business. Obligations are primarily related to demand charges on firm transportation agreements, operating leases on buildings, our risk management program and an obligation to fund our defined benefit pension and other post- employment benefit plans. Obligations that have original maturities of less than one year are excluded. For further information, see the notes to the December 31, 2016 Consolidated Financial Statements. As at June 30, 2017, total commitments were $29.9 billion, of which $26.4 billion were for various transportation

  • commitments. During the six months ended June 30, 2017, in relation to the Acquisition, Cenovus assumed

commitments of $3.7 billion, primarily consisting of transportation commitments on various pipelines primarily related to FCCL. This increase in commitments was offset by our withdrawal from certain transportation initiatives and use of contracts. Transportation commitments include $16 billion that are subject to regulatory approval or have been approved but are not yet in service (December 31, 2016 – $19 billion). Terms are up to 20 years subsequent to the date of commencement and should help align our future transportation requirements with our anticipated production growth. As at June 30, 2017, there were outstanding letters of credit aggregating $246 million issued as security for performance under certain contracts (December 31, 2016 – $258 million). Legal Proceedings We are involved in a limited number of legal claims associated with the normal course of operations. We believe that any liabilities that might arise from such matters, to the extent not provided for, are not likely to have a material effect on our interim Consolidated Financial Statements. Cenovus Energy Inc. Second Quarter 2017 Report Page 46 Management's Discussion and Analysis

slide-47
SLIDE 47

Contingent Payment In connection with the Acquisition and related to oil sands production, we agreed to make quarterly payments to ConocoPhillips during the five years subsequent to May 17, 2017 for quarters in which the average WCS crude oil price exceeds $52 per barrel during the quarter. As at June 30, 2017, the estimated fair value of the contingent payment was $295 million. WCS in the second quarter averaged less than $52 per barrel, therefore no amount was

  • payable. The calculation includes an adjustment mechanism related to certain significant production outages at

Foster Creek and Christina Lake, which may reduce the amount of a contingent payment. As production capacity increases with future expansions, the percentage of upside available to Cenovus will increase further. See the Oil Sands and Deep Basin Acquisition and Corporate and Eliminations section of this MD&A for more details.

RISK MANAGEMENT

For a full understanding of the risks that impact Cenovus, the following discussion should be read in conjunction with the Risk Management section of our 2016 annual MD&A and the first quarter 2017 MD&A. A description of the risk factors and uncertainties can be found in the Advisory and a full discussion of the material risk factors affecting Cenovus can be found in our AIF for the year ended December 31, 2016. Cenovus is exposed to a number of risks through the pursuit of our strategic objectives. Some of these risks impact the oil and gas industry as a whole and others are unique to our operations. Actively managing these risks improves our ability to effectively execute our business strategy. We continue to be exposed to the risks identified in our 2016 annual MD&A and AIF. The following provides an update on our risks related to commodity prices and risks related to the Acquisition. Commodity Price Risk Fluctuations in commodity prices and refined product prices impacts our financial condition, results of operations, cash flows, growth, access to capital and cost of borrowing. We partially mitigate our exposure to commodity price risk through the integration of our business, financial instruments, physical contracts and market access commitments. Financial instruments undertaken within our refining business by the operator, Phillips 66, are primarily for purchased product. For details of our financial instruments, including classification, assumptions made in the calculation of fair value and additional discussion on exposure of risks and the management of those risks, see Notes 23 and 24 to the interim Consolidated Financial Statements. Risks Associated with Derivative Financial Instruments Financial instruments expose Cenovus to the risk that a counterparty will default on its contractual obligations. This risk is partially mitigated through credit exposure limits, frequent assessment of counterparty credit ratings and netting arrangements, as outlined in our Credit Policy. Financial instruments also expose Cenovus to the risk of a loss from adverse changes in the market value of financial instruments or if we are unable to fulfill our delivery obligations related to the underlying physical

  • transaction. Financial instruments may limit the benefit to Cenovus if commodity prices increase. These risks are

minimized through hedging limits that are reviewed annually by the Board, as required by our Market Risk Mitigation Policy. Impact of Financial Risk Management Activities

Three Months Ended June 30, 2017 2016 ($ millions) Realized Unrealized Total Realized Unrealized Total Crude Oil (1) (14) (166) (180) 19 246 265 Refining 2 (3) (1) (1) 1

  • Interest Rate
  • 13

13

  • 37

37 Foreign Exchange (143) 24 (119)

  • (Gain) Loss on Risk Management

(155) (132) (287) 18 284 302 Income Tax Expense (Recovery) 39 37 76 (6) (77) (83) (Gain) Loss on Risk Management, After Tax (116) (95) (211) 12 207 219

(1)

Excludes $3 million of realized risk management losses on crude oil contracts from our Conventional segment (2016 – $11 million realized risk management gains), which has been classified as a discontinued operation.

Cenovus Energy Inc. Second Quarter 2017 Report Page 47 Management's Discussion and Analysis

slide-48
SLIDE 48

Impact of Financial Risk Management Activities

Six Months Ended June 30, 2017 2016 ($ millions) Realized Unrealized Total Realized Unrealized Total Crude Oil (1) 63 (417) (354) (106) 364 258 Refining 4 (3) 1 (5) 4 (1) Power

  • 3

(14) (11) Interest Rate

  • 9

9

  • 79

79 Foreign Exchange (143)

  • (143)
  • (Gain) Loss on Risk Management

(76) (411) (487) (108) 433 325 Income Tax Expense (Recovery) 18 112 130 28 (118) (90) (Gain) Loss on Risk Management, After Tax (58) (299) (357) (80) 315 235

(1)

Excludes $16 million of realized risk management losses on crude oil contracts from our Conventional segment (2016 – $50 million realized risk management gains), which has been classified as a discontinued operation.

In the second quarter of 2017 and on a year-to-date basis, we incurred realized gains on foreign exchange contracts due to hedging activity undertaken to support the Acquisition. In the second quarter of 2017, we incurred realized gains on crude oil risk management activities, consistent with our contract prices exceeding the average benchmark prices. In the first half of 2017, we recorded realized losses on crude oil risk management activities as average benchmark prices exceeded our contract prices. Unrealized gains were recorded on our crude oil financial instruments in the three and six months ended June 30, 2017 primarily due to the realization of settled positions and changes in market prices. Risks Related to the Acquisition Unexpected Costs or Liabilities Related to the Acquisition Acquisitions of crude oil and natural gas properties are based largely on engineering, environmental and economic assessments made by the acquiror, independent engineers and consultants. These assessments include a series of assumptions regarding such factors as recoverability and marketability of crude oil and natural gas, environmental restrictions and prohibitions regarding releases and emissions of various substances, future prices of crude oil and natural gas and operating costs, future capital expenditures and royalties and other government levies which will be imposed over the producing life of the reserves. Many of these factors are subject to change and are beyond our

  • control. All such assessments involve a measure of geologic, engineering, environmental and regulatory

uncertainty that could result in lower production and reserves or higher operating or capital expenditures than anticipated. Although we conducted title and environmental reviews in respect of the Deep Basin Assets, such reviews cannot guarantee that any unforeseen defects in the chain of title will not arise to defeat our title to certain assets or that environmental defects or deficiencies do not exist. In connection with the Acquisition, there may be liabilities that we failed to discover or were unable to quantify in

  • ur due diligence conducted prior to the execution of the Acquisition Agreement and we may not be indemnified for

some or all of these liabilities. The discovery or quantification of any material liabilities could have a material adverse effect on our business, financial condition or future prospects. In addition, the Acquisition Agreement limits the amount for which we are indemnified, such that liabilities in respect of the Acquisition may be greater than the amounts for which we are indemnified under the Acquisition Agreement. Realization of Acquisition Benefits We believe that the Acquisition will provide a number of benefits to Cenovus. However, there is a risk that some or all of the expected benefits of the Acquisition may fail to materialize, may cost more to achieve or may not occur within the time periods that we anticipate. The realization of such benefits may be affected by a number of factors, many of which are beyond our control. Amount of Contingent Payments In connection with the Acquisition, we have agreed to make contingent payments under certain circumstances. The amount of contingent payments will vary depending on the Canadian dollar WCS price from time to time during the five year period following the closing of the Acquisition, and such payments may be significant. In addition, in the event that such payments are made, this could have an adverse impact on our reported results and other metrics. Significant Transaction and Related Costs We expect to incur a number of costs associated with completing the Acquisition, integrating the Deep Basin Assets and completing the targeted asset sales. The majority of such costs will consist of Acquisition, facilities and systems consolidation and employment-related costs. Additional unanticipated costs may be incurred in the integration of the assets to be acquired under the Acquisition (collectively, the “Acquired Assets”) into our business and completing the targeted asset sales. Cenovus Energy Inc. Second Quarter 2017 Report Page 48 Management's Discussion and Analysis

slide-49
SLIDE 49

Operational and Reserves and Resources Risks Relating to the Acquired Assets The risk factors set forth in our AIF relating to the crude oil and natural gas business, environmental matters and the operations and reserves and resources of Cenovus apply equally in respect of the Acquired Assets. In particular, the reserves, resources and recovery information contained in the reserves and resources reports in respect of the Acquired Assets is only an estimate and the actual production from and ultimate reserves of those properties may be greater or less than the estimates contained in such reports. Risk of Default in the Repayment of Borrowings under the Credit Facilities We have incurred material indebtedness under our existing committed credit facility and a committed Bridge

  • Facility. We intend to repay borrowings under the committed Bridge Facility through the sale of certain of our
  • assets. We may not be able to sell such assets in the time period we estimate, or for prices we expect to realize

from such sales. If we are unable to sell such assets on the terms that we expect to receive, or at all, our ability to repay borrowings under the committed Bridge Facility as anticipated could be adversely affected. In the event we are unable to refinance borrowings we incur under our existing committed credit facility or committed Bridge Facility in the manner intended, we may be required to utilize other sources of liquidity including cash on hand, cash from operating activities or borrowings under our existing committed credit facility to the extent of any availability thereunder. We may also be required to seek extensions to or modifications of the terms of our existing committed credit facility or committed Bridge Facility in order to defer the maturity dates of borrowings incurred

  • thereunder. In recent years, depressed prices for crude oil and natural gas have materially affected the operating

and financial performance of borrowers in the energy sector which has at times resulted in the curtailment of the availability of credit from lenders, and an unwillingness to provide borrowers with desired extensions to, or other modifications of, repayment terms. As a result, depending on crude oil and natural gas and credit market conditions at the time when borrowings under our existing committed credit facility or committed Bridge Facility are due for repayment, and our own financial performance at that time, we may be unable to obtain extensions or modifications of the terms of our existing committed credit facility or committed Bridge Facility on terms satisfactory to us, or at all, which could result in us defaulting on our repayment obligations under our existing committed credit facility or committed Bridge Facility and being subject to various remedies available to the lenders thereunder including remedies available under applicable bankruptcy and insolvency legislation. Increased Indebtedness In order to finance the Acquisition, we borrowed $3.6 billion on a committed Bridge Facility and issued US$2.9 billion in senior unsecured notes. Such borrowings will represent a significant increase in Cenovus’s consolidated indebtedness. Such additional indebtedness will increase Cenovus’s interest expense and debt service

  • bligations and may have a negative effect on Cenovus’s results of operations.

Cenovus’s ability to service its increased debt will depend upon, among other things, its future financial and

  • perating performance, which will be affected by prevailing economic conditions, interest rate fluctuations and

financial, business, regulatory and other factors, some of which are beyond Cenovus’s control. If Cenovus’s

  • perating results are not sufficient to service its current or future indebtedness, Cenovus may be forced to take

actions such as reducing dividends, reducing or delaying business activities, investments or capital expenditures, selling assets, restructuring or refinancing its debt, or seeking additional equity capital. Our credit ratings could be lowered or withdrawn entirely by a rating agency if, in its judgment, the circumstances

  • warrant. The increased indebtedness of Cenovus arising from the Acquisition could be a factor considered by the

ratings agencies in downgrading Cenovus’s credit rating. If a rating agency were to downgrade Cenovus’s credit rating, Cenovus’s borrowing costs could increase and its funding sources could decrease. In addition, a failure by Cenovus to maintain its current credit ratings could affect its business relationships with suppliers and operating

  • partners. A credit downgrade could also adversely affect the availability and cost of capital needed to fund the

growth investments that are a central element to Cenovus’s long-term business strategy. British Columbia Exposure Pursuant to the Acquisition, we acquired approximately 0.9 million gross acres (0.7 million net acres) of land holdings in British Columbia, which exposes us to the following additional risks. Aboriginal Claims Aboriginal groups have claimed aboriginal title and rights to portions of Western Canada, including British Columbia, and such claims, if successful, could have a material negative impact on Cenovus. The Governments of Canada and British Columbia have a duty to consult with Aboriginal people in relation to actions and decisions which may impact those rights and claims and, in certain cases, have a duty to accommodate their concerns. These duties have the potential to adversely affect Cenovus’s ability to obtain and renew permits, leases, licenses and

  • ther approvals, or to meet the terms and conditions of those approvals. The scope of the duty to consult by the

federal Government of Canada and the Government of British Columbia is subject to ongoing litigation which may result in uncertainty with respect to the process to obtain permits, leases, licenses and other approvals. Opposition by Aboriginal groups may also negatively impact Cenovus in terms of public perception, diversion of management’s time and resources, legal and other advisory expenses, potential blockades or other interference by third parties in Cenovus’s operations, or court-ordered relief impacting Cenovus’s operations. Challenges by Aboriginal groups could adversely impact Cenovus’s progress and ability to explore and develop its properties. Cenovus Energy Inc. Second Quarter 2017 Report Page 49 Management's Discussion and Analysis

slide-50
SLIDE 50

Climate Change Regulation On August 19, 2016, the Government of British Columbia unveiled its Climate Leadership Plan with a goal to reduce net annual GHG emissions by up to 25 million tonnes below current forecasts by 2050, and reaffirmed that it will achieve its 2050 target of an 80 percent reduction in emissions from 2007 levels. In addition to various measures across the economy that are designed to incentivize the growth of the renewable energy sector, the use of low GHG emitting technologies, and the improvement of energy efficiency, among other goals, the Government of British Columbia has committed to implementing a formal policy to regulate carbon capture and storage projects. Further, the Climate Leadership Plan sets out a strategy to reduce methane emissions in the upstream natural gas sector, beginning with a Legacy phase that targets a 45 percent reduction in fugitive and vented emissions by 2025 for facilities built before January 1, 2015, followed by a Transition phase for facilities built between 2015 and 2018 that will involve a new offset protocol and a Clean Infrastructure Royalty Credit Program, and finally a Future phase that will include the development and implementation of new methane emissions reduction standards. Environmental Regulation In British Columbia, the Oil and Gas Activities Act (the “OGAA”) impacts conventional crude oil and natural gas producers, shale gas producers and other operators of crude oil and natural gas facilities in the province. Under the OGAA, the British Columbia Oil and Gas Commission (the “Commission”) has broad powers, particularly with respect to compliance and enforcement and the setting of technical safety and operational standards for oil and natural gas activities. The Environmental Protection and Management Regulation establishes the government’s environmental objectives for Crown lands for water, riparian habitats, wildlife and wildlife habitat, old-growth forests and cultural heritage resources. The OGAA requires the Commission to consider these environmental

  • bjectives in deciding whether or not to authorize an oil and gas activity. In addition, although not exclusively an

environmental statute, the Petroleum and Natural Gas Act, in conjunction with the OGAA, requires companies to

  • btain various approvals before undertaking exploration or production work, such as geophysical licences,

geophysical exploration project approvals, permits for the exclusive right to do geological work and geophysical exploration work, and well, test hole and water-source well authorizations. Such approvals are given subject to environmental considerations and licences and project approvals can be suspended or cancelled for failure to comply with this legislation or its regulations. Royalty Regime Producers of crude oil and natural gas from Crown lands in British Columbia are required to pay annual rental payments, and make monthly royalty payments in respect of crude oil and natural gas produced. The amount payable as a royalty in respect of crude oil depends on the type and vintage of the crude oil, the quantity of crude

  • il produced in a month and the value of that crude oil. Generally, crude oil is classified as either light or heavy and

the vintage of crude oil is classified as either: “old oil” that is produced from a pool with a completed well that first recovered crude oil before October 31, 1975; “new oil” that is produced from a pool with a completed well that first recovered oil between October 31, 1975 and June 1, 1998; or “third-tier oil” that is produced from a pool with a completed well that first recovered crude oil after June 1, 1998 or through an enhanced oil recovery scheme. The royalty calculation takes into account the production of crude oil on a well-by-well basis, the specified royalty rate for a given vintage of crude oil, the average unit-selling price of the crude oil and any applicable royalty

  • exemptions. Royalty rates are reduced on low-productivity wells, reflecting the higher unit costs of extraction, and

are the lowest for third-tier oil, reflecting the higher unit costs of both exploration and extraction. The royalty payable in respect of natural gas produced on Crown lands is determined by a sliding scale formula based on a reference price, which is the greater of the average net price obtained by the producer and a prescribed minimum price. For non-conservation gas (not produced in association with crude oil), the royalty rate depends on the date of acquisition of the crude oil and natural gas tenure rights and the spud date of the well, and may also be impacted by the select price, a parameter used in the royalty rate formula to account for inflation. Royalty rates are fixed for certain classes of non-conservation gas when the reference price is below the select price. Conservation gas is subject to a lower royalty rate than non-conservation gas. Royalties on NGLs are levied at a flat rate of 20 percent of sales volume. Producers of crude oil and natural gas from freehold lands in British Columbia are required to pay monthly freehold production taxes. For crude oil, the applicable freehold production tax is based on the volume of monthly production, and is either a flat rate, or, beyond a certain production level, is determined using a sliding scale formula based on the production level. For natural gas, the applicable freehold production tax is a flat rate, or, at certain production levels, is determined using a sliding scale formula based on the reference price similar to that applied to natural gas production on Crown land, and depends on whether the natural gas is conservation gas or non-conservation gas. The production tax rate for freehold NGLs is a flat rate of 12.25 percent. Additionally,

  • wners of mineral rights in British Columbia must pay an annual mineral land tax that is equivalent to $4.94 per

hectare of producing lands. Non-producing lands are taxed on a sliding scale between $1.25 – $4.94 per hectare, depending on the total number of hectares owned by the entity. The Government of British Columbia maintains a number of targeted royalty programs for key resource areas intended to increase the competitiveness of British Columbia’s low productivity natural gas wells. These include both royalty credit and royalty reduction programs. Cenovus Energy Inc. Second Quarter 2017 Report Page 50 Management's Discussion and Analysis

slide-51
SLIDE 51

The Government of British Columbia also maintains an Infrastructure Royalty Credit Program that provides royalty credits for up to 50 percent of the cost of certain approved road construction or pipeline infrastructure projects intended to facilitate increased crude oil and natural gas exploration and production in under-developed areas and to extend the drilling season. Any future changes by the Government of British Columbia to the royalty programs or regimes could have a significant impact on Cenovus’s financial condition, results of operations and future capital expenditures.

CRITICAL ACCOUNTING JUDGMENTS, ESTIMATION UNCERTAINTIES AND ACCOUNTING POLICIES

Management is required to make estimates and assumptions, and use judgment in the application of accounting policies that could have a significant impact on our financial results. Actual results may differ from estimates and those differences may be material. The estimates and assumptions used are subject to updates based on experience and the application of new information. Our critical accounting policies and estimates are reviewed annually by the Audit Committee of the Board. Further details on the basis of preparation and our significant accounting policies can be found in the notes to the annual December 31, 2016 Consolidated Financial Statements and the interim Consolidated Financial Statements for the period ended June 30, 2017. Critical Judgments in Applying Accounting Policies Critical judgments are those judgments made by Management in the process of applying accounting policies that have the most significant effect on the amounts recorded in our annual and interim Consolidated Financial

  • Statements. There have been no changes to our critical judgments used in applying accounting policies during the

first six months of 2017. Further information can be found in the notes to the Consolidated Financial Statements and annual MD&A for the year ended December 31, 2016. Key Sources of Estimation Uncertainty Critical accounting estimates are those estimates that require Management to make particularly subjective or complex judgments about matters that are inherently uncertain. Estimates and underlying assumptions are reviewed on an ongoing basis and any revisions to accounting estimates are recorded in the period in which the estimates are revised. Further to those areas discussed in the annual Consolidated Financial Statements for the year ended December 31, 2016 and the annual MD&A, the estimation of fair values of the assets acquired and liabilities assumed in a business combination, including the contingent payment and goodwill, is a key area involving significant estimates or judgments. Recent Accounting Pronouncements There were no new or amended accounting standards or interpretations adopted during the six months ended June 30, 2017. New Accounting Standards and Interpretations not yet Adopted A number of new accounting standards, amendments to accounting standards and interpretations are effective for annual periods beginning after January 1, 2017 and have not been applied in preparing the interim Consolidated Financial Statements for the period ended June 30, 2017. The following provides an update to the disclosure in the annual Consolidated Financial Statements for the year ended December 31, 2016. Revenue Recognition On May 28, 2014, the IASB issued IFRS 15, “Revenue From Contracts With Customers” (“IFRS 15”) replacing IAS 11, “Construction Contracts”, IAS 18, “Revenue” and several revenue-related interpretations. IFRS 15 establishes a single revenue recognition framework that applies to contracts with customers. The standard requires an entity to recognize revenue to reflect the transfer of goods and services for the amount it expects to receive, when control is transferred to the purchaser. Disclosure requirements have also been expanded. IFRS 15 is effective for annual periods beginning on or after January 1, 2018. The standard may be applied retrospectively or using a modified retrospective approach. We are currently evaluating the impact of adopting IFRS 15 on the Consolidated Financial Statements and plan to adopt the standard for the year ended December 31, 2018. Leases On January 13, 2016, the IASB issued IFRS 16, “Leases” (“IFRS 16”), which requires entities to recognize lease assets and lease obligations on the balance sheet. For lessees, IFRS 16 removes the classification of leases as either operating leases or finance leases, effectively treating all leases as finance leases. Certain short-term leases (less than 12 months) and leases of low-value assets are exempt from the requirements, and may continue to be treated as operating leases. Lessors will continue with a dual lease classification model. Classification will determine how and when a lessor will recognize lease revenue, and what assets would be recorded. Cenovus Energy Inc. Second Quarter 2017 Report Page 51 Management's Discussion and Analysis

slide-52
SLIDE 52

IFRS 16 is effective for years beginning on or after January 1, 2019, with early adoption permitted if IFRS 15 has been adopted. The standard may be applied retrospectively or using a modified retrospective approach. The modified retrospective approach does not require restatement of prior period financial information as it recognizes the cumulative effect as an adjustment to opening retained earnings and applies the standard prospectively. We plan to apply IFRS 16 on January 1, 2019. A transition team is assessing the impacts of adopting IFRS 16 and will oversee changes to accounting systems, processes and internal controls. The estimated time and effort necessary to develop and implement required changes (including the impact to information technology systems) extends into 2018. Although the transition approach on adoption has not yet been determined, it is anticipated that the adoption of IFRS 16 will have a material impact on the Consolidated Balance Sheets.

CONTROL ENVIRONMENT

Management has assessed changes to its control environment related to the Acquisition. There have been no changes to internal control over financial reporting during the three months ended June 30, 2017 that have materially affected, or are reasonably likely to materially affect internal control over financial reporting. Internal control systems, no matter how well designed, have inherent limitations. Therefore, even those systems determined to be effective can provide only reasonable assurance with respect to financial statement preparation and presentation. Also, projections of any evaluation of effectiveness to future periods are subject to the risk that controls may become inadequate because of changes in conditions, or that the degree of compliance with the policies or procedures may deteriorate.

OUTLOOK

We expect 2017 to be a transformational year for Cenovus. The close of the Acquisition in the second quarter of 2017 has increased our interest in FCCL to 100 percent and provided us with a second growth platform of Deep Basin Assets in Alberta and British Columbia. We are also currently marketing for sale our legacy Conventional oil and natural gas assets. We believe we are well-positioned for continued market and commodity price volatility. We will continue to look for ways to increase our margins through strong operating performance and cost leadership, while delivering safe and reliable operations. Proactively managing our market access commitments and opportunities should assist with our goal of reaching a broader customer base to secure a higher sales price for our liquids production. We have reduced the amount of capital needed to sustain our base business and expand our projects, which we expect will allow us to reactivate growth in a disciplined manner. We believe these efforts will help to ensure our financial resilience. The following outlook commentary is focused on the next 12 months. Commodity Prices Underlying our Financial Results Our crude oil pricing outlook is influenced by the following:  We expect the general outlook for crude oil prices will be tied primarily to the supply response to the current price environment, the impact of supply disruptions and the pace of growth in global demand as influenced by macro-economic events. Overall, we expect crude oil price volatility to continue and a modest price improvement in the second half of 2017. OPEC’s ability to adhere to its production cuts combined with annual increases in demand growth should support prices in the remainder of the year, constrained by the need to draw down surplus crude oil inventories and U.S. production growth;  We anticipate the Brent-WTI differential to remain narrow now that the U.S. is exporting crude oil to overseas

  • markets. Overall, the differential will likely be set by transportation costs; and

 We expect that the WTI-WCS differential will widen due to Canadian supply returning from production outages,

  • il sands supply growth, and potential transportation constraints.

Cenovus Energy Inc. Second Quarter 2017 Report Page 52 Management's Discussion and Analysis

slide-53
SLIDE 53

Natural gas pricing is anticipated to improve throughout the second half of 2017 as we expect strong structural demand growth and only a slight increase in natural gas production. However, higher prices will likely be limited by the ability of the power sector to use coal as a substitute for natural gas. U.S. refining crack spreads are expected to weaken in the second half of the year as high global refined product inventories continue to weigh on product prices while seasonal U.S. demand weakens during fall and winter

  • periods. The impact of weaker refining crack spreads will be partially offset by the widening of the WTI-WCS

differential, creating a feedstock cost advantage. We expect the Canadian dollar to continue to be tied with a modest improvement in crude oil prices and the pace at which the U.S. Federal Reserve Board and the Bank of Canada raise interest rates. The Bank of Canada has recently raised its benchmark rate for the first time in nearly seven years marking a notable shift for Canada towards tighter monetary policy. Our exposure to the light/heavy price differentials is composed of both a global light/heavy component as well as Canadian transportation constraints. While we expect to see volatility in crude oil prices, we have the ability to partially mitigate our exposure to light/heavy price differentials through the following:  Integration – having heavy oil refining capacity capable of processing Canadian heavy oil. From a value perspective, our refining business positions us to capture value from both the WTI-WCS differential for Canadian crude oil and the Brent-WTI differential from the sale of refined products;  Financial hedge transactions – limiting the impact of fluctuations in upstream crude oil prices by entering into financial transactions that fix the WTI-WCS differential;  Marketing arrangements – limiting the impact of fluctuations in upstream crude oil prices by entering into physical supply transactions with fixed price components directly with refiners; and  Transportation commitments and arrangements – supporting transportation projects that move crude oil from

  • ur production areas to consuming markets and also to tidewater markets.

Additional natural gas and NGLs production associated with the Acquisition will provide improved upstream integration for the fuel, solvent and blending requirements at our oil sands operations.

25 30 35 40 45 50 55 60 Q3 2017 Q4 2017 Q1 2018 Q2 2018 Forward Prices at June 30, 2017

(average US$/bbl, unless otherwise indicated)

Crude Oil Benchmarks

Brent C5 @ Edmonton WTI WCS WCS $CAD

1.90 2.10 2.30 2.50 2.70 2.90 3.10 3.30 3.50 Q3 2017 Q4 2017 Q1 2018 Q2 2018 Forward Prices at June 30, 2017

(as indicated)

Natural Gas Benchmarks

AECO (C$/MCf) NYMEX ($US/Mcf)

5 10 15 20 25 Q3 2017 Q4 2017 Q1 2018 Q2 2018 Forward Prices at June 30, 2017

(average US$/bbl)

Refining 3-2-1 Crack Spread Benchmark

Chicago 0.75 0.76 0.77 0.78 Q3 2017 Q4 2017 Q1 2018 Q2 2018 Forward Prices at June 30, 2017

(average US$/C$1)

Foreign Exchange

US$/C$1

Cenovus Energy Inc. Second Quarter 2017 Report Page 53 Management's Discussion and Analysis

slide-54
SLIDE 54

Key Priorities for the Remainder of 2017 Maintain Financial Resilience and Executional Excellence We remain focused on maintaining our financial resilience and flexibility while continuing to deliver safe operations, which remains a top priority. Reducing our debt position is our number one priority. Our plans to divest our legacy conventional assets are progressing and on track. We are targeting between $4.0 billion and $5.0 billion in announced asset sale agreements by the end of 2017, the proceeds of which will be used to retire the committed Bridge Facility and deleverage our balance sheet. At June 30, 2017, through a combination of cash and $4.5 billion available under our committed credit facility, we have approximately $5.0 billion dollars of liquidity. We believe our liquidity position and the downside protection from our commodity hedging program should provide us the financial flexibility and resilience to maximize the value we realize on our asset sales and execute on our near-term deleveraging plan. Disciplined and Value-added Growth We updated our 2017 capital investment guidance and anticipate capital investment to be between $1.6 billion and $1.8 billion. Guidance has decreased from June 20, 2017 by approximately 11 percent. We intend to focus on optimizing our capital investment and development plans in the oil sands and Deep Basin for a variety of commodity price environments. We will remain disciplined with a moderate pace of growth in the oil sands that continues to focus on controlling costs and capital efficiencies. We also anticipate a disciplined development approach to the Deep Basin assets in 2017 and anticipate ramping up our activity levels through

  • 2020. With integration remaining an important part of our overall strategy, capital investment is also allocated for

scheduled maintenance and reliability work at the Refineries. Cost Leadership We remain committed to cost and margin leadership. We plan to continue to focus on reducing costs by leveraging

  • ur increased size and scale as well as through the advancement of technologies and enhancing our base business.

We believe there is an opportunity for operating cost reductions in the Deep Basin as we fully integrate these

  • assets. Our ability to drive structural and sustainable cost and margin improvements will further support our

business plan and financial resilience. Market Access Market access constraints for Canadian crude oil continue to be a challenge. Our strategy is to maintain firm transportation commitments through a combination of pipelines, rail and marine access to support our growth plans, but leave capacity for optimization. We expect to supplement firm capacity with active blending, storage, sourcing and destination optimization to ensure we are maximizing the margin on every barrel we produce. Cenovus Energy Inc. Second Quarter 2017 Report Page 54 Management's Discussion and Analysis

slide-55
SLIDE 55

CONSOLIDATED STATEMENTS OF EARNINGS (LOSS) (unaudited)

For the periods ended June 30, ($ millions, except per share amounts) Three Months Ended Six Months Ended Notes 2017 2016 2017 2016 (Restated) (1) (Restated) (1) Revenues 1 Gross Sales 4,081 2,749 7,649 4,740 Less: Royalties 44 3 71 3 4,037 2,746 7,578 4,737 Expenses 1 Purchased Product 2,080 1,624 4,314 2,986 Transportation and Blending 887 393 1,451 796 Operating 462 285 820 614 (Gain) Loss on Risk Management 23 (287) 302 (487) 325 Depreciation, Depletion and Amortization 7,13 387 225 629 445 Exploration Expense 7,12

  • 1

General and Administrative 58 94 101 154 Finance Costs 5 168 96 267 195 Interest Income (10) (7) (27) (18) Foreign Exchange (Gain) Loss, Net 6 (410) 20 (486) (383) Revaluation (Gain) 4 (2,524)

  • (2,524)
  • Transaction Costs

4 26

  • 55
  • Re-measurement of Contingent Payment

4,15 (66)

  • (66)
  • Research Costs

5 7 9 25 (Gain) Loss on Divestiture of Assets

  • 1

1 1 Other (Income) Loss, Net (2) 2 (2) 2 Earnings (Loss) From Continuing Operations Before Income Tax 3,263 (296) 3,523 (406) Income Tax Expense (Recovery) 9 682 (65) 731 (211) Net Earnings (Loss) From Continuing Operations 2,581 (231) 2,792 (195) Net Earnings (Loss) From Discontinued Operations 8 59 (36) 59 (190) Net Earnings (Loss) 2,640 (267) 2,851 (385) Basic and Diluted Earnings (Loss) Per Share ($) 10 Continuing Operations 2.32 (0.28) 2.87 (0.23) Discontinued Operations 0.05 (0.04) 0.06 (0.23) Net Earnings (Loss) Per Share 2.37 (0.32) 2.93 (0.46)

(1)

The comparative periods have been restated to reflect discontinued operations as discussed in Note 8.

See accompanying Notes to Consolidated Financial Statements (unaudited).

Cenovus Energy Inc. Second Quarter 2017 Report Page 55 Consolidated Financial Statements

slide-56
SLIDE 56

CONSOLIDATED STATEMENTS OF COMPREHENSIVE INCOME (LOSS) (unaudited)

For the periods ended June 30, ($ millions) Three Months Ended Six Months Ended Notes 2017 2016 2017 2016 Net Earnings (Loss) 2,640 (267) 2,851 (385) Other Comprehensive Income (Loss), Net of Tax 20 Items That Will Not be Reclassified to Profit or Loss: Actuarial Gain (Loss) Relating to Pension and Other Post-Retirement Benefits (6) (8) (9) (12) Items That May be Reclassified to Profit or Loss: Available for Sale Financial Assets – Change in Fair Value

  • (1)
  • (4)

Foreign Currency Translation Adjustment (99) 16 (142) (240) Total Other Comprehensive Income (Loss), Net of Tax (105) 7 (151) (256) Comprehensive Income (Loss) 2,535 (260) 2,700 (641) See accompanying Notes to Consolidated Financial Statements (unaudited).

Cenovus Energy Inc. Second Quarter 2017 Report Page 56 Consolidated Financial Statements

slide-57
SLIDE 57

CONSOLIDATED BALANCE SHEETS (unaudited)

As at ($ millions) June 30, December 31, Notes 2017 2016 Assets Current Assets Cash and Cash Equivalents 489 3,720 Accounts Receivable and Accrued Revenues 1,572 1,838 Income Tax Receivable 37 6 Inventories 11 1,136 1,237 Risk Management 23,24 182 21 Assets Held for Sale 8 3,378

  • Total Current Assets

6,794 6,822 Exploration and Evaluation Assets 1,12 5,338 1,585 Property, Plant and Equipment, Net 1,13 29,619 16,426 Income Tax Receivable 294 124 Risk Management 23,24 2 3 Other Assets 63 56 Goodwill 14 2,349 242 Total Assets 44,459 25,258 Liabilities and Shareholders’ Equity Current Liabilities Accounts Payable and Accrued Liabilities 2,188 2,266 Current Portion of Long-Term Debt 16 893

  • Income Tax Payable

138 112 Contingent Payment 15 60

  • Risk Management

23,24 1 293 Liabilities Related to Assets Held for Sale 8 1,434

  • Total Current Liabilities

4,714 2,671 Long-Term Debt 16 12,520 6,332 Contingent Payment 15 235

  • Risk Management

23,24 17 22 Decommissioning Liabilities 17 1,122 1,847 Other Liabilities 18 182 211 Deferred Income Taxes 5,968 2,585 Total Liabilities 24,758 13,668 Shareholders’ Equity 19,701 11,590 Total Liabilities and Shareholders’ Equity 44,459 25,258 See accompanying Notes to Consolidated Financial Statements (unaudited).

Cenovus Energy Inc. Second Quarter 2017 Report Page 57 Consolidated Financial Statements

slide-58
SLIDE 58

CONSOLIDATED STATEMENTS OF SHAREHOLDERS’ EQUITY (unaudited)

($ millions) Share Capital Paid in Surplus Retained Earnings AOCI (1) Total (Note 19) (Note 20) As at December 31, 2015 5,534 4,330 1,507 1,020 12,391 Net Earnings (Loss)

  • (385)
  • (385)

Other Comprehensive Income (Loss)

  • (256)

(256) Total Comprehensive Income (Loss)

  • (385)

(256) (641) Stock-Based Compensation Expense

  • 10
  • 10

Dividends on Common Shares

  • (83)
  • (83)

As at June 30, 2016 5,534 4,340 1,039 764 11,677 As at December 31, 2016 5,534 4,350 796 910 11,590 Net Earnings (Loss)

  • 2,851
  • 2,851

Other Comprehensive Income (Loss)

  • (151)

(151) Total Comprehensive Income (Loss)

  • 2,851

(151) 2,700 Common Shares Issued 5,506

  • 5,506

Stock-Based Compensation Expense

  • 7
  • 7

Dividends on Common Shares

  • (102)
  • (102)

As at June 30, 2017 11,040 4,357 3,545 759 19,701

(1)

Accumulated Other Comprehensive Income (Loss).

See accompanying Notes to Consolidated Financial Statements (unaudited).

Cenovus Energy Inc. Second Quarter 2017 Report Page 58 Consolidated Financial Statements

slide-59
SLIDE 59

CONSOLIDATED STATEMENTS OF CASH FLOWS (unaudited)

For the periods ended June 30, ($ millions) Three Months Ended Six Months Ended Notes 2017 2016 2017 2016 Operating Activities Net Earnings (Loss) 2,640 (267) 2,851 (385) Depreciation, Depletion and Amortization 7,13 456 368 819 910 Exploration Expense (1)

  • 2

1 Deferred Income Taxes 9 868 (52) 939 (242) Unrealized (Gain) Loss on Risk Management 23 (132) 284 (411) 433 Unrealized Foreign Exchange (Gain) Loss 6 (396) 18 (468) (391) Revaluation (Gain) 4 (2,524)

  • (2,524)
  • Re-measurement of Contingent Payment

15 (66)

  • (66)
  • (Gain) Loss on Divestiture of Assets
  • 1

1 1 Unwinding of Discount on Decommissioning Liabilities 17 23 32 49 64 Onerous Contract Provisions, Net of Cash Paid (8) 16 (5) 30 Other (68) 40 (72) 45 Net Change in Other Assets and Liabilities (25) (17) (56) (46) Net Change in Non-Cash Working Capital 472 (218) 508 (33) Cash From Operating Activities 1,239 205 1,567 387 Investing Activities Acquisition, Net of Cash Acquired 4 (14,326)

  • (14,499)
  • Capital Expenditures – Exploration and Evaluation Assets

12 (33) (19) (76) (53) Capital Expenditures – Property, Plant and Equipment 13 (294) (225) (564) (514) Net Change in Investments and Other 1 (1) 1

  • Net Change in Non-Cash Working Capital

(54) (25) (27) (72) Cash From (Used in) Investing Activities (14,706) (270) (15,165) (639) Net Cash Provided (Used) Before Financing Activities (13,467) (65) (13,598) (252) Financing Activities 25 Issuance of Long-Term Debt 16 3,842

  • 3,842
  • Net Issuance (Repayment) of Revolving Long-Term Debt

16 30

  • 30
  • Issuance of Debt Under Asset Sale Bridge Facility

16 3,579

  • 3,569
  • Common Shares Issued, Net of Issuance Costs

4,19 2,899

  • 2,899
  • Dividends Paid on Common Shares

10 (61) (42) (102) (83) Other (1) (1) (2) (1) Cash From (Used in) Financing Activities 10,288 (43) 10,236 (84) Foreign Exchange Gain (Loss) on Cash and Cash Equivalents Held in Foreign Currency 120 5 131 11 Increase (Decrease) in Cash and Cash Equivalents (3,059) (103) (3,231) (325) Cash and Cash Equivalents, Beginning of Period 3,548 3,883 3,720 4,105 Cash and Cash Equivalents, End of Period 489 3,780 489 3,780 See accompanying Notes to Consolidated Financial Statements (unaudited).

Cenovus Energy Inc. Second Quarter 2017 Report Page 59 Consolidated Financial Statements

slide-60
SLIDE 60

NOTES TO CONSOLIDATED FINANCIAL STATEMENTS (unaudited)

All amounts in $ millions, unless otherwise indicated For the period ended June 30, 2017

  • 1. DESCRIPTION OF BUSINESS AND SEGMENTED DISCLOSURES

Cenovus Energy Inc. and its subsidiaries, (together “Cenovus” or the “Company”) are in the business of developing, producing and marketing crude oil, natural gas liquids (“NGLs”) and natural gas in Canada with marketing activities and refining operations in the United States (“U.S.”). Cenovus is incorporated under the Canada Business Corporations Act and its shares are listed on the Toronto (“TSX”) and New York (“NYSE”) stock exchanges. The executive and registered office is located at 2600, 500 Centre Street S.E., Calgary, Alberta, Canada, T2G 1A6. Information on the Company’s basis of preparation for these interim Consolidated Financial Statements is found in Note 2. On May 17, 2017, Cenovus acquired from ConocoPhillips Company and certain of its subsidiaries (collectively, “ConocoPhillips”) a 50 percent interest in FCCL Partnership (“FCCL”) and the majority of ConocoPhillips’ western Canadian conventional crude oil and natural gas assets (the “Deep Basin Assets”). This acquisition increased Cenovus’s interest in FCCL to 100 percent and expanded Cenovus’s operating areas to include more than three million net acres of land, exploration and production assets and related infrastructure and agreements in Alberta and British Columbia. The acquisition had an effective date of January 1, 2017 (see Note 4). Management has determined the operating segments based on information regularly reviewed for the purposes of decision making, allocating resources and assessing operational performance by Cenovus’s chief operating decision

  • makers. The Company evaluates the financial performance of its operating segments primarily based on operating
  • margin. The Company’s reportable segments are:

 Oil Sands, which includes the development and production of bitumen and natural gas in northeast

  • Alberta. Cenovus’s bitumen assets include Foster Creek, Christina Lake and Narrows Lake as well as

projects in the early stages of development, such as Telephone Lake. The Company’s interest in certain of its operated oil sands properties, notably Foster Creek, Christina Lake and Narrows Lake, increased from 50 percent to 100 percent on May 17, 2017.  Deep Basin, which includes approximately three million net acres of land primarily in the Elmworth- Wapiti, Kaybob-Edson, and Clearwater operating areas, rich in natural gas and NGLs. The assets reside in Alberta and British Columbia and include interests in numerous natural gas processing facilities. The Deep Basin Assets were acquired on May 17, 2017.  Conventional, which has been classified as a discontinued operation as the Company has commenced marketing for sale its Conventional assets. This segment includes the development and production of conventional crude oil, NGLs and natural gas in Alberta and Saskatchewan, including the heavy oil assets at Pelican Lake, the carbon dioxide enhanced oil recovery project at Weyburn and emerging tight oil

  • pportunities.

 Refining and Marketing, which is responsible for transporting, selling and refining crude oil into petroleum and chemical products. Cenovus jointly owns two refineries in the U.S. with the operator Phillips 66, an unrelated U.S. public company. In addition, Cenovus owns and operates a crude-by-rail terminal in Alberta. This segment coordinates Cenovus’s marketing and transportation initiatives to

  • ptimize product mix, delivery points, transportation commitments and customer diversification. The

marketing of crude oil and natural gas sourced from Canada, including physical product sales that settle in the U.S., is considered to be undertaken by a Canadian business. U.S. sourced crude oil and natural gas purchases and sales are attributed to the U.S.  Corporate and Eliminations, which primarily includes unrealized gains and losses recorded on derivative financial instruments, gains and losses on divestiture of assets, as well as other Cenovus-wide costs for general and administrative, financing activities and research costs. As financial instruments are settled, the realized gains and losses are recorded in the reportable segment to which the derivative instrument

  • relates. Eliminations relate to sales and operating revenues, and purchased product between segments,

recorded at transfer prices based on current market prices, and to unrealized intersegment profits in

  • inventory. The Corporate and Eliminations segment is attributed to Canada, with the exception of

unrealized risk management gains and losses, which have been attributed to the country in which the transacting entity resides. The following tabular financial information presents the segmented information first by segment, then by product and geographic location. Cenovus Energy Inc. Second Quarter 2017 Report Page 60 Notes to Consolidated Financial Statements

slide-61
SLIDE 61

NOTES TO CONSOLIDATED FINANCIAL STATEMENTS (unaudited)

All amounts in $ millions, unless otherwise indicated For the period ended June 30, 2017 A) Results of Operations

Oil Sands Deep Basin Refining and Marketing For the three months ended June 30, 2017 2016 2017 2016 2017 2016 Revenues Gross Sales 1,666 709 124

  • 2,397

2,129 Less: Royalties 36 3 8

  • 1,630

706 116

  • 2,397

2,129 Expenses Purchased Product

  • 2,183

1,712 Transportation and Blending 879 395 10

  • Operating

221 104 51

  • 192

182 (Gain) Loss on Risk Management (14) (24)

  • 2

42 Operating Margin 544 231 55

  • 20

193 Depreciation, Depletion and Amortization 273 156 45

  • 55

50 Exploration Expense

  • Segment Income (Loss)

271 75 10

  • (35)

143 Corporate and Eliminations Consolidated For the three months ended June 30, 2017 2016 2017 2016 (Restated)(1) (Restated)(1) Revenues Gross Sales (106) (89) 4,081 2,749 Less: Royalties

  • 44

3 (106) (89) 4,037 2,746 Expenses Purchased Product (103) (88) 2,080 1,624 Transportation and Blending (2) (2) 887 393 Operating (2) (1) 462 285 (Gain) Loss on Risk Management (275) 284 (287) 302 Depreciation, Depletion and Amortization 14 19 387 225 Exploration Expense

  • Segment Income (Loss)

262 (301) 508 (83) General and Administrative 58 94 58 94 Finance Costs 168 96 168 96 Interest Income (10) (7) (10) (7) Foreign Exchange (Gain) Loss, Net (410) 20 (410) 20 Revaluation (Gain) (2,524)

  • (2,524)
  • Transaction Costs

26

  • 26
  • Re-measurement of Contingent Payment

(66)

  • (66)
  • Research Costs

5 7 5 7 (Gain) Loss on Divestiture of Assets

  • 1
  • 1

Other (Income) Loss, Net (2) 2 (2) 2 (2,755) 213 (2,755) 213 Earnings (Loss) From Continuing Operations Before Income Tax 3,263 (296) Income Tax Expense (Recovery) 682 (65) Net Earnings (Loss) From Continuing Operations 2,581 (231)

(1)

The comparative periods have been restated to reflect discontinued operations as discussed in Note 8.

Cenovus Energy Inc. Second Quarter 2017 Report Page 61 Notes to Consolidated Financial Statements

slide-62
SLIDE 62

NOTES TO CONSOLIDATED FINANCIAL STATEMENTS (unaudited)

All amounts in $ millions, unless otherwise indicated For the period ended June 30, 2017

Oil Sands Deep Basin Refining and Marketing For the six months ended June 30, 2017 2016 2017 2016 2017 2016 Revenues Gross Sales 2,728 1,179 124

  • 5,001

3,717 Less: Royalties 63 3 8

  • 2,665

1,176 116

  • 5,001

3,717 Expenses Purchased Product

  • 4,513

3,140 Transportation and Blending 1,445 799 10

  • Operating

361 231 51

  • 411

385 (Gain) Loss on Risk Management 63 (130)

  • 4

22 Operating Margin 796 276 55

  • 73

170 Depreciation, Depletion and Amortization 443 304 45

  • 109

105 Exploration Expense

  • 1
  • Segment Income (Loss)

353 (29) 10

  • (36)

65 Corporate and Eliminations Consolidated For the six months ended June 30, 2017 2016 2017 2016 (Restated)(1) (Restated)(1) Revenues Gross Sales (204) (156) 7,649 4,740 Less: Royalties

  • 71

3 (204) (156) 7,578 4,737 Expenses Purchased Product (199) (154) 4,314 2,986 Transportation and Blending (4) (3) 1,451 796 Operating (3) (2) 820 614 (Gain) Loss on Risk Management (554) 433 (487) 325 Depreciation, Depletion and Amortization 32 36 629 445 Exploration Expense

  • 1

Segment Income (Loss) 524 (466) 851 (430) General and Administrative 101 154 101 154 Finance Costs 267 195 267 195 Interest Income (27) (18) (27) (18) Foreign Exchange (Gain) Loss, Net (486) (383) (486) (383) Revaluation (Gain) (2,524)

  • (2,524)
  • Transaction Costs

55

  • 55
  • Re-measurement of Contingent Payment

(66)

  • (66)
  • Research Costs

9 25 9 25 (Gain) Loss on Divestiture of Assets 1 1 1 1 Other (Income) Loss, Net (2) 2 (2) 2 (2,672) (24) (2,672) (24) Earnings (Loss) From Continuing Operations Before Income Tax 3,523 (406) Income Tax Expense (Recovery) 731 (211) Net Earnings (Loss) From Continuing Operations 2,792 (195)

(1)

The comparative periods have been restated to reflect discontinued operations as discussed in Note 8.

Cenovus Energy Inc. Second Quarter 2017 Report Page 62 Notes to Consolidated Financial Statements

slide-63
SLIDE 63

NOTES TO CONSOLIDATED FINANCIAL STATEMENTS (unaudited)

All amounts in $ millions, unless otherwise indicated For the period ended June 30, 2017 B) Revenues by Product

Three Months Ended Six Months Ended For the periods ended June 30, 2017 2016 2017 2016 Upstream Crude Oil 1,639 704 2,667 1,169 Natural Gas (1) 68 2 72 6 NGLs 32

  • 32
  • Other

7

  • 10

1 Refining and Marketing 2,397 2,129 5,001 3,717 Corporate and Eliminations (106) (89) (204) (156) Revenues From Continuing Operations 4,037 2,746 7,578 4,737

(1)

Approximately 89 percent of the natural gas produced by Cenovus’s Deep Basin Assets has been sold to ConocoPhillips resulting in gross sales of $59 million for the three and six months ended June 30, 2017.

C) Geographical Information

Revenues Three Months Ended Six Months Ended For the periods ended June 30, 2017 2016 2017 2016 Canada 2,317 1,142 4,176 2,002 United States 1,720 1,604 3,402 2,735 Revenues From Continuing Operations 4,037 2,746 7,578 4,737 Non-Current Assets (1) June 30, December 31, As at 2017 2016 Canada (2) 33,353 14,130 United States 4,016 4,179 Consolidated 37,369 18,309

(1)

Includes exploration and evaluation (“E&E”) assets, property, plant and equipment (“PP&E”), goodwill and other assets.

(2)

The Conventional segment, which resides in Canada, has been reclassified as held for sale in 2017 in current assets. 2016 includes $3.2 million related to the Conventional segment.

D) Exploration and Evaluation Assets, Property, Plant and Equipment, Goodwill and Total Assets

E&E PP&E June 30, December 31, June 30, December 31, As at 2017 2016 2017 2016 Oil Sands 1,698 1,564 22,351 8,798 Deep Basin 3,640

  • 2,898
  • Conventional
  • 21
  • 3,080

Refining and Marketing

  • 4,111

4,273 Corporate and Eliminations

  • 259

275 Consolidated 5,338 1,585 29,619 16,426 Goodwill Total Assets June 30, December 31, June 30, December 31, As at 2017 2016 2017 2016 Oil Sands 2,349 242 28,091 11,112 Deep Basin

  • 6,649
  • Conventional
  • 3,231

3,196 Refining and Marketing

  • 5,159

6,613 Corporate and Eliminations

  • 1,329

4,337 Consolidated 2,349 242 44,459 25,258

Cenovus Energy Inc. Second Quarter 2017 Report Page 63 Notes to Consolidated Financial Statements

slide-64
SLIDE 64

NOTES TO CONSOLIDATED FINANCIAL STATEMENTS (unaudited)

All amounts in $ millions, unless otherwise indicated For the period ended June 30, 2017 E) Capital Expenditures (1)

Three Months Ended Six Months Ended For the periods ended June 30, 2017 2016 2017 2016 Capital Oil Sands 215 139 387 366 Deep Basin 13

  • 13
  • Conventional

50 34 138 73 Refining and Marketing 40 53 86 105 Corporate 9 10 16 15 Capital Investment 327 236 640 559 Acquisition Capital Oil Sands (2) 23,208 11 23,208 11 Deep Basin 6,627

  • 6,627
  • Total Capital Expenditures

30,162 247 30,475 570

(1)

Includes expenditures on PP&E, E&E assets and assets held for sale.

(2)

In connection with the Acquisition, Cenovus was deemed to have disposed of its pre-existing interest in FCCL and re-acquired it at fair value as required by IFRS 3.

  • 2. BASIS OF PREPARATION AND STATEMENT OF COMPLIANCE

In these interim Consolidated Financial Statements, unless otherwise indicated, all dollars are expressed in Canadian dollars. All references to C$ or $ are to Canadian dollars and references to US$ are to U.S. dollars. These interim Consolidated Financial Statements have been prepared in accordance with International Financial Reporting Standards (“IFRS”) as issued by the International Accounting Standards Board (“IASB”) applicable to the preparation of interim financial statements, including International Accounting Standard 34, “Interim Financial Reporting” (“IAS 34”). Certain information provided for the prior year has been reclassified to conform to the presentation adopted for the period ended June 30, 2017. These interim Consolidated Financial Statements were approved by the Audit Committee effective July 26, 2017.

  • 3. SIGNIFICANT ACCOUNTING POLICIES

A) Accounting Policies Certain information and disclosures normally included in the notes to the annual Consolidated Financial Statements have been condensed or have been disclosed on an annual basis only. Accordingly, these interim Consolidated Financial Statements should be read in conjunction with the annual Consolidated Financial Statements for the year ended December 31, 2016, which have been prepared in accordance with IFRS as issued by the IASB. These interim Consolidated Financial Statements have been prepared following the same accounting policies and methods

  • f computation as the annual Consolidated Financial Statements for the year ended December 31, 2016, except for

income taxes. Clarification on our business combinations and goodwill accounting policy has been added below. Income Taxes Income taxes on earnings or loss in interim periods are accrued using the income tax rate that would be applicable to the expected total annual earnings or loss. Business Combinations and Goodwill Business combinations are accounted for using the acquisition method of accounting in which the identifiable assets acquired, liabilities assumed and non-controlling interest, if any, are recognized and measured at their fair value at the date of acquisition. Any excess of the purchase price plus any non-controlling interest over the fair value of the net assets acquired is recognized as goodwill. Any deficiency of the purchase price over the fair value of the net assets acquired is credited to net earnings. At acquisition, goodwill is allocated to each of the cash-generating units (“CGUs”) to which it relates. Subsequent measurement of goodwill is at cost less any accumulated impairment losses. A contingent payment transferred in a business combination is measured at fair value on the date of acquisition and classified as a financial liability or equity. A contingent payment classified as a liability is re-measured at fair value at each reporting date, with changes in fair value recognized in net earnings. Payments are classified as cash Cenovus Energy Inc. Second Quarter 2017 Report Page 64 Notes to Consolidated Financial Statements

slide-65
SLIDE 65

NOTES TO CONSOLIDATED FINANCIAL STATEMENTS (unaudited)

All amounts in $ millions, unless otherwise indicated For the period ended June 30, 2017 used in investing activities until the cumulative payments exceed the acquisition date fair value of the liability. Cumulative payments in excess of the acquisition date fair value are classified as cash used in operating activities. Contingent payments classified as equity are not re-measured and settlements are accounted for within equity. When a business combination is achieved in stages, the Company re-measures its pre-existing interest at the acquisition date fair value and recognizes the resulting gain or loss, if any, in net earnings. B) Recent Accounting Pronouncements New Accounting Standards and Interpretations not yet Adopted A number of new accounting standards, amendments to accounting standards and interpretations are effective for annual periods beginning after January 1, 2017 and have not been applied in preparing the Consolidated Financial Statements for the period ended June 30, 2017. The following provides an update to the disclosure in the annual Consolidated Financial Statements for the year ended December 31, 2016. Revenue Recognition On May 28, 2014, the IASB issued IFRS 15, “Revenue From Contracts With Customers” (“IFRS 15”) replacing IAS 11, “Construction Contracts”, IAS 18, “Revenue” and several revenue-related interpretations. IFRS 15 establishes a single revenue recognition framework that applies to contracts with customers. The standard requires an entity to recognize revenue to reflect the transfer of goods and services for the amount it expects to receive, when control is transferred to the purchaser. Disclosure requirements have also been expanded. IFRS 15 is effective for annual periods beginning on or after January 1, 2018. The standard may be applied retrospectively or using a modified retrospective approach. The Company is currently evaluating the impact of adopting IFRS 15 on the Consolidated Financial Statements and plans to adopt the standard for its year ended December 31, 2018. Leases On January 13, 2016, the IASB issued IFRS 16, “Leases” (“IFRS 16”), which requires entities to recognize lease assets and lease obligations on the balance sheet. For lessees, IFRS 16 removes the classification of leases as either operating leases or finance leases, effectively treating all leases as finance leases. Certain short-term leases (less than 12 months) and leases of low-value assets are exempt from the requirements, and may continue to be treated as operating leases. Lessors will continue with a dual lease classification model. Classification will determine how and when a lessor will recognize lease revenue, and what assets would be recorded. IFRS 16 is effective for years beginning on or after January 1, 2019, with early adoption permitted if IFRS 15 has been adopted. The standard may be applied retrospectively or using a modified retrospective approach. The modified retrospective approach does not require restatement of prior period financial information as it recognizes the cumulative effect as an adjustment to opening retained earnings and applies the standard prospectively. The Company plans to apply IFRS 16 on January 1, 2019. A transition team is assessing the impacts of adopting IFRS 16 and will oversee changes to accounting systems, processes and internal controls. The estimated time and effort necessary to develop and implement required changes (including the impact to information technology systems) extends into 2018. Although the transition approach on adoption has not yet been determined, it is anticipated that the adoption of IFRS 16 will have a material impact on the Consolidated Balance Sheets. C) Key Sources of Estimation Uncertainty Critical accounting estimates are those estimates that require Management to make particularly subjective or complex judgments about matters that are inherently uncertain. Estimates and underlying assumptions are reviewed on an ongoing basis and any revisions to accounting estimates are recorded in the period in which the estimates are revised. Further to those areas discussed in the annual Consolidated Financial Statements for the year ended December 31, 2016, the estimation of fair values of the assets acquired and liabilities assumed in a business combination, including contingent payment and goodwill, is a key area involving significant estimates or judgments. Cenovus Energy Inc. Second Quarter 2017 Report Page 65 Notes to Consolidated Financial Statements

slide-66
SLIDE 66

NOTES TO CONSOLIDATED FINANCIAL STATEMENTS (unaudited)

All amounts in $ millions, unless otherwise indicated For the period ended June 30, 2017

  • 4. ACQUISITION

A) Summary of the Acquisition On March 29, 2017, Cenovus entered into a purchase and sale agreement with ConocoPhillips to acquire ConocoPhillips’ 50 percent interest in FCCL and the majority of ConocoPhillips’ Deep Basin Assets in Alberta and British Columbia (the “Acquisition”). The Acquisition was completed on May 17, 2017, with an effective date of January 1, 2017. The Acquisition provides Cenovus with control over the Company’s oil sands operations, doubles the Company’s oil sands production, and almost doubles the Company’s proved bitumen reserves. The Deep Basin Assets provide a second growth platform with more than three million net acres of land, exploration and production assets, and related infrastructure in Alberta and British Columbia. The Acquisition has been accounted for using the acquisition method pursuant to IFRS 3, “Business Combinations” (“IFRS 3”). Under the acquisition method, assets and liabilities are recorded at their fair values on the date of acquisition and the total consideration is allocated to the tangible and intangible assets acquired and liabilities

  • assumed. The excess of consideration given over the fair value of the net assets acquired has been recorded as

goodwill. B) Identifiable Assets Acquired and Liabilities Assumed The preliminary purchase price allocation is based on management’s best estimate of fair value. Upon finalizing the fair value of net assets acquired, adjustments to initial estimates, including goodwill, may be required. The following table summarizes the recognized amounts of assets acquired and liabilities assumed at the date of the Acquisition.

May 17, As at Notes 2017 100 Percent of the Identifiable Assets Acquired and Liabilities Assumed for FCCL Cash 880 Accounts Receivable and Accrued Revenues 964 Inventories 303 E&E Assets 12 791 PP&E 13 22,417 Other Assets 6 Accounts Payable and Accrued Liabilities (445) Decommissioning Liabilities 17 (277) Other Liabilities (8) Deferred Income Taxes (2,497) 22,134 Recognized Amounts of Identifiable Assets Acquired and Liabilities Assumed for Deep Basin E&E Assets 12 3,639 PP&E 13 2,988 Accounts Payable and Accrued Liabilities (6) Decommissioning Liabilities 17 (667) 5,954 Total Identifiable Net Assets 28,088

The fair value of acquired accounts receivables and accrued revenues is $964 million, all of which was expected to be collectible at the date of acquisition. Cenovus Energy Inc. Second Quarter 2017 Report Page 66 Notes to Consolidated Financial Statements

slide-67
SLIDE 67

NOTES TO CONSOLIDATED FINANCIAL STATEMENTS (unaudited)

All amounts in $ millions, unless otherwise indicated For the period ended June 30, 2017 C) Total Consideration Total consideration for the Acquisition consisted of US$10.6 billion in cash and 208 million Cenovus common shares plus closing adjustments. At the same time, Cenovus agreed to make certain quarterly contingent payments to ConocoPhillips during the five years subsequent to May 17, 2017 if crude oil prices exceed a specific threshold. The following table summarizes the fair value of the consideration:

May 17, As at 2017 Common Shares 2,579 Cash 14,939 17,518 Estimated Contingent Payment (Note 15) 361 Total Consideration 17,879

At the date of closing, the Company issued 208 million common shares to ConocoPhillips that were accounted for at $12.40 per share, the estimated fair value for accounting purposes. Consideration paid in cash was US$10.6 billion, before closing adjustments, and was financed through a bought- deal common share offering (see Note 19) and an offering in the United States for senior unsecured notes (see Note 16). In addition, Cenovus borrowed $3.6 billion under a committed asset sale bridge credit facility. The remainder of the cash purchase price was funded with cash on hand and a draw on Cenovus’s existing committed credit facility. The estimated contingent payment related to oil sands production reflects that Cenovus agreed to make quarterly payments to ConocoPhillips during the five years subsequent to the closing date for quarters in which the average Western Canadian Select (“WCS”) crude oil price exceeds $52.00 per barrel during the quarter. The quarterly payment will be $6 million for each dollar that the WCS price exceeds $52.00 per barrel. There are no maximum payment terms. The calculation of any contingent payment includes an adjustment mechanism related to certain significant production outages at Foster Creek and Christina Lake, which may reduce the amount of a contingent payment. The terms of the contingent payment agreement allow Cenovus to retain 80 percent to 85 percent of the WCS prices above $52.00 per barrel, based on current gross production capacity at Foster Creek and Christina Lake. As production capacity increases with future expansions, the percentage of upside available to Cenovus will increase further. The contingent payment is accounted for as a financial option. The fair value of $361 million on May 17, 2017 was estimated by calculating the present value of the future expected cash flows using an option pricing model, which assumes the probability distribution for WCS is based on the volatility of West Texas Intermediate (“WTI”) options, volatility of Canadian-U.S. foreign exchange rate options and WCS futures pricing, and discounted at a credit- adjusted risk-free rate of 2.9 percent. Subsequent to the closing date, the contingent payment will be re-measured at fair value at each reporting date with changes in fair value recognized in net earnings (see Note 15). D) Goodwill Goodwill arising from the Acquisition has been recognized as follows:

May 17, As at Notes 2017 Total Purchase Consideration 4C 17,879 Fair Value of Pre-Existing 50 Percent Ownership Interest in FCCL 12,316 Fair Value of Identifiable Net Assets 4B (28,088) Goodwill 2,107

Fair Value of Pre-Existing 50 Percent Ownership Interest in FCCL Prior to the Acquisition, Cenovus’s 50 percent interest in FCCL was jointly controlled with ConocoPhillips and met the definition of a joint operation under IFRS 11, “Joint Arrangements” and as such Cenovus recognized its share of the assets, liabilities, revenues and expenses in its consolidated results. Subsequent to Acquisition, Cenovus controls FCCL, as defined under IFRS 10, “Consolidated Financial Statements” and accordingly, FCCL has been

  • consolidated. As required by IFRS 3, when an acquirer achieves control in stages, the previously held interest is re-

measured to fair value at the acquisition date with any gain or loss recognized in net earnings. The acquisition-date fair value of the previously held interest was $12.3 billion and has been included in the measurement of the total consideration transferred. Cenovus recognized a non-cash revaluation gain of $2.5 billion ($1.8 billion, after-tax)

  • n the re-measurement to fair value of its existing interest in FCCL.

Cenovus Energy Inc. Second Quarter 2017 Report Page 67 Notes to Consolidated Financial Statements

slide-68
SLIDE 68

NOTES TO CONSOLIDATED FINANCIAL STATEMENTS (unaudited)

All amounts in $ millions, unless otherwise indicated For the period ended June 30, 2017 Goodwill was recorded in connection with deferred tax liabilities arising from the difference between the purchase price allocated to the FCCL assets and liabilities based on fair value and the tax basis of these assets and liabilities. In addition, the consideration paid for FCCL included a control premium, which resulted in a higher value compared to the fair value of the net assets acquired. E) Acquisition-Related Costs The Company incurred $55 million of Acquisition-related costs, excluding common share and debt issuance costs. These costs have been included in transaction costs in the Consolidated Statements of Earnings. F) Transitional Services Under the purchase and sales agreement, Cenovus and ConocoPhillips agreed to certain transitional services where ConocoPhillips will provide certain day-to-day services required by Cenovus for a period of approximately nine

  • months. These transactions are in the normal course of operations and are measured at the exchange amounts.

In the three months ended June 30, 2017, costs related to the transitional services of approximately $10 million were recorded in general and administrative expenses. G) Revenue and Profit Contribution The acquired business contributed revenues of $663 million and net earnings of $49 million for the period from May 17, 2017 to June 30, 2017. If the closing of the Acquisition had occurred on January 1, 2017, Cenovus’s consolidated pro forma revenue and net earnings for the six months ended June 30, 2017 would have been $9.6 billion and $2.9 billion, respectively. These amounts have been calculated using results from the acquired business and adjusting them for:  Differences in accounting policies,  Additional finance costs that would have been incurred if the amounts drawn on the Company’s committed asset sale bridge credit facility and the senior unsecured notes issued to fund the Acquisition had occurred

  • n January 1, 2017,

 Additional depreciation, depletion and amortization (“DD&A”) that would have been charged assuming the fair value adjustments to PP&E and E&E assets had applied from January 1, 2017,  Accretion on the decommissioning liability if it had been assumed on January 1, 2017, and  The consequential tax effects. This pro forma information is not necessarily indicative of the results that would have been obtained if the Acquisition had actually occurred on January 1, 2017.

  • 5. FINANCE COSTS

Three Months Ended Six Months Ended For the periods ended June 30, 2017 2016 2017 2016 Interest Expense – Short-Term Borrowings and Long-Term Debt 152 83 237 171 Unwinding of Discount on Decommissioning Liabilities (Note 17) 11 6 16 13 Other 5 7 14 11 168 96 267 195

  • 6. FOREIGN EXCHANGE (GAIN) LOSS, NET

Three Months Ended Six Months Ended For the periods ended June 30, 2017 2016 2017 2016 Unrealized Foreign Exchange (Gain) Loss on Translation of: U.S. Dollar Debt Issued From Canada (279) 18 (335) (395) Other (117)

  • (133)

4 Unrealized Foreign Exchange (Gain) Loss (396) 18 (468) (391) Realized Foreign Exchange (Gain) Loss (14) 2 (18) 8 (410) 20 (486) (383)

Cenovus Energy Inc. Second Quarter 2017 Report Page 68 Notes to Consolidated Financial Statements

slide-69
SLIDE 69

NOTES TO CONSOLIDATED FINANCIAL STATEMENTS (unaudited)

All amounts in $ millions, unless otherwise indicated For the period ended June 30, 2017

  • 7. IMPAIRMENT CHARGES

A) Cash-Generating Unit Impairments 2017 Impairments As at June 30, 2017, there were no CGU impairments. For the purpose of impairment testing, goodwill is allocated to the CGU to which it relates. There were no goodwill impairments for the six months ended June 30, 2017. 2016 Upstream Impairments Due to a decline in forward commodity prices as at March 31, 2016, the Company tested its upstream CGUs for

  • impairment. The Company determined that the carrying amount of the Northern Alberta CGU exceeded its

recoverable amount, resulting in an impairment loss of $170 million. The impairment was recorded as additional DD&A in the Conventional segment, which has been classified as a discontinued operation. As at March 31, 2016, the recoverable amount of the Northern Alberta CGU was estimated to be approximately $1.3 billion based on the fair value less costs of disposal. The fair value of producing properties was calculated based on discounted after-tax cash flows of proved and probable reserves using forward prices and cost estimates, prepared by Cenovus’s independent qualified reserves evaluators (Level 3). Future cash flows were estimated using a two percent inflation rate and discounted using a rate of 10 percent. Forward prices as at March 31, 2016 used to determine future cash flows from crude oil and natural gas reserves were:

Remainder

  • f 2016

2017 2018 2019 2020 Average Annual % Change to 2026 WTI (US$/barrel) 45.00 51.00 59.80 66.30 70.40 3.9% WCS (C$/barrel) 43.40 50.10 57.00 63.60 65.50 4.0% AECO (C$/Mcf) (1) (2) 2.10 3.00 3.35 3.65 3.75 3.7%

(1)

Alberta Energy Company (“AECO”) natural gas.

(2)

Assumes gas heating value of one million British Thermal Units per thousand cubic feet.

There were no impairments of goodwill for the six months ended June 30, 2016. B) Asset Impairment For the six months ended June 30, 2017, $2 million of previously capitalized E&E costs were deemed not to be technically feasible and commercially viable. This impairment loss was recorded as exploration expense in the Conventional segment, which has been classified as a discontinued operation (2016 – nil).

  • 8. ASSETS HELD FOR SALE AND DISCONTINUED OPERATIONS

Concurrent with the announcement of the Acquisition on March 29, 2017, Cenovus commenced marketing for sale certain non-core properties comprising its Pelican Lake heavy oil assets, including the adjacent Grand Rapids project in the Greater Pelican Lake region, and its Suffield crude oil and natural gas assets. On June 20, 2017, the Company announced its intent to divest the remainder of its Conventional segment assets, including its Palliser asset in southern Alberta and its Weyburn oil operation in southern Saskatchewan. As a result, the Conventional segment has been classified as held for sale and a discontinued operation. The assets have been recorded at the lesser of their carrying amount and their fair value less costs to sell. No impairment was recorded. Cenovus Energy Inc. Second Quarter 2017 Report Page 69 Notes to Consolidated Financial Statements

slide-70
SLIDE 70

NOTES TO CONSOLIDATED FINANCIAL STATEMENTS (unaudited)

All amounts in $ millions, unless otherwise indicated For the period ended June 30, 2017 A) Results of Discontinued Operations

Three Months Ended Six Months Ended For the periods ended June 30, 2017 2016 2017 2016 Revenues Gross Sales 386 294 760 568 Less: Royalties 50 33 100 53 336 261 660 515 Expenses Transportation and Blending 54 45 105 92 Operating 115 107 225 229 Production and Mineral Taxes 5 3 10 5 (Gain) Loss on Risk Management 3 (11) 16 (50) Operating Margin 159 117 304 239 Depreciation, Depletion and Amortization 69 143 190 465 Exploration Expense (1)

  • 2
  • Finance Costs

12 26 33 51 Earnings (Loss) From Discontinued Operations Before Income Tax 79 (52) 79 (277) Current Tax Expense (Recovery) 17 29 22 60 Deferred Tax Expense (Recovery) 3 (45) (2) (147) Net Earnings (Loss) From Discontinued Operations 59 (36) 59 (190)

B) Assets and Liabilities Held for Sale As at June 30, 2017, assets and liabilities held for sale consist of the following:

E&E Assets PP&E Decommissioning Liabilities Description Segment (Note 12) (Note 13) (Note 17) Conventional Conventional 11 3,039 1,418 Oil Sands Oil Sands 259 69 16 270 3,108 1,434

The Conventional assets and liabilities relate to the Suffield, Pelican Lake and Palliser areas in Alberta, and the Weyburn area in Saskatchewan. The Oil Sands assets and liabilities relate to the Grand Rapids project in Alberta. C) Cash Flows From Discontinued Operations Cash flows from discontinued operations reported in the consolidated statement of cash flows are:

Three Months Ended Six Months Ended For the periods ended June 30, 2017 2016 2017 2016 Cash From Operating Activities 137 84 270 172 Cash Used in Investing Activities (50) (31) (138) (70) Net Cash Flow 87 53 132 102

Cenovus Energy Inc. Second Quarter 2017 Report Page 70 Notes to Consolidated Financial Statements

slide-71
SLIDE 71

NOTES TO CONSOLIDATED FINANCIAL STATEMENTS (unaudited)

All amounts in $ millions, unless otherwise indicated For the period ended June 30, 2017

  • 9. INCOME TAXES

The provision for income taxes is:

Three Months Ended Six Months Ended For the periods ended June 30, 2017 2016 2017 2016 Current Tax Canada (183) (59) (209) (116) United States

  • 1

(1) 1 Total Current Tax Expense (Recovery) (183) (58) (210) (115) Deferred Tax Expense (Recovery) 865 (7) 941 (96) Tax Expense (Recovery) From Continuing Operations 682 (65) 731 (211)

The following table reconciles income taxes calculated at the Canadian statutory rate with recorded income taxes:

Six Months Ended For the periods ended June 30, 2017 2016 Earnings (Loss) From Continuing Operations Before Income Tax 3,523 (406) Canadian Statutory Rate 27.0% 27.0% Expected Income Tax (Recovery) 951 (110) Effect of Taxes Resulting From: Foreign Tax Rate Differential (35) (23) Non-Taxable Capital (Gains) Losses (88) (53) Non-Recognition of Capital (Gains) Losses (63) (53) Recognition of Previously Unrecognized Capital Losses (63)

  • Non-Deductible Expenses

10 5 Other 19 23 Tax Expense (Recovery) From Continuing Operations 731 (211) Effective Tax Rate 20.7% 52.0%

  • 10. PER SHARE AMOUNTS

A) Net Earnings (Loss) Per Share – Basic and Diluted

Three Months Ended Six Months Ended For the periods ended June 30, 2017 2016 2017 2016 Earnings (Loss) From: Continuing Operations 2,581 (231) 2,792 (195) Discontinued Operations 59 (36) 59 (190) Net Earnings (Loss) 2,640 (267) 2,851 (385) Weighted Average Number of Shares (millions) 1,113.3 833.3 974.1 833.3 Basic and Diluted Earnings (Loss) Per Share From: ($) Continuing Operations 2.32 (0.28) 2.87 (0.23) Discontinued Operations 0.05 (0.04) 0.06 (0.23) Net Earnings (Loss) Per Share 2.37 (0.32) 2.93 (0.46)

B) Dividends Per Share For the six months ended June 30, 2017, the Company paid dividends of $102 million or $0.10 per share (six months ended June 30, 2016 – $83 million or $0.10 per share). Cenovus Energy Inc. Second Quarter 2017 Report Page 71 Notes to Consolidated Financial Statements

slide-72
SLIDE 72

NOTES TO CONSOLIDATED FINANCIAL STATEMENTS (unaudited)

All amounts in $ millions, unless otherwise indicated For the period ended June 30, 2017

  • 11. INVENTORIES

Cenovus recorded a $2 million write-down of product inventories to net realizable value as at June 30, 2017. As at December 31, 2016, Cenovus recorded a $4 million write-down of its product inventory.

  • 12. EXPLORATION AND EVALUATION ASSETS

Total As at December 31, 2016 1,585 Additions 76 Acquisition (Note 4) (1) 4,430 Transfers to Assets Held for Sale (Note 8) (270) Exploration Expense (Note 7) (2) Change in Decommissioning Liabilities (2) Divestitures (1) (479) As at June 30, 2017 5,338

(1)

In connection with the Acquisition, Cenovus was deemed to have disposed of its pre-existing interest in FCCL and re-acquired it at fair value as required by IFRS 3.

  • 13. PROPERTY, PLANT AND EQUIPMENT, NET

Upstream Assets Development & Production Other Upstream Refining Equipment Other (1) Total COST As at December 31, 2016 31,941 333 5,259 1,074 38,607 Additions 462

  • 85

17 564 Acquisition (Note 4) (2) 25,405

  • 25,405

Transfers to Assets Held for Sale (Note 8) (19,049)

  • (19,049)

Change in Decommissioning Liabilities (105)

  • 1

(1) (105) Exchange Rate Movements and Other 1

  • (189)
  • (188)

Divestitures (2) (12,213)

  • (12,213)

As at June 30, 2017 26,442 333 5,156 1,090 33,021 ACCUMULATED DEPRECIATION, DEPLETION AND AMORTIZATION As at December 31, 2016 20,088 308 1,076 709 22,181 DD&A 663 15 105 36 819 Transfers to Assets Held for Sale (Note 8) (15,941)

  • (15,941)

Exchange Rate Movements and Other 4

  • (50)
  • (46)

Divestitures (2) (3,611)

  • (3,611)

As at June 30, 2017 1,203 323 1,131 745 3,402 CARRYING VALUE As at December 31, 2016 11,853 25 4,183 365 16,426 As at June 30, 2017 25,239 10 4,025 345 29,619

(1)

Includes crude-by-rail terminal, office furniture, fixtures, leasehold improvements, information technology and aircraft.

(2)

In connection with the Acquisition, Cenovus was deemed to have disposed of its pre-existing interest in FCCL and re-acquired it at fair value as required by IFRS 3.

  • 14. GOODWILL

June 30, December 31, As at 2017 2016 Carrying Value, Beginning of Period 242 242 Goodwill Recognized on Acquisition (Note 4) 2,107

  • Carrying Value, End of Period

2,349 242

Cenovus Energy Inc. Second Quarter 2017 Report Page 72 Notes to Consolidated Financial Statements

slide-73
SLIDE 73

NOTES TO CONSOLIDATED FINANCIAL STATEMENTS (unaudited)

All amounts in $ millions, unless otherwise indicated For the period ended June 30, 2017 The carrying amount of goodwill allocated to the Company’s exploration and production CGUs is:

June 30, December 31, As at 2017 2016 Primrose (Foster Creek) 1,110 242 Christina Lake 1,037

  • Narrows Lake

202

  • 2,349

242

  • 15. CONTINGENT PAYMENT

As at January 1, 2017

  • Initial Recognition on May 17, 2017 (Note 4)

361 Re-measurement (1) (66) Payments

  • As at June 30, 2017

295 Less: Current Portion 60 Long-Term Portion 235

(1)

Contingent payment is carried at fair value. Changes in fair value are recorded in net earnings.

In connection with the Acquisition (see Note 4), Cenovus agreed to make quarterly payments to ConocoPhillips during the five years subsequent to May 17, 2017 for quarters in which the average WCS crude oil price exceeds $52.00 per barrel during the quarter. The quarterly payment will be $6 million for each dollar that the WCS price exceeds $52.00 per barrel. There are no maximum payment terms. In the three months ended June 30, 2017, WCS averaged less than $52 per barrel; therefore, no amount was payable. The estimated quarterly WCS forward prices in the next 12 months range between approximately $44 per barrel and $46 per barrel. The calculation includes an adjustment mechanism related to certain significant production outages at Foster Creek and Christina Lake which may reduce the amount of a contingent payment.

  • 16. LONG-TERM DEBT

US$ Principal Amount June 30, December 31, As at June 30, 2017 2017 2016 Revolving Term Debt (1) A

  • Asset Sale Bridge Credit Facility

B

  • 3,600
  • U.S. Dollar Denominated Unsecured Notes

C 7,650 9,927 6,378 Total Debt Principal 13,527 6,378 Debt Discounts and Transaction Costs (114) (46) 13,413 6,332 Less: Current Portion, Net of Transaction Costs 893

  • Long-Term Debt

12,520 6,332

(1)

Revolving term debt may include Bankers’ Acceptances, London Interbank Offered Rate based loans, prime rate loans and U.S. base rate loans.

Consideration for the Acquisition (see Note 4) was partially financed through borrowings under the Company’s committed asset sale bridge credit facility and an offering in the United States for senior unsecured notes, as well as its existing committed credit facility. Debt issuance costs related to the Acquisition financing were $71 million. These costs will be included with the current portion of long-term debt and long-term debt and amortized using the effective interest method. A) Revolving Term Debt On April 28, 2017, Cenovus amended its existing committed credit facility to increase the capacity of the facility by $0.5 billion to $4.5 billion and to extend the maturity dates. The committed credit facility consists of a $1.2 billion tranche maturing on November 30, 2020 and a $3.3 billion tranche maturing on November 30, 2021. As at June 30, 2017, Cenovus had $4.5 billion available on its committed credit facility. Cenovus Energy Inc. Second Quarter 2017 Report Page 73 Notes to Consolidated Financial Statements

slide-74
SLIDE 74

NOTES TO CONSOLIDATED FINANCIAL STATEMENTS (unaudited)

All amounts in $ millions, unless otherwise indicated For the period ended June 30, 2017 B) Asset Sale Bridge Credit Facility In connection with the Acquisition, Cenovus borrowed $3.6 billion under a committed asset sale bridge credit

  • facility. The committed asset sale bridge credit facility consists of a $0.9 billion tranche maturing on May 17, 2018,

a $1.8 billion tranche maturing on November 17, 2018, and a $0.9 billion tranche maturing on May 17, 2019. Cenovus expects to repay the committed asset sale bridge credit facility through the sale of certain assets (see Note 8). C) Unsecured Notes On February 24, 2016, Cenovus filed a base shelf prospectus. The base shelf prospectus allows the Company to

  • ffer, from time to time, up to US$5.0 billion, or the equivalent in other currencies, of debt securities, common

shares, preferred shares, subscription receipts, warrants, share purchase contracts and units in Canada, the U.S. and elsewhere where permitted by law. The base shelf prospectus will expire in March 2018. As at June 30, 2017, US$2.8 billion was available under the base shelf prospectus. On April 7, 2017, Cenovus completed an offering in the United States for US$2.9 billion in senior unsecured notes in three series, as follows:

US$ Principal June 30, As at Amount 2017 4.25% due 2027 1,200 1,557 5.25% due 2037 700 908 5.40% due 2047 1,000 1,298 2,900 3,763

As at June 30, 2017, the Company is in compliance with all of the terms of its debt agreements.

  • 17. DECOMMISSIONING LIABILITIES

The decommissioning provision represents the present value of the expected future costs associated with the retirement of upstream crude oil and natural gas assets, refining facilities and the crude-by-rail terminal. The aggregate carrying amount of the obligation is:

Total As at December 31, 2016 1,847 Liabilities Incurred 6 Liabilities Acquired (Note 4) (1) 944 Liabilities Settled (38) Liabilities Divested (1) (138) Transfers to Liabilities Related to Assets Held for Sale (Note 8) (1,434) Change in Estimated Future Cash Flows (14) Change in Discount Rate (99) Unwinding of Discount on Decommissioning Liabilities 49 Foreign Currency Translation (1) As at June 30, 2017 1,122

(1)

In connection with the Acquisition, Cenovus was deemed to have disposed of its pre-existing interest in FCCL and reacquired it at fair value as required by IFRS.

The undiscounted amount of estimated future cash flows required to settle the obligation has been discounted using a credit-adjusted risk-free rate of 6.0 percent as at June 30, 2017 (December 31, 2016 – 5.9 percent). Cenovus Energy Inc. Second Quarter 2017 Report Page 74 Notes to Consolidated Financial Statements

slide-75
SLIDE 75

NOTES TO CONSOLIDATED FINANCIAL STATEMENTS (unaudited)

All amounts in $ millions, unless otherwise indicated For the period ended June 30, 2017

  • 18. OTHER LIABILITIES

June 30, December 31, As at 2017 2016 Employee Long-Term Incentives 23 72 Pension and Other Post-Employment Benefit Plan 88 71 Onerous Contract Provisions 37 35 Other 34 33 182 211

  • 19. SHARE CAPITAL

A) Authorized Cenovus is authorized to issue an unlimited number of common shares, and first and second preferred shares not exceeding, in aggregate, 20 percent of the number of issued and outstanding common shares. The first and second preferred shares may be issued in one or more series with rights and conditions to be determined by the Company’s Board of Directors prior to issuance and subject to the Company’s articles. B) Issued and Outstanding

June 30, 2017 December 31, 2016 As at Number of Common Shares (thousands) Amount Number of Common Shares (thousands) Amount Outstanding, Beginning of Period 833,290 5,534 833,290 5,534 Common Shares Issued, Net of Issuance Costs and Tax 187,500 2,927

  • Common Shares Issued to ConocoPhillips

208,000 2,579

  • Outstanding, End of Period

1,228,790 11,040 833,290 5,534

In connection with the Acquisition (see Note 4), Cenovus closed a bought-deal common share financing on April 6, 2017 for 187.5 million common shares, raising gross proceeds of $3.0 billion ($2.9 billion net of $101 million of share issuance costs). In addition, the Company issued 208 million common shares to ConocoPhillips on May 17, 2017 as partial consideration for the Acquisition. In relation to the share consideration, Cenovus and ConocoPhillips entered into an investor agreement, and a registration rights agreement which, among other things, restricts ConocoPhillips from selling or hedging its Cenovus common shares until November 17, 2017. ConocoPhillips is also restricted from nominating new members to Cenovus’s Board of Directors and must vote its Cenovus common shares in accordance with management recommendations or abstain from voting until such time ConocoPhillips owns 3.5 percent or less of the then outstanding common shares of Cenovus. There were no preferred shares outstanding as at June 30, 2017 (December 31, 2016 – nil). As at June 30, 2017, there were 13 million (December 31, 2016 – 12 million) common shares available for future issuance under the stock option plan. Cenovus Energy Inc. Second Quarter 2017 Report Page 75 Notes to Consolidated Financial Statements

slide-76
SLIDE 76

NOTES TO CONSOLIDATED FINANCIAL STATEMENTS (unaudited)

All amounts in $ millions, unless otherwise indicated For the period ended June 30, 2017

  • 20. ACCUMULATED OTHER COMPREHENSIVE INCOME (LOSS)

Defined Benefit Pension Plan Foreign Currency Translation Adjustment Available for Sale Financial Assets Total As at December 31, 2015 (10) 1,014 16 1,020 Other Comprehensive Income (Loss), Before Tax (17) (240) (5) (262) Income Tax 5

  • 1

6 As at June 30, 2016 (22) 774 12 764 As at December 31, 2016 (13) 908 15 910 Other Comprehensive Income (Loss), Before Tax (12) (142)

  • (154)

Income Tax 3

  • 3

As at June 30, 2017 (22) 766 15 759

  • 21. STOCK-BASED COMPENSATION PLANS

Cenovus has a number of stock-based compensation plans which include stock options with associated net settlement rights (“NSRs”), stock options with associated tandem stock appreciation rights (“TSARs”), performance share units (“PSUs”), restricted share units (“RSUs”) and deferred share units (“DSUs”). The following table summarizes information related to Cenovus’s stock-based compensation plans:

As at June 30, 2017 Units Outstanding (thousands) Units Exercisable (thousands) NSRs 43,930 36,862 TSARs 234 234 PSUs 7,005

  • RSUs

5,963

  • DSUs

1,613 1,613 For the six months ended June 30, 2017 Units Granted (thousands) Units Vested and Paid Out (thousands) NSRs 2,822

  • PSUs

2,199 451 RSUs 2,338 101 DSUs 111 110

Certain directors, officers or employees chose prior to December 31, 2016 to convert a portion of their remuneration, paid in the first quarter of 2017, into DSUs. The election for any particular year is irrevocable. DSUs may not be redeemed until departure from the Company. Directors also received an annual grant of DSUs. The weighted average exercise price of NSRs and TSARs as at June 30, 2017 was $29.58 and $30.68, respectively. The following table summarizes the stock-based compensation expense (recovery) recorded for all plans:

Three Months Ended Six Months Ended For the periods ended June 30, 2017 2016 2017 2016 NSRs 4 4 6 8 PSUs (6) 8 (12)

  • RSUs

(3) 2 (6) 5 DSUs (10) 3 (17) 2 Stock-Based Compensation Expense (Recovery) (15) 17 (29) 15 Stock-Based Compensation Costs Capitalized (3) 5 (4) 4 Total Stock-Based Compensation (18) 22 (33) 19

Cenovus Energy Inc. Second Quarter 2017 Report Page 76 Notes to Consolidated Financial Statements

slide-77
SLIDE 77

NOTES TO CONSOLIDATED FINANCIAL STATEMENTS (unaudited)

All amounts in $ millions, unless otherwise indicated For the period ended June 30, 2017

  • 22. CAPITAL STRUCTURE

Cenovus’s capital structure objectives and targets have remained unchanged from previous periods. Cenovus’s capital structure consists of Shareholders’ Equity plus Debt. Debt is defined as short-term borrowings, and the current and long-term portions of long-term debt. Net debt includes the Company’s short-term borrowings, and the current and long-term portions of long-term debt, net of cash and cash equivalents. Cenovus’s objectives when managing its capital structure are to maintain financial flexibility, preserve access to capital markets, ensure its ability to finance internally generated growth and to fund potential acquisitions while maintaining the ability to meet the Company’s financial obligations as they come due. Cenovus monitors its capital structure and financing requirements using, among other things, non-GAAP financial measures consisting of Debt to Capitalization and Debt to Adjusted Earnings Before Interest, Taxes and DD&A (“Adjusted EBITDA”). These measures are used to steward Cenovus’s overall debt position as measures of Cenovus’s overall financial strength. Over the long term, Cenovus targets a Debt to Capitalization ratio of between 30 and 40 percent and a Debt to Adjusted EBITDA ratio of between 1.0 and 2.0 times. At different points within the economic cycle, Cenovus expects these ratios may periodically be outside of the target range. A) Debt to Capitalization and Net Debt to Capitalization

June 30, December 31, As at 2017 2016 Current Portion Long-Term Debt 893

  • Long-Term Debt

12,520 6,332 Debt 13,413 6,332 Shareholders’ Equity 19,701 11,590 33,114 17,922 Debt to Capitalization 41% 35% Debt 13,413 6,332 Add (Deduct): Cash and Cash Equivalents (489) (3,720) Net Debt 12,924 2,612 Shareholders’ Equity 19,701 11,590 32,625 14,202 Net Debt to Capitalization 40% 18%

B) Debt to Adjusted EBITDA and Net Debt to Adjusted EBITDA

June 30, December 31, As at 2017 2016 Debt 13,413 6,332 Net Debt 12,924 2,612 Net Earnings (Loss) 2,691 (545) Add (Deduct): Finance Costs 546 492 Interest Income (61) (52) Income Tax Expense (Recovery) 667 (382) DD&A 1,407 1,498 E&E Impairment 3 2 Unrealized (Gain) Loss on Risk Management (290) 554 Foreign Exchange (Gain) Loss, Net (301) (198) Revaluation (Gain) (2,524)

  • Re-measurement of Contingent Payment

(66)

  • (Gain) Loss on Divestitures of Assets

6 6 Other (Income) Loss, Net 30 34 Adjusted EBITDA (1) 2,108 1,409 Debt to Adjusted EBITDA 6.4x 4.5x Net Debt to Adjusted EBITDA 6.1x 1.9x

(1)

Calculated on a trailing twelve-month basis. Includes discontinued operations.

Cenovus Energy Inc. Second Quarter 2017 Report Page 77 Notes to Consolidated Financial Statements

slide-78
SLIDE 78

NOTES TO CONSOLIDATED FINANCIAL STATEMENTS (unaudited)

All amounts in $ millions, unless otherwise indicated For the period ended June 30, 2017 As at June 30, 2017, Cenovus’s debt to adjusted EBITDA and net debt to adjusted EBITDA are 6.4x and 6.1x,

  • respectively. These ratios are well outside our target range. However, it is important to note that adjusted EBITDA

is calculated on a rolling twelve month basis and as such, only includes the financial results from the Deep Basin Assets and the additional 50 percent of FCCL for the period May 17, 2017 to June 30, 2017. Debt and net debt are presented as at June 30, 2017; therefore, the ratios are fully burdened by the debt issued to finance the

  • Acquisition. If adjusted EBITDA reflected a full twelve months of earnings from the acquired assets, Cenovus’s debt

and net debt to adjusted EBITDA ratios would be substantially lower. Cenovus will maintain a high level of capital discipline and manage its capital structure to help ensure sufficient liquidity through all stages of the economic cycle. To manage its capital structure, Cenovus may, among other actions, adjust capital and operating spending, adjust dividends paid to shareholders, purchase shares for cancellation pursuant to normal course issuer bids, issue new shares, issue new debt, draw down on its credit facility or repay existing debt. Cenovus has in place a committed credit facility that consists of a $1.2 billion tranche maturing on November 30, 2020 and a $3.3 billion tranche maturing on November 30, 2021. As at June 30, 2017, Cenovus had $4.5 billion available on its committed credit facility. Under the committed credit facility, the Company is required to maintain a debt to capitalization ratio, as defined in the agreement, not to exceed 65 percent. The Company is well below this limit. In addition, the Company has in place a base shelf prospectus, the availability of which is dependent on market

  • conditions. As at June 30, 2017, US$2.8 billion remains available under the base shelf prospectus.

As at June 30, 2017, Cenovus is in compliance with all of the terms of its debt agreements.

  • 23. FINANCIAL INSTRUMENTS

Cenovus’s financial assets and financial liabilities consist of cash and cash equivalents, accounts receivable and accrued revenues, accounts payable and accrued liabilities, risk management assets and liabilities, available for sale financial assets, long-term receivables, contingent payment, short-term borrowings and long-term debt. Risk management assets and liabilities arise from the use of derivative financial instruments. A) Fair Value of Non-Derivative Financial Instruments The fair values of cash and cash equivalents, accounts receivable and accrued revenues, accounts payable and accrued liabilities, and short-term borrowings approximate their carrying amount due to the short-term maturity of these instruments. The fair values of long-term receivables approximate their carrying amount due to the specific non-tradeable nature of these instruments. Long-term debt is carried at amortized cost. The estimated fair values of long-term borrowings have been determined based on period-end trading prices of long-term borrowings on the secondary market (Level 2). As at June 30, 2017, the carrying value of Cenovus’s debt was $13,413 million and the fair value was $13,220 million (December 31, 2016 carrying value – $6,332 million, fair value – $6,539 million). Available for sale financial assets comprise private equity investments. These assets are carried at fair value on the Consolidated Balance Sheets in other assets. Fair value is determined based on recent private placement transactions (Level 3) when available. There were no changes to the fair value of available for sale financial assets in the six months ended June 30, 2017. B) Fair Value of Risk Management Assets and Liabilities The Company’s risk management assets and liabilities consist of crude oil swaps and options, as well as condensate, natural gas and interest rate swaps. Crude oil, condensate and natural gas contracts are recorded at their estimated fair value based on the difference between the contracted price and the period-end forward price for the same commodity, using quoted market prices or the period-end forward price for the same commodity extrapolated to the end of the term of the contract (Level 2). The fair value of interest rate swaps are calculated using external valuation models which incorporate observable market data, including interest rate yield curves (Level 2). Cenovus Energy Inc. Second Quarter 2017 Report Page 78 Notes to Consolidated Financial Statements

slide-79
SLIDE 79

NOTES TO CONSOLIDATED FINANCIAL STATEMENTS (unaudited)

All amounts in $ millions, unless otherwise indicated For the period ended June 30, 2017 Summary of Unrealized Risk Management Positions

June 30, 2017 December 31, 2016 Risk Management Risk Management As at Asset Liability Net Asset Liability Net Crude Oil 182 1 181 21 307 (286) Interest Rate 2 17 (15) 3 8 (5) Total Fair Value 184 18 166 24 315 (291)

The following table presents the Company’s fair value hierarchy for risk management assets and liabilities carried at fair value:

June 30, December 31, As at 2017 2016 Level 2 – Prices Sourced From Observable Data or Market Corroboration 166 (291)

Prices sourced from observable data or market corroboration refers to the fair value of contracts valued in part using active quotes and in part using observable, market-corroborated data. The following table provides a reconciliation of changes in the fair value of Cenovus’s risk management assets and liabilities from January 1 to June 30:

2017 2016 Fair Value of Contracts, Beginning of Year (291) 271 Fair Value of Contracts Realized During the Period (1) (60) (158) Change in Fair Value of Contracts in Place at Beginning of Year and Contracts Entered Into During the Period 471 (275) Unamortized Premium on Put Options 37

  • Unrealized Foreign Exchange Gain (Loss) on U.S. Dollar Contracts

9 (13) Fair Value of Contracts, End of Period 166 (175)

(1)

Includes realized loss of $16 million related to the Conventional segment which is included in Discontinued Operations.

C) Fair Value of Contingent Payment The contingent payment is carried at fair value on the Consolidated Balance Sheets. Fair value is estimated by calculating the present value of the future expected cash flows using an option pricing model (Level 3), which assumes the probability distribution for WCS is based on the volatility of WTI options, volatility of Canadian-U.S. foreign exchange rate options and WCS futures pricing, and discounted at a credit-adjusted risk-free rate of 2.9 percent. Fair value of the contingent payment has been calculated by Cenovus’s internal valuation team which consists of individuals who are knowledgeable and have experience in fair value techniques. As at June 30, 2017, the fair value of contingent payment was estimated to be $295 million. As at June 30, 2017, average WCS forward pricing for the remaining term of the contingent payment is US$32.25 per barrel or C$43.86 per barrel. The volatility of WTI options and the Canadian-U.S. foreign exchange rates was 27 percent and nine percent, respectively. Changes in the following inputs to the option pricing model, with fluctuations in all other variables held constant, could have resulted in unrealized gains (losses) impacting earnings before income tax as follows:

Sensitivity Range Increase Decrease WCS Forward Prices  $5.00 per bbl (206) 153 WTI Option Volatility  five percent (205) 160 U.S. to Canadian Dollar Foreign Exchange Rate Volatility  five percent 18 (39)

Cenovus Energy Inc. Second Quarter 2017 Report Page 79 Notes to Consolidated Financial Statements

slide-80
SLIDE 80

NOTES TO CONSOLIDATED FINANCIAL STATEMENTS (unaudited)

All amounts in $ millions, unless otherwise indicated For the period ended June 30, 2017 D) Earnings Impact of (Gains) Losses From Risk Management Positions

Three Months Ended Six Months Ended For the periods ended June 30, 2017 2016 2017 2016 Realized (Gain) Loss (1) (155) 18 (76) (108) Unrealized (Gain) Loss (2) (132) 284 (411) 433 (Gain) Loss on Risk Management (287) 302 (487) 325

(1)

Realized gains and losses on risk management are recorded in the reportable segment to which the derivative instrument relates. Excludes realized risk management losses of $16 million in the six months ended June 30, 2017 (six months ended June 30, 2016 – $50 million gain) that were classified as discontinued operations.

(2)

Unrealized gains and losses on risk management are recorded in the Corporate and Eliminations segment.

  • 24. RISK MANAGEMENT

Cenovus is exposed to financial risks, including market risk related to commodity prices, foreign exchange rates, interest rates as well as credit risk and liquidity risk. A description of the nature and extent of risks arising from the Company’s financial assets and liabilities can be found in the notes to the annual Consolidated Financial Statements as at December 31, 2016. Exposure to these risks has not changed significantly since December 31, 2016. To manage exposure to interest rate volatility, the Company entered into interest rate swap contracts related to expected future debt issuances. As at June 30, 2017, Cenovus had a notional amount of US$400 million in interest rate swaps. To mitigate the Company’s exposure to foreign exchange rate fluctuations, the Company periodically enters into foreign exchange contracts. Net Fair Value of Risk Management Positions

As at June 30, 2017 Notional Volumes Terms Average Price Fair Value Crude Oil Contracts Fixed Price Contracts Brent Fixed Price 78,000 bbls/d July – December 2017 US$52.41/bbl 55 Brent Fixed Price 10,000 bbls/d January – June 2018 US$54.06/bbl 8 WTI Fixed Price 25,000 bbls/d January – June 2018 US$46.72/bbl (7) WTI Fixed Price 3,000 bbls/d July – December 2018 US$48.09/bbl

  • Brent-WTI Differential

50,000 bbls/d July – December 2017 US$(1.88)/bbl (10) Brent Put Options 55,000 bbls/d July – December 2017 US$53.00/bbl 66 Brent Collars 30,000 bbls/d January – June 2018 US$49.78 – US$62.08/bbl 23 WTI Collars 50,000 bbls/d July – December 2017 US$44.84 – US$56.47/bbl 16 WTI Collars 10,000 bbls/d January – June 2018 US$45.30 – US$62.77/bbl 7 Other Financial Positions (1) 23 Crude Oil Fair Value Position 181 Natural Gas Contracts Fixed Price Contracts NYMEX Fixed Price 30 MMcf/d July – December 2017 US$3.16/Mcf

  • Interest Rate Swaps

(15) Total Fair Value 166

(1)

Other financial positions are part of ongoing operations to market the Company’s production.

Cenovus Energy Inc. Second Quarter 2017 Report Page 80 Notes to Consolidated Financial Statements

slide-81
SLIDE 81

NOTES TO CONSOLIDATED FINANCIAL STATEMENTS (unaudited)

All amounts in $ millions, unless otherwise indicated For the period ended June 30, 2017 Sensitivities – Risk Management Positions The following table summarizes the sensitivity of the fair value of Cenovus’s risk management positions to fluctuations in commodity prices and interest rates, with all other variables held constant. Management believes the fluctuations identified in the table below are a reasonable measure of volatility. The impact of fluctuating commodity prices and interest rates on the Company’s open risk management positions could have resulted in unrealized gains (losses) impacting earnings before income tax as follows: Risk Management Positions in Place as at June 30, 2017

Sensitivity Range Increase Decrease Crude Oil Commodity Price  US$5.00 per bbl Applied to Brent, WTI and Condensate Hedges (249) 277 Crude Oil Differential Price  US$2.50 per bbl Applied to Differential Hedges Tied to Production (2) 2 Crude Oil Differential Price  US$1.00 per bbl Applied to Brent-WTI Differential 12 (12) Natural Gas Commodity Price  US$1.00 per Mcf Applied to NYMEX and AECO Gas Hedges (7) 7 Interest Rate Swaps  50 Basis Points 45 (51)

  • 25. SUPPLEMENTARY CASH FLOW INFORMATION

The following table provides a reconciliation of liabilities to cash flows arising from financing activities:

Current Portion of Dividends Long-Term Long-Term Share Payable Debt Debt Capital As at December 31, 2015

  • 6,525

5,534 Changes From Financing Cash Flows: Dividends Paid (83)

  • Non-Cash Changes:

Dividends Declared 83

  • Unrealized Foreign Exchange (Gain) Loss (Note 6)
  • (395)
  • Other
  • 2
  • As at June 30, 2016
  • 6,132

5,534 As at December 31, 2016

  • 6,332

5,534 Changes From Financing Cash Flows: Issuance of Long-Term Debt

  • 3,842
  • Net Issuance (Repayment) of Revolving Long-Term Debt
  • 30
  • Issuance of Debt Under Asset Sale Bridge Facility
  • 892

2,677

  • Common Shares Issued, Net of Issuance Costs
  • 2,899

Dividends Paid on Common Shares (102)

  • Non-Cash Changes:

Common Shares Issued to ConocoPhillips

  • 2,579

Deferred Taxes on Share Issuance Costs

  • 28

Dividends Declared 102

  • Unrealized Foreign Exchange (Gain) Loss
  • (365)
  • Other
  • 1

4

  • As at June 30, 2017
  • 893

12,520 11,040

Cenovus Energy Inc. Second Quarter 2017 Report Page 81 Notes to Consolidated Financial Statements

slide-82
SLIDE 82

NOTES TO CONSOLIDATED FINANCIAL STATEMENTS (unaudited)

All amounts in $ millions, unless otherwise indicated For the period ended June 30, 2017

  • 26. COMMITMENTS AND CONTINGENCIES

A) Commitments Cenovus has entered into various commitments in the normal course of operations primarily related to demand charges on firm transportation agreements. In addition, the Company has commitments related to its risk management program and an obligation to fund its defined benefit pension and other post-employment benefit

  • plans. Additional information related to the Company’s commitments can be found in the notes to the annual

Consolidated Financial Statements for the year ended December 31, 2016. As at June 30, 2017, total commitments were $29.9 billion, of which $26.4 billion were for various transportation

  • commitments. During the six months ended June 30, 2017, in relation to the Acquisition, Cenovus assumed

commitments of $3.7 billion, primarily consisting of transportation commitments on various pipelines. This increase in commitments was offset by our withdrawal from certain transportation initiatives and use of contracts. Transportation commitments include $16 billion that are subject to regulatory approval or have been approved but are not yet in service (December 31, 2016 – $19 billion). Terms are up to 20 years subsequent to the date of commencement and should help align our future transportation requirements with our anticipated production growth. As at June 30, 2017, there were outstanding letters of credit aggregating $246 million issued as security for performance under certain contracts (December 31, 2016 – $258 million). B) Contingencies Legal Proceedings Cenovus is involved in a limited number of legal claims associated with the normal course of operations. Cenovus believes that any liabilities that might arise from such matters, to the extent not provided for, are not likely to have a material effect on its Consolidated Financial Statements. Contingent Payment In connection with the Acquisition, Cenovus agreed to make quarterly payments to ConocoPhillips during the five years subsequent to May 17, 2017 for quarters in which the average WCS crude oil price exceeds $52.00 per barrel during the quarter. As at June 30, 2017, the estimated fair value of the contingent payment was $295 million (see Note 15). Cenovus Energy Inc. Second Quarter 2017 Report Page 82 Notes to Consolidated Financial Statements

slide-83
SLIDE 83

SUPPLEMENTAL INFORMATION (unaudited)

Financial Statistics

($ millions, except per share amounts)

Revenues

YTD Q2 Q1 Year Q4 Q3 Q2 YTD Q2 Q1 Gross Sales Oil Sands 2,728 1,666 1,062 2,929 957 793 1,179 709 470 Deep Basin 124 124

  • Refining and Marketing

5,001 2,397 2,604 8,439 2,477 2,245 3,717 2,129 1,588 Corporate and Eliminations (204) (106) (98) (353) (108) (89) (156) (89) (67) Less: Royalties 71 44 27 9 2 4 3 3 - Revenues from Continuing Operations 7,578 4,037 3,541 11,006 3,324 2,945 4,737 2,746 1,991 Conventional (Net of Royalties) - Discontinued Operations 660 336 324 1,128 318 295 515 261 254 Total Revenues 8,238 4,373 3,865 12,134 3,642 3,240 5,252 3,007 2,245

Operating Margin (1)

YTD Q2 Q1 Year Q4 Q3 Q2 YTD Q2 Q1 Oil Sands 796 544 252 877 334 267 276 231 45 Deep Basin 55 55

  • 851

599 252 877 334 267 276 231 45 Refining and Marketing 73 20 53 346 108 68 170 193 (23) Operating Margin from Continuing Operations 924 619 305 1,223 442 335 446 424 22 Conventional - Discontinued Operations 304 159 145 544 153 152 239 117 122 Total Operating Margin 1,228 778 450 1,767 595 487 685 541 144

Adjusted Funds Flow (2)

YTD Q2 Q1 Year Q4 Q3 Q2 YTD Q2 Q1 Total Cash From Operating Activities 1,567 1,239 328 861 164 310 387 205 182 Deduct (Add Back): Net Change in Other Assets and Liabilities (56) (25) (31) (91) (32) (13) (46) (17) (29) Net Change in Non-Cash Working Capital 508 472 36 (471) (339) (99) (33) (218) 185 Total Adjusted Funds Flow 1,115 792 323 1,423 535 422 466 440 26 Total Per Share - Basic and Diluted 1.14 0.71 0.39 1.71 0.64 0.51 0.56 0.53 0.03

Earnings

YTD Q2 Q1 Year Q4 Q3 Q2 YTD Q2 Q1 Operating Earnings (Loss) from Continuing Operations (3) 305 344 (39) (291) 21 (40) (272) (3) (269) Per Share from Continuing Operations - Diluted 0.31 0.31 (0.05) (0.35) 0.03 (0.05) (0.33)

  • (0.32)

Total Operating Earnings (Loss) (3) 359 398 (39) (377) 321 (236) (462) (39) (423) Total Per Share - Diluted 0.37 0.36 (0.05) (0.45) 0.39 (0.28) (0.55) (0.05) (0.51) Net Earnings (Loss) from Continuing Operations 2,792 2,581 211 (459) (209) (55) (195) (231) 36 Per Share from Continuing Operations - Basic and Diluted 2.87 2.32 0.25 (0.55) (0.25) (0.07) (0.23) (0.28) 0.04 Total Net Earnings (Loss) 2,851 2,640 211 (545) 91 (251) (385) (267) (118) Total Per Share - Basic and Diluted 2.93 2.37 0.25 (0.65) 0.11 (0.30) (0.46) (0.32) (0.14)

Net Capital Investment ($ millions)

YTD Q2 Q1 Year Q4 Q3 Q2 YTD Q2 Q1 Oil Sands Foster Creek 190 120 70 263 52 54 157 68 89 Christina Lake 140 77 63 282 60 47 175 61 114 Other Oil Sands 57 18 39 59 16 9 34 10 24 Total Oil Sands 387 215 172 604 128 110 366 139 227 Deep Basin 13 13

  • Conventional

138 50 88 171 57 41 73 34 39 Refining and Marketing 86 40 46 220 64 51 105 53 52 Corporate 16 9 7 31 10 6 15 10 5 Capital Investment 640 327 313 1,026 259 208 559 236 323 Acquisitions 29,835 29,835

  • 11
  • 11

11

  • Divestitures

(9,081) (9,081)

  • (8)
  • (8)
  • Net Acquisition and Divestiture Activity

20,754 20,754

  • 3
  • (8)

11 11

  • Net Capital Investment

21,394 21,081 313 1,029 259 200 570 247 323

(1) (2) (3)

2016 2016 2016 2016 Adjusted Funds Flow is a non-GAAP measure commonly used in the oil and gas industry to assist in measuring a company’s ability to finance its capital programs and meet its financial obligations. Adjusted Funds Flow is defined as Cash From Operating Activities excluding net change in other assets and liabilities and net change in non-cash working capital. Net change in other assets and liabilities is composed of site restoration costs and pension funding. Non-cash working capital is composed of current assets and current liabilities, excluding cash and cash equivalents and risk management. Operating Margin is an additional subtotal found in Note 1 of the Consolidated Financial Statements and is used to provide a consistent measure of the cash generating performance of our assets for comparability of

  • ur underlying financial performance between periods. Operating Margin is defined as revenues less purchased product, transportation and blending, operating expenses, production and mineral taxes plus realized

gains less realized losses on risk management activities. Items within the Corporate and Eliminations segment are excluded from the calculation of Operating Margin. 2017 2017 2017 2017 2017 2016 Operating Earnings (Loss) is a non-GAAP measure used to provide a consistent measure of the comparability of our underlying financial performance between periods by removing non-operating items. Operating Earnings (Loss) is defined as Earnings (Loss) Before Income Tax excluding gain (loss) on discontinuance, revaluation gain, gain on bargain purchase, unrealized risk management gains (losses) on derivative instruments, unrealized foreign exchange gains (losses) on translation of U.S. dollar denominated notes issued from Canada, foreign exchange gains (losses) on settlement of intercompany transactions, gains (losses) on divestiture of assets, less income taxes on Operating Earnings (Loss) before tax, excluding the effect of changes in statutory income tax rates and the recognition of an increase in U.S. tax basis. 100 200 300 400 500 600 Oil Sands Deep Basin Conventional Refining ($ millions)

Operating Margin

Q2 2017 Q2 2016 100 200 300 400 500 600 700 800 900 Q2 2017 Q2 2016 ($ millions)

Free Funds Flow Before Dividends

Adjusted Funds Flow (2) Capital Investment Free Funds Flow Free Funds Flow

Cenovus Energy Inc. Second Quarter 2017 Report Page 83 Supplemental Information

slide-84
SLIDE 84

SUPPLEMENTAL INFORMATION (unaudited)

Financial Statistics (continued)

Financial Metrics (Non-GAAP Measures)

YTD Q2 Q1 Year Q4 Q3 Q2 YTD Q2 Q1 Net Debt to Adjusted EBITDA (1) (3) 6.1x 6.1x 1.6x 1.9x 1.9x 2.0x 1.9x 1.9x 1.3x Debt to Adjusted EBITDA (2) (3) 6.4x 6.4x 3.7x 4.5x 4.5x 5.3x 4.8x 4.8x 3.6x Return on Capital Employed (4) 12% 12% 0% (2)% (2)% (6)% 6% 6% 8% Return on Common Equity (5) 17% 17% (2%) (5)% (5)% (10)% 7% 7% 10%

Income Tax & Exchange Rates

YTD Q2 Q1 Year Q4 Q3 Q2 YTD Q2 Q1 Effective Tax Rates Using: Net Earnings 20.8% 41.2% Operating Earnings, Excluding Divestitures (7.8)% 33.0% Foreign Exchange Rates (US$ per C$1) Average 0.750 0.744 0.756 0.755 0.750 0.766 0.752 0.776 0.728 Period End 0.771 0.771 0.751 0.745 0.745 0.762 0.769 0.769 0.771

Common Share Information

YTD Q2 Q1 Year Q4 Q3 Q2 YTD Q2 Q1 Common Shares Outstanding (millions) Period End 1,228.8 1,228.8 833.3 833.3 833.3 833.3 833.3 833.3 833.3 Average - Basic and Diluted 974.1 1,113.3 833.3 833.3 833.3 833.3 833.3 833.3 833.3 Dividends ($ per share) 0.10 0.05 0.05 0.20 0.05 0.05 0.10 0.05 0.05 Closing Price - TSX (C$ per share) 9.56 9.56 15.05 20.30 20.30 18.83 17.87 17.87 16.90 Closing Price - NYSE (US$ per share) 7.37 7.37 11.30 15.13 15.13 14.37 13.82 13.82 13.00 Share Volume Traded (millions) 1,400.9 907.7 493.2 1,491.7 322.6 313.0 856.1 373.3 482.8

Operating Statistics - Before Royalties

Upstream Production Volumes

YTD Q2 Q1 Year Q4 Q3 Q2 YTD Q2 Q1 Crude Oil and Natural Gas Liquids (bbls/d) Oil Sands Foster Creek 94,437 107,859 80,866 70,244 81,588 73,798 62,713 64,544 60,882 Christina Lake 127,442 153,953 100,635 79,449 82,808 79,793 77,577 78,060 77,093 221,879 261,812 181,501 149,693 164,396 153,591 140,290 142,604 137,975 Deep Basin Light and Medium Oil 1,538 3,059

  • Natural Gas Liquids (6)

6,956 13,835

  • 8,494

16,894

  • Conventional

Heavy Oil 26,933 26,593 27,277 29,185 28,913 28,096 29,873 28,500 31,247 Light and Medium Oil 26,167 27,233 25,089 25,915 25,065 25,311 26,649 26,177 27,121 Natural Gas Liquids (6) 1,090 1,132 1,047 1,065 1,177 1,074 1,003 799 1,208 54,190 54,958 53,413 56,165 55,155 54,481 57,525 55,476 59,576 Total Crude Oil and Natural Gas Liquids 284,563 333,664 234,914 205,858 219,551 208,072 197,815 198,080 197,551 Natural Gas (MMcf/d) Oil Sands 13 12 15 17 17 18 17 18 17 Deep Basin 127 253

  • Conventional

352 355 348 377 362 374 386 381 391 Total Natural Gas 492 620 363 394 379 392 403 399 408 Total Production (7) (BOE/d) 366,556 436,929 295,414 271,525 282,718 273,405 264,982 264,580 265,551

(1) (2) (3) (4) (5) (6) Natural gas liquids include condensate volumes. (7)

Net debt includes the Company's short-term borrowings and the current and long-term portions of long-term debt, net of cash and cash equivalents. 2017 Return on common equity is calculated, on a trailing twelve-month basis, as net earnings divided by average shareholders' equity. Adjusted EBITDA is defined as earnings before finance costs, interest income, income tax expense, depreciation, depletion and amortization, revaluation gain, remeasurement gains (losses) on contingent consideration, goodwill impairments, asset impairments and reversals, unrealized gains (losses) on risk management, foreign exchange gains (losses), gains (losses) on divestiture of assets and other income (loss), net, calculated on a trailing twelve-month basis. Return on capital employed is calculated, on a trailing twelve-month basis, as net earnings before after-tax interest divided by average shareholders' equity plus average debt. 2016 Natural gas volumes have been converted to barrels of oil equivalent ("BOE") on the basis of six thousand cubic feet ("Mcf") to one barrel ("bbl"). BOE may be misleading, particularly if used in isolation. A conversion ratio of one bbl to six Mcf is based on an energy equivalency conversion method primarily applicable at the burner tip and does not represent value equivalency at the wellhead. Given that the value ratio based on the current price of crude oil compared to natural gas is significantly different from the energy equivalency conversion ratio of 6:1, utilizing a conversion on a 6:1 basis is not an accurate reflection of value. Debt includes the Company's short-term borrowings and the current and long-term portions of long-term debt. 2017 2017 2016 2016 2017 2016 200 400 600 800 1,000 1,200 1,400 1,600 50,000 100,000 150,000 200,000 250,000 300,000 350,000 Q2 2017 Q2 2016 Q2 2017 Q2 2016 Q2 2017 Q2 2016 (MMcf/d) (bbls/d)

Production

Crude Oil NGLs Natural Gas Q2 2017 Q2 2016 WCS WTI Brent Condensate 10 20 30 40 50 60 Q1 2016 Q2 2016 Q3 2016 Q4 2016 Q1 2017 Q2 2017 (US$/bbl)

Benchmark Prices

Cenovus Energy Inc. Second Quarter 2017 Report Page 84 Supplemental Information

slide-85
SLIDE 85

SUPPLEMENTAL INFORMATION (unaudited)

Operating Statistics - Before Royalties (continued)

Selected Average Benchmark Prices

YTD Q2 Q1 Year Q4 Q3 Q2 YTD Q2 Q1 Crude Oil Prices (US$/bbl) Brent 52.79 50.92 54.66 45.04 51.13 46.98 41.03 46.97 35.08 West Texas Intermediate ("WTI") 50.10 48.29 51.91 43.32 49.29 44.94 39.52 45.59 33.45 Differential Brent - WTI 2.69 2.63 2.75 1.72 1.84 2.04 1.51 1.38 1.63 Western Canadian Select ("WCS") 37.25 37.16 37.33 29.48 34.97 31.44 25.75 32.29 19.21 WCS (C$) 49.69 49.95 49.38 39.05 46.63 41.04 34.24 41.61 26.39 Mixed Sweet Blend (C$ ) 62.97 61.87 64.37 53.14 61.60 54.81 48.05 54.78 40.88 Differential WTI - WCS 12.85 11.13 14.58 13.84 14.32 13.50 13.77 13.30 14.24 Condensate (C5 @ Edmonton) 50.35 48.44 52.26 42.47 48.33 43.07 39.23 44.07 34.39 Differential WTI - Condensate (Premium)/Discount (0.25) (0.15) (0.35) 0.85 0.96 1.87 0.29 1.52 (0.94) Refining Margins 3-2-1 Crack Spreads (1) (US$/bbl) Chicago 13.16 14.78 11.54 13.07 10.96 14.58 13.36 17.15 9.58 Group 3 13.73 14.27 13.18 12.27 10.95 14.56 11.78 13.03 10.52 Natural Gas Prices AECO (C$/Mcf) 2.86 2.77 2.94 2.09 2.81 2.20 1.68 1.25 2.11 NYMEX (US$/Mcf) 3.25 3.18 3.32 2.46 2.98 2.81 2.02 1.95 2.09 Differential NYMEX - AECO (US$/Mcf) 1.12 1.13 1.10 0.89 0.86 1.13 0.78 0.99 0.56

Average Royalty Rates (Excluding Realized Gain (Loss) on Risk Management)

YTD Q2 Q1 Year Q4 Q3 Q2 YTD Q2 Q1 Oil Sands Foster Creek 7.8% 7.3% 8.5% 0.0% (0.9)% 0.8% 0.3% 1.0% (4.9)% Christina Lake 2.6% 2.6% 2.7% 1.6% 1.8% 1.6% 1.2% 1.2% 1.2% Deep Basin Crude Oil 17.4% 17.4%

  • Natural Gas Liquids

9.2% 9.2%

  • Natural Gas

4.1% 4.1%

  • Conventional Oil

Pelican Lake 18.6% 17.4% 19.8% 12.5% 11.9% 14.1% 12.1% 14.3% 8.3% Weyburn 27.0% 25.8% 28.3% 23.6% 28.3% 23.0% 20.8% 23.9% 16.6% Other 12.5% 12.7% 12.4% 12.8% 19.3% 10.4% 10.0% 8.6% 12.0% Natural Gas Liquids 13.1% 13.0% 13.3% 13.5% 12.2% 12.0% 15.6% 15.0% 16.1% Natural Gas 5.0% 5.2% 4.8% 4.6% 5.3% 4.5% 4.1% 3.7% 4.3%

Oil Sands Netbacks (2) (Excluding Realized Gain (Loss) on Risk Management)

YTD Q2 Q1 Year Q4 Q3 Q2 YTD Q2 Q1 Heavy Oil - Foster Creek ($/bbl) Sales Price 42.79 44.38 40.62 30.32 38.59 33.61 22.78 33.40 11.82 Royalties 2.64 2.49 2.83 (0.01) (0.27) 0.19 0.04 0.23 (0.16) Transportation and Blending 9.29 10.44 7.72 8.84 7.37 8.38 10.09 11.44 8.70 Operating 11.33 12.31 9.99 10.55 10.60 9.63 11.09 10.15 12.05 Netback 19.53 19.14 20.08 10.94 20.89 15.41 1.56 11.58 (8.77) Heavy Oil - Christina Lake ($/bbl) Sales Price 36.29 36.54 35.86 25.30 34.78 29.11 18.33 28.31 8.85 Royalties 0.85 0.85 0.86 0.33 0.56 0.41 0.16 0.28 0.05 Transportation and Blending 4.11 4.10 4.13 4.68 4.08 4.49 5.10 4.90 5.28 Operating 7.42 7.04 8.08 7.48 8.15 7.72 7.00 6.35 7.61 Netback 23.91 24.55 22.79 12.81 21.99 16.49 6.07 16.78 (4.09) Total Heavy Oil - Oil Sands ($/bbl) Sales Price 39.09 39.73 38.08 27.64 36.67 31.30 20.28 30.59 10.13 Royalties 1.62 1.52 1.78 0.17 0.14 0.30 0.11 0.26 (0.04) Transportation and Blending 6.34 6.68 5.81 6.62 5.71 6.39 7.29 7.84 6.75 Operating 9.10 9.19 8.97 8.91 9.37 8.65 8.79 8.06 9.52 Netback 22.03 22.34 21.52 11.94 21.45 15.96 4.09 14.43 (6.10)

Deep Basin Netbacks (2) (Excluding Realized Gain (Loss) on Risk Management)

YTD Q2 Q1 Year Q4 Q3 Q2 YTD Q2 Q1 Total Deep Basin (3) ($/BOE) Sales Price 21.94 21.94

  • Royalties

1.45 1.45

  • Transportation and Blending

1.96 1.96

  • Operating

8.84 8.84

  • Production and Mineral Taxes

0.03 0.03

  • Netback

9.66 9.66

  • (1)

(2) 3 (3)

Netback is a non-GAAP measure commonly used in the oil and gas industry to assist in measuring operating performance on a per-unit basis. Netbacks reflect our margin on a per-barrel basis of unblended crude

  • il. Netback is defined as gross sales less royalties, transportation and blending, operating expenses and production and mineral taxes divided by sales volumes. Netbacks do not reflect the non-cash write-downs of

product inventory until the product is sold. The crude oil sales price, transportation and blending costs, and sales volumes exclude the impact of purchased condensate. Condensate is blended with the heavy oil to reduce its thickness in order to transport it to market. Our Netback calculation is aligned with the definition found in the Canadian Oil and Gas Evaluation Handbook. The reconciliation of the financial components of each Netback to Operating Margin can be found in our quarterly and annual Management's Discussion and Analysis and our Annual Information Form. Natural gas volumes have been converted to BOE on the basis of six Mcf to one bbl. BOE may be misleading, particularly if used in isolation. A conversion ratio of one bbl to six Mcf is based on an energy equivalency conversion method primarily applicable at the burner tip and does not represent value equivalency at the wellhead. Given that the value ratio based on the current price of crude oil compared to natural gas is significantly different from the energy equivalency conversion ratio of 6:1, utilizing a conversion on a 6:1 basis is not an accurate reflection of value. The 3-2-1 crack spread is an indicator of the refining margin generated by converting three barrels of crude oil into two barrels of regular unleaded gasoline and one barrel of ultra-low sulphur diesel using current month WTI based crude oil feedstock prices and on a last in, first out accounting basis (“LIFO”). 2017 2016 2017 2016 2017 2016 2017 2016

Cenovus Energy Inc. Second Quarter 2017 Report Page 85 Supplemental Information

slide-86
SLIDE 86

SUPPLEMENTAL INFORMATION (unaudited)

Operating Statistics - Before Royalties (continued)

Conventional Netbacks (1) (Excluding Realized Gain (Loss) on Risk Management)

YTD Q2 Q1 Year Q4 Q3 Q2 YTD Q2 Q1 Heavy Oil - Conventional ($/bbl) Sales Price 47.20 46.67 47.77 35.82 40.72 40.50 31.15 36.77 25.99 Royalties 6.57 6.15 7.03 3.31 4.08 3.97 2.62 3.95 1.40 Transportation and Blending 3.96 4.48 3.40 4.60 4.90 4.86 4.33 3.85 4.77 Operating 13.74 14.56 12.86 13.38 14.69 12.43 13.19 12.34 13.98 Production and Mineral Taxes 0.02 0.01 0.02 0.01 0.01 0.01

  • 0.01
  • Netback

22.91 21.47 24.46 14.52 17.04 19.23 11.01 16.62 5.84 Light and Medium Oil ($/bbl) Sales Price 56.61 56.40 56.84 46.48 55.35 48.97 41.12 48.09 34.36 Royalties 12.14 11.58 12.75 9.28 14.87 8.91 6.82 8.52 5.18 Transportation and Blending 2.76 2.82 2.70 2.73 2.69 2.71 2.75 2.77 2.73 Operating 16.41 16.08 16.77 15.65 16.05 13.94 16.28 16.21 16.34 Production and Mineral Taxes 1.90 1.85 1.95 1.24 1.50 1.48 1.00 1.18 0.82 Netback 23.40 24.07 22.67 17.58 20.24 21.93 14.27 19.41 9.29 Natural Gas Liquids ($/bbl) Sales Price 44.54 41.06 48.35 31.16 40.79 29.71 26.23 28.11 24.99 Royalties 5.84 5.32 6.42 4.21 4.97 3.58 4.10 4.20 4.03 Netback 38.70 35.74 41.93 26.95 35.82 26.13 22.13 23.91 20.96 Natural Gas ($/Mcf) Sales Price 2.90 2.80 3.00 2.33 3.00 2.49 1.92 1.52 2.31 Royalties 0.14 0.14 0.14 0.10 0.15 0.10 0.07 0.05 0.09 Transportation and Blending 0.10 0.08 0.13 0.11 0.12 0.10 0.12 0.14 0.10 Operating 1.23 1.15 1.31 1.12 1.20 1.03 1.12 1.05 1.20 Production and Mineral Taxes 0.02 0.01 0.02

  • 0.01
  • Netback

1.41 1.42 1.40 1.00 1.53 1.25 0.61 0.28 0.92 Total Conventional (2) ($/BOE) Sales Price 33.86 33.53 34.19 26.54 31.98 28.59 22.95 24.49 21.47 Royalties 4.87 4.69 5.07 3.18 4.77 3.24 2.40 3.01 1.81 Transportation and Blending 1.91 2.00 1.82 2.08 2.17 2.09 2.03 1.96 2.09 Operating 10.92 10.85 10.99 10.23 10.92 9.30 10.35 9.89 10.79 Production and Mineral Taxes 0.49 0.47 0.51 0.27 0.31 0.35 0.22 0.27 0.16 Netback 15.67 15.52 15.80 10.78 13.81 13.61 7.95 9.36 6.62

Consolidated Netbacks (1)

(Excluding Realized Gain (Loss) on Risk Management)

YTD Q2 Q1 Year Q4 Q3 Q2 YTD Q2 Q1 Total Consolidated (2) ($/BOE) Sales Price 35.89 35.58 36.37 27.01 34.53 29.98 21.41 27.56 15.43 Royalties 2.62 2.34 3.06 1.49 2.06 1.55 1.16 1.51 0.82 Transportation and Blending 4.55 4.78 4.20 4.56 4.20 4.51 4.79 5.07 4.51 Operating 9.67 9.59 9.80 9.51 10.05 8.92 9.52 8.89 10.14 Production and Mineral Taxes 0.16 0.13 0.20 0.12 0.13 0.15 0.10 0.12 0.08 Netback 18.89 18.74 19.11 11.33 18.09 14.85 5.84 11.97 (0.12)

Realized Gain (Loss) on Risk Management

YTD Q2 Q1 Year Q4 Q3 Q2 YTD Q2 Q1 Total Crude Oil ($/bbl) (1.62) 0.39 (4.55) 3.24 0.91 2.15 5.13 1.97 8.21 Total Production (2) ($/BOE) (1.21) 0.28 (3.56) 2.44 0.70 1.63 3.81 1.46 6.08

Refinery Operations (3)

YTD Q2 Q1 Year Q4 Q3 Q2 YTD Q2 Q1 Crude Oil Capacity (Mbbls/d) 460 460 460 460 460 460 460 460 460 Crude Oil Runs (Mbbls/d) 428 449 406 444 421 463 446 458 435 Heavy Oil 201 201 200 233 223 241 235 228 241 Light/Medium 227 248 206 211 198 222 211 230 194 Crude Utilization 93% 98% 88% 97% 92% 101% 97% 100% 95% Refined Products (Mbbls/d) 455 476 433 471 448 494 472 483 460

(1) (2) (3) Represents 100% of the Wood River and Borger refinery operations.

Natural gas volumes have been converted to BOE on the basis of six Mcf to one bbl. BOE may be misleading, particularly if used in isolation. A conversion ratio of one bbl to six Mcf is based on an energy equivalency conversion method primarily applicable at the burner tip and does not represent value equivalency at the wellhead. Given that the value ratio based on the current price of crude oil compared to natural gas is significantly different from the energy equivalency conversion ratio of 6:1, utilizing a conversion on a 6:1 basis is not an accurate reflection of value. Netback is a non-GAAP measure commonly used in the oil and gas industry to assist in measuring operating performance on a per-unit basis. Netbacks reflect our margin on a per-barrel basis of unblended crude

  • il. Netback is defined as gross sales less royalties, transportation and blending, operating expenses and production and mineral taxes divided by sales volumes. Netbacks do not reflect the non-cash write-downs of

product inventory until the product is sold. The crude oil sales price, transportation and blending costs, and sales volumes exclude the impact of purchased condensate. Condensate is blended with the heavy oil to reduce its thickness in order to transport it to market. Our Netback calculation is aligned with the definition found in the Canadian Oil and Gas Evaluation Handbook. The reconciliation of the financial components of each Netback to Operating Margin can be found in our quarterly and annual Management's Discussion and Analysis and our Annual Information Form. 2017 2016 2017 2017 2016 2016 2017 2016

Cenovus Energy Inc. Second Quarter 2017 Report Page 86 Supplemental Information

slide-87
SLIDE 87

ADVI SORY FI NANCI AL I NFORMATI ON

Basis of Presentation Cenovus reports financial results in Canadian dollars and presents production volumes on a net to Cenovus before royalties basis, unless otherwise stated. Cenovus prepares its financial statements in accordance with International Financial Reporting Standards (IFRS).

OI L AND GAS I NFORMATI ON

Barrels of Oil Equivalent Natural gas volumes have been converted to barrels of oil equivalent (BOE) on the basis of six thousand cubic feet (Mcf) to one barrel (bbl). BOE may be misleading, particularly if used in isolation. A conversion ratio of one bbl to six Mcf is based on an energy equivalency conversion method primarily applicable at the burner tip and does not represent value equivalency at the wellhead. Given that the value ratio based on the current price of crude oil compared with natural gas is significantly different from the energy equivalency conversion ratio of 6:1, utilizing a conversion on a 6:1 basis is not an accurate reflection of value. Drilling Locations This quarterly report discloses potential future drilling locations in two categories: (a) proved locations and (b) probable locations. This quarterly report also discloses additional unbooked future drilling opportunities. Proved locations and probable locations are proposed drilling locations identified in reserve reports prepared for assets acquired pursuant to the ConocoPhillips asset acquisition that have proved and/or probable reserves, as applicable, attributed to them in such reports. Unbooked future drilling opportunities are internal Cenovus estimates based on prospective acreage and an assumption as to the number of wells that can be drilled per section based on industry practice and internal Cenovus technical analysis and review. Unbooked future drilling opportunities have been identified by Cenovus management based on evaluation of applicable geologic, seismic, engineering, production and reserves information. Unbooked future drilling opportunities do not have proved or probable reserves attributed to them in the relevant reserves reports. Of the approximately 1,500 identified net drilling opportunities within the Deep Basin assets to be acquired, 212 are proved locations, 221 are probable locations and the remainder are unbooked future drilling opportunities. Cenovus’s ability to drill and develop these locations and opportunities and the drilling locations on which Cenovus actually drills wells depend on a number of uncertainties and factors, including, but not limited to, the availability of capital, equipment and personnel, oil and natural gas prices, capital and operating costs, inclement weather, seasonal restrictions, drilling results, additional geological, geophysical and reservoir information that is obtained, production rate recovery, gathering system and transportation constraints, net price received for commodities produced, regulatory approvals and regulatory changes. As a result of these uncertainties, there can be no assurance that the potential future drilling locations and opportunities Cenovus has identified will ever be drilled or if Cenovus will be able to produce oil, NGL or natural gas from these or any other potential drilling locations or

  • pportunities. As such, Cenovus’s actual drilling activities may differ materially from those presently identified,

which could adversely affect Cenovus’s business. While certain of the identified unbooked drilling opportunities have been de-risked by drilling existing wells in relatively close proximity to such unbooked drilling opportunities, some of the other unbooked drilling opportunities are farther away from existing wells where Cenovus management has less information about the characteristics of the reservoir and therefore there is more uncertainty whether wells will be drilled and, if drilled, there is further uncertainty that such wells will result in additional proved or probable reserves or production.

NON-GAAP MEASURES AND ADDI TI ONAL SUBTOTAL

The following measures do not have a standardized meaning as prescribed by IFRS and therefore are considered non-GAAP measures. Readers should not consider these measures in isolation or as a substitute for analysis of Cenovus’s results as reported under IFRS. These measures are defined differently by different companies in the oil and gas industry and may not be comparable to similar measures presented by other issuers. Adjusted Funds Flow is used in the oil and gas industry to assist in measuring a company’s ability to finance its capital programs and meet its financial obligations. Adjusted Funds Flow is defined as Cash from Operating Cenovus Energy Inc. Second Quarter 2017 Results Page 87 Advisory

slide-88
SLIDE 88

Activities excluding net change in other assets and liabilities and net change in non-cash working capital. Net change in other assets and liabilities is composed of site restoration costs and pension funding. Non-cash working capital is composed of current assets and current liabilities, excluding cash and cash equivalents, risk management, the contingent payment and asset liabilities held for sale. Free Funds Flow is defined as Adjusted Funds Flow less capital investment. Operating Earnings (Loss) is a non-GAAP measure used to provide a consistent measure of the comparability of Cenovus's underlying financial performance between periods by removing non-operating items. Operating Earnings (Loss) is defined as Earnings (Loss) Before Income Tax excluding gain (loss) on discontinuance, revaluation gain, gain on bargain purchase, unrealized risk management gains (losses) on derivative instruments, unrealized foreign exchange gains (losses) on translation of U.S. dollar denominated notes issued from Canada, foreign exchange gains (losses) on settlement of intercompany transactions, gains (losses) on divestiture of assets, less income taxes on Operating Earnings (Loss) before tax, excluding the effect of changes in statutory income tax rates and the recognition of an increase in U.S. tax basis. Debt is defined as short-term borrowings and long-term debt, including the current portion. Net debt is defined as debt net of cash and cash equivalents. Operating Margin is an additional subtotal found in Note 1 and Note 8 of the Consolidated Financial Statements and is used to provide a consistent measure of the cash generating performance of Cenovus’s assets for comparability

  • f its underlying financial performance between periods. Operating Margin is defined as revenues less purchased

product, transportation and blending, operating expenses, production and mineral taxes plus realized gains less realized losses on risk management activities. Items within the Corporate and Eliminations segment are excluded from the calculation of Operating Margin.

FORW ARD-LOOKI NG I NFORMATI ON

This quarterly report contains certain forward-looking statements and forward-looking information (collectively referred to as "forward-looking information") within the meaning of applicable securities legislation, including the United States Private Securities Litigation Reform Act of 1995, about Cenovus's current expectations, estimates and projections about the future, based on certain assumptions made by the company in light of its experience and perception of historical trends. Although Cenovus believes that the expectations represented by such forward- looking information are reasonable, there can be no assurance that such expectations will prove to be correct. Forward-looking information in this document is identified by words such as “anticipate”, “believe”, “expect”, “estimate", “plan”, “forecast”, “future”, “target”, “position”, “project”, “committed”, “can be”, “pursue”, “capacity”, “could”, “should”, “will”, “focus”, “outlook”, “potential”, “priority”, “may”, “strategy”, “forward”, or similar expressions and includes suggestions of future outcomes, including statements about: strategy and related milestones and schedules, including expected timing for oil sands expansion phases and associated expected production capacities; projections for 2017 and future years and the company’s plans and strategies to realize such projections; forecast exchange rates and trends; future opportunities for oil development; forecast operating and financial results, including forecast sales prices, costs and cash flows; Cenovus’s ability to satisfy payment

  • bligations as they become due; priorities for capital investment decisions; planned capital expenditures, including

the amount, timing and financing thereof; expected future production, including the timing, stability or growth thereof; capacities, including for projects, transportation and refining; Cenovus’s ability to preserve its financial resilience and various plans and strategies with respect thereto; forecast cost savings and sustainability thereof; expected impacts of the acquisition; planned and potential asset sales, including expected timelines, targeted sales values and anticipated use of sales proceeds; the strength of Cenovus's positioning for the future, including with the recent acquisition and upcoming retirement of Brian Ferguson; and projected shareholder value. Readers are cautioned not to place undue reliance on forward-looking information as actual results may differ materially from those expressed or implied. Developing forward-looking information involves reliance on a number of assumptions and consideration of certain risks and uncertainties, some of which are specific to Cenovus and others that apply to the industry generally. The factors or assumptions on which the forward-looking information is based include: forecast oil and natural gas prices and other assumptions inherent in Cenovus’s 2017 guidance, available at cenovus.com under Investors; projected capital investment levels, the flexibility of Cenovus’s capital spending plans and the associated source of Cenovus Energy Inc. Second Quarter 2017 Results Page 88 Advisory

slide-89
SLIDE 89

funding; the achievement of further cost reductions and sustainability thereof; expected condensate prices; estimates of quantities of oil, bitumen, natural gas and liquids from properties and other sources not currently classified as proved; future use and development of technology; Cenovus’s ability to obtain necessary regulatory and partner approvals; the successful and timely implementation of capital projects or stages thereof; Cenovus’s ability to generate sufficient cash flow to meet its current and future obligations; estimated abandonment and reclamation costs, including associated levies and regulations; achievement of expected impacts of the acquisition; successful integration of the Deep Basin assets; Cenovus’s ability to obtain and retain qualified staff and equipment in a timely and cost-efficient manner; Cenovus’s ability to access sufficient capital to pursue its development plans; Cenovus’s ability to complete planned and potential asset sales, including with desired transaction metrics and within the timelines it expects; forecast crude oil and natural gas prices, forecast inflation and other assumptions inherent in current guidance set out below; expected impacts of the contingent payment to ConocoPhillips, including alignment of realized Western Canadian Select (WCS) prices and WCS prices used to calculate the contingent payment; Cenovus’s projected capital investment levels, the flexibility of capital spending plans and the associated sources of funding; sustainability of achieved cost reductions, achievement of further cost reductions and sustainability thereof; Cenovus’s ability to access and implement all technology necessary to achieve expected future results; Cenovus’s ability to implement capital projects or stages thereof in a successful and timely manner; and other risks and uncertainties described from time to time in the filings we make with securities regulatory authorities. 2017 guidance, as updated July 26, 2017, assumes: Brent prices of US$51.00/bbl, WTI prices of US$48.50/bbl; WCS of US$36.25/bbl; NYMEX natural gas prices of US$3.15/MMBtu; AECO natural gas prices of $2.70/GJ; Chicago 3-2-1 crack spread of US$13.00/bbl; and an exchange rate of $0.76 US$/C$. Unless otherwise specifically stated or the context dictates otherwise, the financial outlook and forward-looking metrics in this quarterly report, in addition to the generally applicable assumptions described above, do not include

  • r account for the effects or impacts of planned asset sales.

The risk factors and uncertainties that could cause actual results to differ materially, include: possible failure by Cenovus to realize the anticipated benefits of and synergies from the acquisition; possible failure to access or implement some or all of the technology necessary to efficiently and effectively operate Cenovus’s assets and achieve expected future results; volatility of and other assumptions regarding commodity prices; the effectiveness

  • f Cenovus’s risk management program, including the impact of derivative financial instruments, the success of

hedging strategies and the sufficiency of Cenovus’s liquidity position; the accuracy of cost estimates; commodity prices, currency and interest rates; possible lack of alignment of realized WCS prices and WCS prices used to calculate the contingent payment to ConocoPhillips; product supply and demand; market competition, including from alternative energy sources; risks inherent in marketing operations, including credit risks; exposure to counterparties and partners, including ability and willingness of such parties to satisfy contractual obligations in a timely manner; risks inherent in the operation of Cenovus’s crude-by-rail terminal, including health, safety and environmental risks; maintaining desirable ratios of Debt (and Net Debt) to Adjusted Earnings Before Interest, Taxes, Depreciation and Amortization (EBITDA) as well as Debt (and Net Debt) to Capitalization; Cenovus’s ability to access various sources of debt and equity capital, generally, and on terms acceptable to Cenovus; ability to finance growth and sustaining capital expenditures; changes in credit ratings applicable to Cenovus or any of its securities; changes to Cenovus’s dividend plans or strategy, including the dividend reinvestment plan; accuracy of reserves, resources, future production and future net revenue estimates; Cenovus’s ability to replace and expand

  • il and gas reserves; Cenovus’s ability to maintain its relationship with its partners and to successfully manage and
  • perate its integrated business; reliability of Cenovus’s assets including in order to meet production targets;

potential disruption or unexpected technical difficulties in developing new products and manufacturing processes; the occurrence of unexpected events such as fires, severe weather conditions, explosions, blow-outs, equipment failures, transportation incidents and other accidents or similar events; refining and marketing margins; inflationary pressures on operating costs, including labour, natural gas and other energy sources used in oil sands processes; potential failure of products to achieve or maintain acceptance in the market; risks associated with fossil fuel industry reputation; unexpected cost increases or technical difficulties in constructing or modifying manufacturing or refining facilities; unexpected difficulties in producing, transporting or refining of crude oil into petroleum and chemical products; risks associated with technology and its application to Cenovus’s business; risks associated with climate change; the timing and the costs of well and pipeline construction; Cenovus’s ability to secure adequate and cost-effective product transportation including sufficient pipeline, crude-by-rail, marine or alternate transportation, including to address any gaps caused by constraints in the pipeline system; availability of, and Cenovus’s ability to attract and retain, critical talent; possible failure to obtain and retain qualified staff and Cenovus Energy Inc. Second Quarter 2017 Results Page 89 Advisory

slide-90
SLIDE 90

equipment in a timely and cost-efficient manner; changes in labour relationships; changes in the regulatory framework in any of the locations in which Cenovus operates, including changes to the regulatory approval process and land-use designations, royalty, tax, environmental, greenhouse gas, carbon, climate change and other laws or regulations, or changes to the interpretation of such laws and regulations, as adopted or proposed, the impact thereof and the costs associated with compliance; the expected impact and timing of various accounting pronouncements, rule changes and standards on Cenovus’s business, financial results and consolidated financial statements; changes in general economic, market and business conditions; the political and economic conditions in the countries in which Cenovus operates or supplies; the occurrence of unexpected events such as war, terrorist threats and the instability resulting therefrom; and risks associated with existing and potential future lawsuits and regulatory actions against Cenovus. Readers are cautioned that the foregoing lists are not exhaustive and are made as at the date hereof. Events or circumstances could cause actual results to differ materially from those estimated or projected and expressed in, or implied by, the forward looking information. For a full discussion of material risk factors, see “Risk Factors” in Cenovus’s Annual Information Form (AIF) or Form 40-F for the period ended December 31, 2016, available on SEDAR at sedar.com, on EDGAR at sec.gov and on Cenovus’s website at cenovus.com, and the updates under “Risk Management” in Cenovus’s most recently filed Management’s Discussion and Analysis (MD&A).

ABBREVI ATI ONS

The following is a summary of the abbreviations that have been used in this document:

Crude Oil Natural Gas bbl barrel Mcf thousand cubic feet bbls/d barrels per day MMcf million cubic feet Mbbls/d thousand barrels per day Bcf billion cubic feet MMbbls million barrels MMBtu million British thermal units BOE barrel of oil equivalent GJ gigajoule BOE/d Barrel of oil equivalent per day AECO Alberta Energy Company MBOE thousand barrel of oil equivalent NYMEX New York Mercantile Exchange MMBOE million barrel of oil equivalent WTI West Texas Intermediate WCS Western Canadian Select CDB Christina Dilbit Blend TM Trademark of Cenovus Energy Inc.

Cenovus Energy Inc. Second Quarter 2017 Results Page 90 Advisory

slide-91
SLIDE 91

NETBACK RECONCI LI ATI ONS

The following tables provide a reconciliation of the items comprising Netbacks to Operating Margin found in our Interim Consolidated Financial Statements. Total Production Upstream Financial Results

Per I nterim Consolidated Financial Statem ents Three Months Ended June 30, 2017 ($ millions) Oil Sands

( 1 )

Deep Basin

( 1 )

Conventional

( 2 )

Total Upstream Revenues Gross Sales 1 ,6 6 6 1 2 4 3 8 6 2 ,1 7 6 Less: Royalties 3 6 8 5 0 9 4 1 ,6 3 0 1 1 6 3 3 6 2 ,0 8 2 Expenses Transportation and Blending 8 7 9 1 0 5 4 9 4 3 Operating 2 2 1 5 1 1 1 5 3 8 7 Production and Mineral Taxes

  • 5

5 Netback 5 3 0 5 5 1 6 2 7 4 7 (Gain) Loss on Risk Management ( 1 4 )

  • 3

( 1 1 ) Operating Margin 5 4 4 5 5 1 5 9 7 5 8 Per I nterim Consolidated Financial Statem ents Three Months Ended June 30, 2016 ($ millions) Oil Sands

( 1 )

Deep Basin

( 1 )

Conventional

( 2 )

Total Upstream Revenues Gross Sales 7 0 9

  • 2 9 4

1 ,0 0 3 Less: Royalties 3

  • 3 3

3 6 7 0 6

  • 2 6 1

9 6 7 Expenses Transportation and Blending 3 9 5

  • 4 5

4 4 0 Operating 1 0 4

  • 1 0 7

2 1 1 Production and Mineral Taxes

  • 3

3 Netback 2 0 7

  • 1 0 6

3 1 3 (Gain) Loss on Risk Management ( 2 4 )

  • ( 1 1 )

( 3 5 ) Operating Margin 2 3 1

  • 1 1 7

3 4 8

(1) Found in Note 1 of the interim Consolidated Financial Statements. (2) Found in Note 8 of the interim Consolidated Financial Statements.

Netback Reconciliations

Basis of Netback Calculation Adjustm ents Per Above Table Three Months Ended June 30, 2017 ($ millions) Total Condensate I nventory Other Total Upstream Revenues Gross Sales 1 ,4 1 6 7 5 1

  • 9

2 ,1 7 6 Less: Royalties 9 3

  • 1

9 4 1 ,3 2 3 7 5 1

  • 8

2 ,0 8 2 Expenses Transportation and Blending 1 8 9 7 5 1

  • 3

9 4 3 Operating 3 8 0

  • 7

3 8 7 Production and Mineral Taxes 5

  • 5

Netback 7 4 9

  • ( 2 )

7 4 7 (Gain) Loss on Risk Management ( 1 1 )

  • ( 1 1 )

Operating Margin 7 6 0

  • ( 2 )

7 5 8 Basis of Netback Calculation Adjustm ents Per Above Table Three Months Ended June 30, 2016 ($ millions) Total Condensate I nventory Other Total Upstream Revenues Gross Sales 6 5 2 3 4 9

  • 2

1 ,0 0 3 Less: Royalties 3 6

  • 3 6

6 1 6 3 4 9

  • 2

9 6 7 Expenses Transportation and Blending 1 2 0 3 4 9 ( 2 9 )

  • 4 4 0

Operating 2 0 9

  • 2

2 1 1 Production and Mineral Taxes 3

  • 3

Netback 2 8 4

  • 2 9
  • 3 1 3

(Gain) Loss on Risk Management ( 3 5 )

  • ( 3 5 )

Operating Margin 3 1 9

  • 2 9
  • 3 4 8

Cenovus Energy Inc. Second Quarter 2017 Report Page 91 Netback Reconciliations

slide-92
SLIDE 92

Total Production Upstream Financial Results

Per I nterim Consolidated Financial Statem ents Six Months Ended June 30, 2017 ($ millions) Oil Sands

( 1 )

Deep Basin

( 1 )

Conventional

( 2 )

Total Upstream Revenues Gross Sales 2 ,7 2 8 1 2 4 7 6 0 3 ,6 1 2 Less: Royalties 6 3 8 1 0 0 1 7 1 2 ,6 6 5 1 1 6 6 6 0 3 ,4 4 1 Expenses Transportation and Blending 1 ,4 4 5 1 0 1 0 5 1 ,5 6 0 Operating 3 6 1 5 1 2 2 5 6 3 7 Production and Mineral Taxes

  • 1 0

1 0 Netback 8 5 9 5 5 3 2 0 1 ,2 3 4 (Gain) Loss on Risk Management 6 3

  • 1 6

7 9 Operating Margin 7 9 6 5 5 3 0 4 1 ,1 5 5 Per I nterim Consolidated Financial Statem ents Six Months Ended June 30, 2016 ($ millions) Oil Sands

( 1 )

Deep Basin

( 1 )

Conventional

( 2 )

Total Upstream Revenues Gross Sales 1 ,1 7 9

  • 5 6 8

1 ,7 4 7 Less: Royalties 3

  • 5 3

5 6 1 ,1 7 6

  • 5 1 5

1 ,6 9 1 Expenses Transportation and Blending 7 9 9

  • 9 2

8 9 1 Operating 2 3 1

  • 2 2 9

4 6 0 Production and Mineral Taxes

  • 5

5 Netback 1 4 6

  • 1 8 9

3 3 5 (Gain) Loss on Risk Management ( 1 3 0 )

  • ( 5 0 )

( 1 8 0 ) Operating Margin 2 7 6

  • 2 3 9

5 1 5

(1) Found in Note 1 of the interim Consolidated Financial Statements. (2) Found in Note 8 of the interim Consolidated Financial Statements.

Netback Reconciliations

Basis of Netback Calculation Adjustm ents Per Above Table Six Months Ended June 30, 2017 ($ millions) Total Condensate I nventory Other Total Upstream Revenues Gross Sales 2 ,3 3 6 1 ,2 6 2

  • 1 4

3 ,6 1 2 Less: Royalties 1 7 0

  • 1

1 7 1 2 ,1 6 6 1 ,2 6 2

  • 1 3

3 ,4 4 1 Expenses Transportation and Blending 2 9 5 1 ,2 6 2 1 2 1 ,5 6 0 Operating 6 2 9

  • 8

6 3 7 Production and Mineral Taxes 1 0

  • 1 0

Netback 1 ,2 3 2

  • ( 1 )

3 1 ,2 3 4 (Gain) Loss on Risk Management 7 9

  • 7 9

Operating Margin 1 ,1 5 3

  • ( 1 )

3 1 ,1 5 5 Basis of Netback Calculation Adjustm ents Per Above Table Six Months Ended June 30, 2016 ($ millions) Total Condensate I nventory Other Total Upstream Revenues Gross Sales 1 ,0 2 8 7 1 2

  • 7

1 ,7 4 7 Less: Royalties 5 6

  • 5 6

9 7 2 7 1 2

  • 7

1 ,6 9 1 Expenses Transportation and Blending 2 3 0 7 1 2 ( 5 1 )

  • 8 9 1

Operating 4 5 7

  • 3

4 6 0 Production and Mineral Taxes 5

  • 5

Netback 2 8 0

  • 5 1

4 3 3 5 (Gain) Loss on Risk Management ( 1 8 3 )

  • 3

( 1 8 0 ) Operating Margin 4 6 3

  • 5 1

1 5 1 5

Cenovus Energy Inc. Second Quarter 2017 Report Page 92 Netback Reconciliations

slide-93
SLIDE 93

Oil Sands

Basis of Netback Calculation Adjustm ents Per I nterim Consolidated Financial Statem ents

( 1 )

Three Months Ended June 30, 2017 ($ millions) Foster Creek Christina Lake Total Crude Oil Natural Gas Condensate I nventory Other Total Oil Sands Revenues Gross Sales 4 2 9 5 1 4 9 4 3 4 7 1 9

  • 1 ,6 6 6

Less: Royalties 2 4 1 2 3 6

  • 3 6

4 0 5 5 0 2 9 0 7 4 7 1 9

  • 1 ,6 3 0

Expenses Transportation and Blending 1 0 0 5 8 1 5 8

  • 7 1 9
  • 2

8 7 9 Operating 1 1 9 9 9 2 1 8 2

  • 1

2 2 1 Netback 1 8 6 3 4 5 5 3 1 2

  • ( 3 )

5 3 0 (Gain) Loss on Risk Management ( 9 ) ( 5 ) ( 1 4 )

  • ( 1 4 )

Operating Margin 1 9 5 3 5 0 5 4 5 2

  • ( 3 )

5 4 4 Basis of Netback Calculation Adjustm ents Per I nterim Consolidated Financial Statem ents

( 1 )

Three Months Ended June 30, 2016 ($ millions) Foster Creek Christina Lake Total Crude Oil Natural Gas Condensate I nventory Other Total Oil Sands Revenues Gross Sales 1 8 9 1 9 6 3 8 5 2 3 2 2

  • 7 0 9

Less: Royalties 1 2 3

  • 3

1 8 8 1 9 4 3 8 2 2 3 2 2

  • 7 0 6

Expenses Transportation and Blending 6 5 3 4 9 9

  • 3 2 2

( 2 6 )

  • 3 9 5

Operating 5 7 4 4 1 0 1 2

  • 1

1 0 4 Netback 6 6 1 1 6 1 8 2

  • 2 6

( 1 ) 2 0 7 (Gain) Loss on Risk Management ( 1 1 ) ( 1 3 ) ( 2 4 )

  • ( 2 4 )

Operating Margin 7 7 1 2 9 2 0 6

  • 2 6

( 1 ) 2 3 1 Basis of Netback Calculation Adjustm ents Per I nterim Consolidated Financial Statem ents

( 1 )

Six Months Ended June 30, 2017 ($ millions) Foster Creek Christina Lake Total Crude Oil Natural Gas Condensate I nventory Other Total Oil Sands Revenues Gross Sales 7 1 6 8 0 4 1 ,5 2 0 6 1 ,1 9 7

  • 5

2 ,7 2 8 Less: Royalties 4 4 1 9 6 3

  • 6 3

6 7 2 7 8 5 1 ,4 5 7 6 1 ,1 9 7

  • 5

2 ,6 6 5 Expenses Transportation and Blending 1 5 5 9 1 2 4 6

  • 1 ,1 9 7

1 1 1 ,4 4 5 Operating 1 9 0 1 6 4 3 5 4 5

  • 2

3 6 1 Netback 3 2 7 5 3 0 8 5 7 1

  • ( 1 )

2 8 5 9 (Gain) Loss on Risk Management 3 1 3 2 6 3

  • 6 3

Operating Margin 2 9 6 4 9 8 7 9 4 1

  • ( 1 )

2 7 9 6 Basis of Netback Calculation Adjustm ents Per I nterim Consolidated Financial Statem ents

( 1 )

Six Months Ended June 30, 2016 ($ millions) Foster Creek Christina Lake Total Crude Oil Natural Gas Condensate I nventory Other Total Oil Sands Revenues Gross Sales 2 5 4 2 6 1 5 1 5 6 6 5 7

  • 1

1 ,1 7 9 Less: Royalties 1 2 3

  • 3

2 5 3 2 5 9 5 1 2 6 6 5 7

  • 1

1 ,1 7 6 Expenses Transportation and Blending 1 1 3 7 3 1 8 6

  • 6 5 7

( 4 4 )

  • 7 9 9

Operating 1 2 4 9 9 2 2 3 5

  • 3

2 3 1 Netback 1 6 8 7 1 0 3 1

  • 4 4

( 2 ) 1 4 6 (Gain) Loss on Risk Management ( 6 3 ) ( 6 7 ) ( 1 3 0 )

  • ( 1 3 0 )

Operating Margin 7 9 1 5 4 2 3 3 1

  • 4 4

( 2 ) 2 7 6

(1) Found in Note 1 of the interim Consolidated Financial Statements.

Cenovus Energy Inc. Second Quarter 2017 Report Page 93 Netback Reconciliations

slide-94
SLIDE 94

Deep Basin

Basis of Netback Calculation Adjustm ents Per I nterim Consolidated Financial Statem ents

( 1 )

Three Months Ended June 30, 2017 ($ millions) Total Other Total Deep Basin Revenues Gross Sales 1 1 8 6 1 2 4 Less: Royalties 8

  • 8

1 1 0 6 1 1 6 Expenses Transportation and Blending 1 0

  • 1 0

Operating 4 7 4 5 1 Production and Mineral Taxes

  • Netback

5 3 2 5 5 (Gain) Loss on Risk Management

  • Operating Margin

5 3 2 5 5 Basis of Netback Calculation Adjustm ents Per I nterim Consolidated Financial Statem ents

( 1 )

Six Months Ended June 30, 2017 ($ millions) Total Other Total Deep Basin Revenues Gross Sales 1 1 8 6 1 2 4 Less: Royalties 8

  • 8

1 1 0 6 1 1 6 Expenses Transportation and Blending 1 0

  • 1 0

Operating 4 7 4 5 1 Production and Mineral Taxes

  • Netback

5 3 2 5 5 (Gain) Loss on Risk Management

  • Operating Margin

5 3 2 5 5

(1) Found in Note 1 of the interim Consolidated Financial Statements.

Conventional

Basis of Netback Calculation Adjustm ents Per I nterim Consolidated Financial Statem ents

( 1 )

Three Months Ended June 30, 2017 ($ millions) Heavy Oil Light & Medium NGLs Conventional Liquids Natural Gas Conventional Condensate I nventory Other Total Conventional Revenues Gross Sales 1 1 9 1 3 8 4 2 6 1 9 0 3 5 1 3 2

  • 3

3 8 6 Less: Royalties 1 6 2 8

  • 4 4

5 4 9

  • 1

5 0 1 0 3 1 1 0 4 2 1 7 8 5 3 0 2 3 2

  • 2

3 3 6 Expenses Transportation and Blending 1 1 7

  • 1 8

3 2 1 3 2

  • 1

5 4 Operating 3 7 3 9

  • 7 6

3 7 1 1 3

  • 2

1 1 5 Production and Mineral Taxes

  • 5
  • 5
  • 5
  • 5

Netback 5 5 5 9 4 1 1 8 4 5 1 6 3

  • ( 1 )

1 6 2 (Gain) Loss on Risk Management 2 1

  • 3
  • 3
  • 3

Operating Margin 5 3 5 8 4 1 1 5 4 5 1 6 0

  • ( 1 )

1 5 9 Basis of Netback Calculation Adjustm ents Per I nterim Consolidated Financial Statem ents

( 1 )

Three Months Ended June 30, 2016 ($ millions) Heavy Oil Light & Medium NGLs Conventional Liquids Natural Gas Conventional Condensate I nventory Other Total Conventional Revenues Gross Sales 9 5 1 1 6 1 2 1 2 5 3 2 6 5 2 7

  • 2

2 9 4 Less: Royalties 1 0 2 0 1 3 1 2 3 3

  • 3 3

8 5 9 6

  • 1 8 1

5 1 2 3 2 2 7

  • 2

2 6 1 Expenses Transportation and Blending 1 0 6

  • 1 6

5 2 1 2 7 ( 3 )

  • 4 5

Operating 3 1 3 9

  • 7 0

3 6 1 0 6

  • 1

1 0 7 Production and Mineral Taxes

  • 3
  • 3
  • 3
  • 3

Netback 4 4 4 8

  • 9 2

1 0 1 0 2

  • 3

1 1 0 6 (Gain) Loss on Risk Management ( 5 ) ( 6 )

  • ( 1 1 )
  • ( 1 1 )
  • ( 1 1 )

Operating Margin 4 9 5 4

  • 1 0 3

1 0 1 1 3

  • 3

1 1 1 7

(1) Found in Note 8 of the interim Consolidated Financial Statements.

Cenovus Energy Inc. Second Quarter 2017 Report Page 94 Netback Reconciliations

slide-95
SLIDE 95

Conventional

Basis of Netback Calculation Adjustm ents Per I nterim Consolidated Financial Statem ents

( 1 )

Six Months Ended June 30, 2017 ($ millions) Heavy Oil Light & Medium NGLs Conventional Liquids Natural Gas Conventional Condensate I nventory Other Total Conventional Revenues Gross Sales 2 3 2 2 6 6 9 5 0 7 1 8 5 6 9 2 6 5

  • 3

7 6 0 Less: Royalties 3 2 5 7 1 9 0 9 9 9

  • 1

1 0 0 2 0 0 2 0 9 8 4 1 7 1 7 6 5 9 3 6 5

  • 2

6 6 0 Expenses Transportation and Blending 1 9 1 3

  • 3 2

7 3 9 6 5

  • 1

1 0 5 Operating 6 8 7 7

  • 1 4 5

7 8 2 2 3

  • 2

2 2 5 Production and Mineral Taxes

  • 9
  • 9

1 1 0

  • 1 0

Netback 1 1 3 1 1 0 8 2 3 1 9 0 3 2 1

  • ( 1 )

3 2 0 (Gain) Loss on Risk Management 9 7

  • 1 6
  • 1 6
  • 1 6

Operating Margin 1 0 4 1 0 3 8 2 1 5 9 0 3 0 5

  • ( 1 )

3 0 4 Basis of Netback Calculation Adjustm ents Per I nterim Consolidated Financial Statem ents

( 1 )

Six Months Ended June 30, 2016 ($ millions) Heavy Oil Light & Medium NGLs Conventional Liquids Natural Gas Conventional Condensate I nventory Other Total Conventional Revenues Gross Sales 1 6 8 2 0 1 4 3 7 3 1 3 5 5 0 8 5 5

  • 5

5 6 8 Less: Royalties 1 4 3 3 1 4 8 5 5 3

  • 5 3

1 5 4 1 6 8 3 3 2 5 1 3 0 4 5 5 5 5

  • 5

5 1 5 Expenses Transportation and Blending 2 3 1 3

  • 3 6

8 4 4 5 5 ( 7 )

  • 9 2

Operating 7 1 7 9

  • 1 5 0

7 8 2 2 8

  • 1

2 2 9 Production and Mineral Taxes

  • 5
  • 5
  • 5
  • 5

Netback 6 0 7 1 3 1 3 4 4 4 1 7 8

  • 7

4 1 8 9 (Gain) Loss on Risk Management ( 2 7 ) ( 2 6 )

  • ( 5 3 )

1 ( 5 2 )

  • 2

( 5 0 ) Operating Margin 8 7 9 7 3 1 8 7 4 3 2 3 0

  • 7

2 2 3 9

(1) Found in Note 8 of the interim Consolidated Financial Statements.

The following table provides the sales volumes used to calculate Netback.

Sales Volum es

Three Months Ended June 3 0 , Six Months Ended June 3 0 , (barrels per day, unless otherwise stated) 2 0 1 7 2016 2 0 1 7 2016 Oil Sands Foster Creek 1 0 6 ,1 1 5 62,089 9 2 ,4 1 5 61,129 Christina Lake 1 5 4 ,4 3 1 76,066 1 2 2 ,3 5 3 78,092 Total Oil Sands Crude Oil 2 6 0 ,5 4 6 138,155 2 1 4 ,7 6 8 139,221 Natural Gas (MMcf per day) 1 2 18 1 3 17 Deep Basin Total Liquids 1 6 ,8 9 4

  • 8 ,4 9 4
  • Natural Gas (MMcf per day)

2 5 3

  • 1 2 7
  • Conventional

Heavy Oil 2 8 ,0 8 9 28,294 2 7 ,1 6 1 29,529 Light and Medium Oil 2 6 ,8 3 5 26,407 2 5 ,9 5 9 26,808 Natural Gas Liquids (“NGLs”) 1 ,1 3 2 799 1 ,0 9 0 1,003 Total Conventional Liquids 5 6 ,0 5 6 55,500 5 4 ,2 1 0 57,340 Natural Gas (MMcf per day) 3 5 5 381 3 5 2 386 Total Liquids Sales 3 3 3 ,4 9 6 193,655 2 7 7 ,4 7 2 196,561 Total Sales (BOE per day) 4 3 6 ,7 6 1 260,155 3 5 9 ,4 6 5 263,728

Cenovus Energy Inc. Second Quarter 2017 Report Page 95 Netback Reconciliations

slide-96
SLIDE 96

Cenovus Energy I nc. 500 Centre Street SE PO Box 766 Calgary, AB T2P 0M5 Phone: 403-766-2000 Fax: 403-766-7600 CENOVUS CONTACTS I nvestor Relations: Media: Kam Sandhar General m edia line Vice-President, Investor Relations & Corporate Development 403-766-7751 403-766-5883 media.relations@cenovus.com kam.sandhar@cenovus.com Steven Murray Manager, Investor Relations 403-766-3382 steven.murray@cenovus.com Graham I ngram Specialist, Investor Relations 403-766-2849 graham.ingram@cenovus.com Michelle Cheyne Analyst, Investor Relations 403-766-2584 michelle.cheyne@cenovus.com

cenovus.com