
CAS BUDGET PRESENTATION PBAC ABOUT CAS
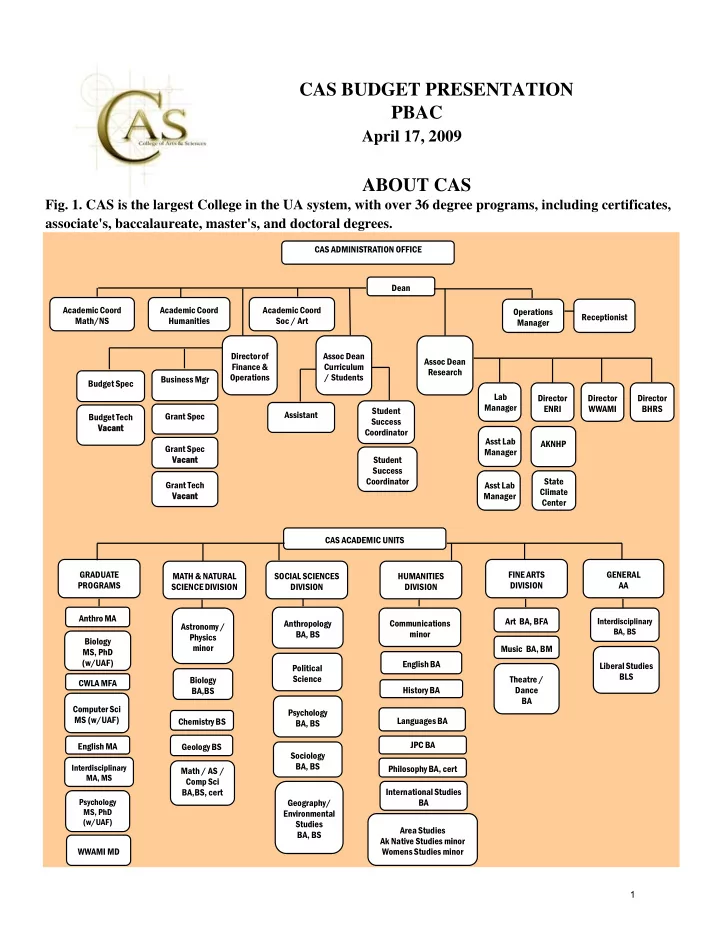
- Fig. 1. CAS is the largest College in the UA system, with over 36 degree programs, including certificates,
April 17, 2009
associate's, baccalaureate, master's, and doctoral degrees.
CAS ADMINISTRATION OFFICE Operations Manager CAS ACADEMIC UNITS Sociology BA, BS Art BA, BFA Music BA, BM Theatre / Dance BA Interdisciplinary BA, BS Liberal Studies BLS Psychology BA, BS Anthropology BA, BS Political Science Biology BA,BS Chemistry BS Geology BS Math / AS / Comp Sci BA,BS, cert Astronomy / Physics minor Communications minor English BA History BA Languages BA JPC BA Philosophy BA, cert Area Studies Ak Native Studies minor Womens Studies minor Academic Coord Math/NS Academic Coord Humanities Academic Coord Soc / Art Receptionist Assoc Dean Research Student Success Coordinator Student Success Coordinator Assistant Budget Spec Budget Tech Vacant ant Business Mgr Grant Spec Grant Spec Vacant ant Grant Tech Vacant ant AKNHP Director ENRI Director WWAMI Director BHRS Dean GRADUATE PROGRAMS MATH & NATURAL SCIENCE DIVISION SOCIAL SCIENCES DIVISION HUMANITIES DIVISION FINE ARTS DIVISION GENERAL AA Anthro MA Biology MS, PhD (w/UAF) CWLA MFA Computer Sci MS (w/UAF) English MA Interdisciplinary MA, MS Psychology MS, PhD (w/UAF) WWAMI MD Geography/ Environmental Studies BA, BS International Studies BA Director of Finance & Operations Assoc Dean Curriculum / Students State Climate Center Lab Manager Asst Lab Manager Asst Lab Manager 1