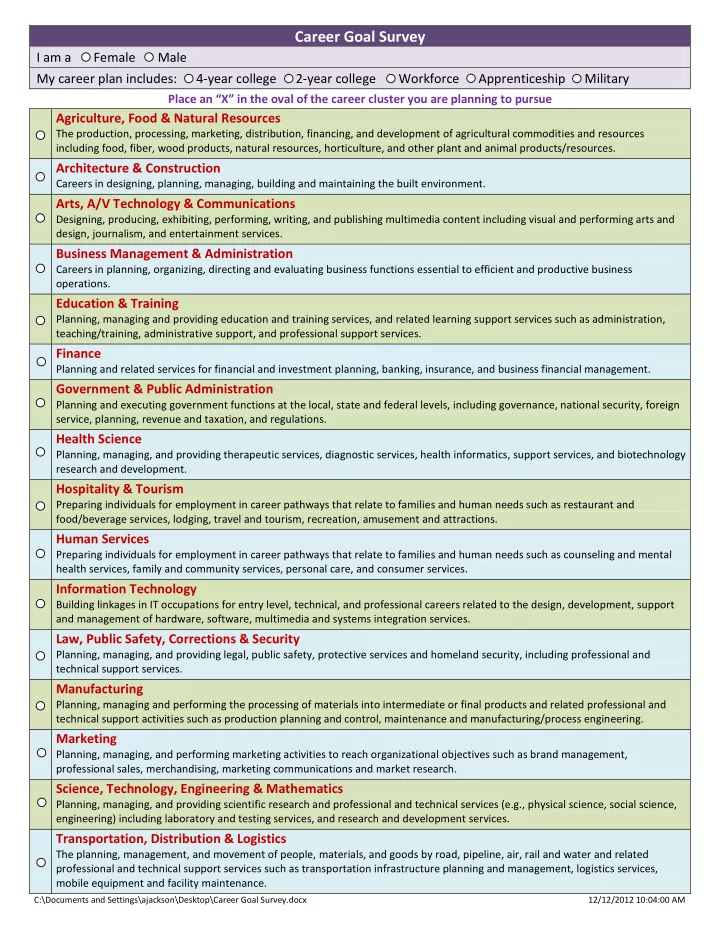
SLIDE 1 Career Goal Survey
I am a Female Male My career plan includes: 4-year college 2-year college Workforce Apprenticeship Military
Place an “X” in the oval of the career cluster you are planning to pursue
Agriculture, Food & Natural Resources
The production, processing, marketing, distribution, financing, and development of agricultural commodities and resources including food, fiber, wood products, natural resources, horticulture, and other plant and animal products/resources.
Architecture & Construction
Careers in designing, planning, managing, building and maintaining the built environment.
Arts, A/V Technology & Communications
Designing, producing, exhibiting, performing, writing, and publishing multimedia content including visual and performing arts and design, journalism, and entertainment services.
Business Management & Administration
Careers in planning, organizing, directing and evaluating business functions essential to efficient and productive business
Education & Training
Planning, managing and providing education and training services, and related learning support services such as administration, teaching/training, administrative support, and professional support services.
Finance
Planning and related services for financial and investment planning, banking, insurance, and business financial management.
Government & Public Administration
Planning and executing government functions at the local, state and federal levels, including governance, national security, foreign service, planning, revenue and taxation, and regulations.
Health Science
Planning, managing, and providing therapeutic services, diagnostic services, health informatics, support services, and biotechnology research and development.
Hospitality & Tourism
Preparing individuals for employment in career pathways that relate to families and human needs such as restaurant and food/beverage services, lodging, travel and tourism, recreation, amusement and attractions.
Human Services
Preparing individuals for employment in career pathways that relate to families and human needs such as counseling and mental health services, family and community services, personal care, and consumer services.
Information Technology
Building linkages in IT occupations for entry level, technical, and professional careers related to the design, development, support and management of hardware, software, multimedia and systems integration services.
Law, Public Safety, Corrections & Security
Planning, managing, and providing legal, public safety, protective services and homeland security, including professional and technical support services.
Manufacturing
Planning, managing and performing the processing of materials into intermediate or final products and related professional and technical support activities such as production planning and control, maintenance and manufacturing/process engineering.
Marketing
Planning, managing, and performing marketing activities to reach organizational objectives such as brand management, professional sales, merchandising, marketing communications and market research.
Science, Technology, Engineering & Mathematics
Planning, managing, and providing scientific research and professional and technical services (e.g., physical science, social science, engineering) including laboratory and testing services, and research and development services.
Transportation, Distribution & Logistics
The planning, management, and movement of people, materials, and goods by road, pipeline, air, rail and water and related professional and technical support services such as transportation infrastructure planning and management, logistics services, mobile equipment and facility maintenance.
C:\Documents and Settings\ajackson\Desktop\Career Goal Survey.docx 12/12/2012 10:04:00 AM
SLIDE 2
Erie County Technical School Career Interest Survey 9th Graders 2012‐2013
Gender Career Plan Industry Gender Career Plan Industry % Industry PA HPO SOCs % SOC Combo
Female 4‐Year College Agriculture, Food & Natural Resource 618 1363 130 7% 5 3% 9% Male 2‐Year College Architecture & Construction 650 229 148 8% 21 11% 19% Duplicate Workforce Arts, A/V Tech & Communications 658 131 244 13% 2 1% 14% Blank Apprenticeship Business Management & Administration 5 24 84 4% 26 14% 19% Military Education & Training 93 152 8% 9 5% 13% Blank Finance 91 28 1% 10 5% 7% Government & Public Administration 17 1% 1 1% 1% Health Science 215 11% 20 11% 22% Hospitality & Tourism 68 4% 0% 4% Human Services 195 10% 6 3% 13% Information Technology 66 3% 12 7% 10% Law, Public Safety, Corrections & Security 100 5% 3 2% 7% Manufacturing 126 7% 31 17% 23% Marketing 47 2% 13 7% 10% Science, Technology, Engineering & Math 152 8% 6 3% 11% Transportation, Distribution & Logistics 158 8% 18 10% 18% 1,268 1,840 1,930 100% 183 100% 200% 1,931
1/24/2013 S:\Student Services\Admissions\Career Plan Survey\Career Plan Survey
SLIDE 3
C:\Documents and Settings\ajackson\Desktop\Board Present‐‐Interest Industry\Career Interest Summary by Highest Industry.docxJanuary 24, 2013
Erie County Technical School Career Plan Survey 9th Graders 2012‐2013 Sorted by Highest Student Interest
Industry Industry % Industry
Arts, A/V Tech & Communications 244 13% Health Science 215 11% Human Services 195 10% Transportation, Distribution & Logistics 158 8% Education & Training 152 8% Science, Technology, Engineering & Math 152 8% Architecture & Construction 148 8% Agriculture, Food & Natural Resource 130 7% Manufacturing 126 7% Law, Public Safety, Corrections & Security 100 5% Business Management & Administration 84 4% Hospitality & Tourism 68 4% Information Technology 66 3% Marketing 47 2% Finance 28 1% Government & Public Administration 17 1%
SLIDE 4 Center for Workforce Information & Analysis 10/01/2012
SOC Code Occupation Educational Attainment 1 Industry Cluster Wage, 2011 Industry Cluster All Industries Percent Employment Change, 2008-2010 Percent Change in Wages, 2009-2011 Unempl. Rate, 2009- 2011 Completers as Percent
Openings Source 2
11-1021 General & Operations Managers AD+ $117,213 79 956 28.20% 9.20% 6.25% 271.03% Criteria Met 11-3051 Industrial Production Managers BD+ $95,149 97 217 2.13% 6.65% 6.68% 157.14% Criteria Met 13-1023 Purchasing Agents LT OJT $57,750 88 396
7.04% 7.86% 7.07% Criteria Met 17-2112 Industrial Engineers BD $75,667 113 359 13.26% 2.20% 1.19% 53.20% Criteria Met 17-2141 Mechanical Engineers BD $74,353 125 452 16.15% 2.19% 5.83% 191.37% Criteria Met 17-3013 Mechanical Drafters AD $48,791 36 114 4.87% 0.12% 10.20% 191.23% 2009 Petition 17-3026 Industrial Engineering Technicians AD $52,446 36 98
0.64% 12.51% 337.76% 2009 Petition 41-4012 Sales Representatives MT OJT $67,543 159 2,357
2.92% 6.20% 19.73% Criteria Met 43-4051 Customer Service Representatives ST OJT $39,352 145 3,240
2.19% 9.29% 5.40% Criteria Met 43-5061 Production, Planning & Expediting Clerks MT OJT $48,173 97 372
5.04% 2.89% 6.45% Criteria Met 43-5071 Shipping, Receiving & Traffic Clerks ST OJT $33,848 123 697
2.15% 8.41% 7.03% Criteria Met 49-9041 Industrial Machinery Mechanics LT OJT $46,340 210 738 5.54% 2.24% 4.46% 2.17% Criteria Met 49-9043 Maintenance Workers, Machinery MT OJT $37,622 17 71 16.67%
22.68% 4.23% 2009 Petition 49-9071 Maintenance & Repair Workers, General MT OJT $41,621 103 1,443
N/A N/A N/A
0.76% 2009 Petition 51-1011 Supervisors - Production & Operating Workers PS $57,257 150 362
1.99% 5.51% 0.28% CWIA Added 51-4011 Computer-Controlled Machine Tool Operators, Metal & Plastic MT OJT $37,191 191 249
5.02% 21.07% 2.41% CWIA Added 51-4012 Numerical Tool & Process Control Programmers MT OJT $45,268 25 39
1.35% 21.07% 12.82% 2009 Petition 51-4021 Extruding & Drawing Machine Setters, Oprs & Tenders, Metal & Plastic MT OJT $37,761 153 207 22.76% 2.06% 0.00% 4.83% Criteria Met 51-4041 Machinists LT OJT $39,894 327 508
3.83% 11.30% 3.74% CWIA Added 51-4081 Multiple Machine Tool Setters, Operators & Tenders, Metal & Plastic MT OJT $35,339 91 119
3.18% 0.00% 4.20% Criteria Met 51-4121 Welders, Cutters, Solderers & Brazers MT OJT $37,297 250 528
4.54% 15.84% 21.78% CWIA Added 51-4191 Heat Treating Equipment Setters, Operators & Tenders, Metal & Plastic MT OJT $36,882 129 138 1.75%
0.00% 1.45% CWIA Added 51-9061 Inspectors, Testers, Sorters, Samplers & Weighers MT OJT $38,100 245 593
5.74% 8.87% 0.17% CWIA Added
2012 HPO's in the Advanced Materials and Diversified Manufacturing (AMDM) Industry Cluster
(Highlighted occupations are new additions in 2012)
Job Openings All Industries
Page 1 of 10
SLIDE 5 Center for Workforce Information & Analysis 10/01/2012
SOC Code Occupation Educational Attainment 1 Industry Cluster Wage, 2011 Industry Cluster All Industries Percent Employment Change, 2008-2010 Percent Change in Wages, 2009-2011 Unempl. Rate, 2009- 2011 Completers as Percent
Openings Source 2
11-9013 Farm & Agricultural Managers WK EXP $55,121 803
N/A N/A N/A
201.49% 2010 Petition 29-2056 Veterinary Technologists & Technicians AD $32,514 58 188 5.14% 8.49% 0.87% 36.17% Criteria Met 41-4012 Sales Representatives MT OJT $55,664 196 2,357
2.92% 6.20% 19.73% Criteria Met 43-4051 Customer Service Representatives ST OJT $34,067 46 3,240
2.19% 9.29% 5.40% Criteria Met 43-5071 Shipping, Receiving & Traffic Clerks ST OJT $34,088 47 697
2.15% 8.41% 7.03% Criteria Met 45-1011 Farm & Forestry Worker Supervisors WK EXP $47,408 6 61
2.24% 5.14% 13.11% 2010 Petition 49-9041 Industrial Machinery Mechanics LT OJT $47,275 74 738 5.54% 2.24% 4.46% 2.17% Criteria Met 49-9071 Maintenance & Repair Workers, General MT OJT $40,690 47 1,443
N/A N/A N/A
0.76% Criteria Met 51-9111 Packaging & Filling Machine Operators & Tenders MT OJT $33,345 128 351 4.53% 6.73% 20.89% 0.28% Criteria Met 53-3031 Driver/Sales Workers ST OJT $36,544 114 425
5.57% 7.77% 0.00% CWIA Added 53-3032 Heavy & Tractor-Trailer Truck Drivers WK EXP $45,223 209 2,575
3.30% 7.77%
N/A Criteria Met
53-3033 Light Truck or Delivery Services Drivers ST OJT $32,502 52 941
2.96% 7.77%
N/A Criteria Met SOC Code Occupation Educational Attainment 1 Industry Cluster Wage, 2011 Industry Cluster All Industries Percent Employment Change, 2008-2010 Percent Change in Wages, 2009-2011 Unempl. Rate, 2009- 2011 Completers as Percent
Openings Source 2
17-2112 Industrial Engineers BD $81,611 35 359 13.26% 2.20% 1.19% 53.20% Criteria Met 17-2141 Mechanical Engineers BD $85,795 41 452 16.15% 2.19% 5.83% 191.37% Criteria Met 19-4021 Biological Technicians BD $43,413 90 136 3.11%
0.00% 95.59% CWIA Added 29-2037 Radiologic Technologists and Technicians AD $55,051 42 326
N/A N/A N/A N/A Criteria Met
41-4011 Sales Representatives, Technical & Scientific Products BD $94,803 52 506
14.96% 6.20% 6.32% Criteria Met 43-4051 Customer Service Representatives ST OJT $55,746 53 3,240
2.19% 9.29% 5.40% Criteria Met 43-9061 Office Clerks, General ST OJT $35,014 32 3,629
4.21% 9.91% 7.50% Criteria Met 51-9111 Packaging & Filling Machine Operators & Tenders MT OJT $31,736 46 351 4.53% 6.73% 20.89% 0.28% Criteria Met
Job Openings All Industries
2012 HPO's in the Bio-Medical (BM) Industry Cluster
(Highlighted occupations are new additions in 2012)
Job Openings All Industries
(Highlighted occupations are new additions in 2012)
2012 HPO's in the Agriculture and Food Production (AFP) Industry Cluster
Page 2 of 10
SLIDE 6 Center for Workforce Information & Analysis 10/01/2012
SOC Code Occupation Educational Attainment 1 Industry Cluster Wage, 2011 Industry Cluster All Industries Percent Employment Change, 2008-2010 Percent Change in Wages, 2009-2011 Unempl. Rate, 2009- 2011 Completers as Percent
Openings Source 2
13-1051 Cost Estimators BD $62,164 193 386
1.45% 4.47% 6.22% CWIA Added 41-4012 Sales Representatives MT OJT $62,481 202 2,357
2.92% 6.20% 19.73% Criteria Met 47-1011 Supervisors - Construction Trades & Extraction Workers WK EXP $69,251 393 675
6.73% 7.70% 8.15% Criteria Met 47-2021 Brickmasons & Blockmasons LT OJT $50,372 152 207
1.50% 27.73% 7.25% CWIA Added 47-2031 Carpenters LT OJT $42,523 881 1,526
15.89% 3.93% CWIA Added 47-2051 Cement Masons & Concrete Finishers MT OJT $40,802 123 137
1.48% 21.20% 0.00% CWIA Added 47-2073 Operating Engineers & Other Construction Equipment Operators MT OJT $48,547 356 828 32.03% 6.68% 16.76% 0.24% Criteria Met 47-2111 Electricians LT OJT $57,838 580 796
0.52% 9.72% 18.72% CWIA Added 47-2132 Insulation Workers, Mechanical LT OJT $69,743 29 32
9.37% 35.01% 0.00% 2010 Petition 47-2141 Painters, Construction & Maintenance MT OJT $39,716 136 319
8.25% 18.46% 0.31% Criteria Met 47-2152 Plumbers, Pipefitters & Steamfitters LT OJT $53,057 451 625 2.33%
17.07% 6.24% Criteria Met 47-2181 Roofers MT OJT $37,605 80 104
23.55% 0.00% Criteria Met 47-2211 Sheet Metal Workers LT OJT $49,916 51 83
5.93% 2.41% CWIA Added 49-9021 Heating, A/C & Refrigeration Mechanics & Installers PS $45,735 338 542 2.26% 7.51% 11.11% 30.26% Criteria Met 53-3032 Heavy & Tractor-Trailer Truck Drivers WK EXP $37,326 272 2,575
3.30% 7.77%
N/A Criteria Met
2012 HPO's in the Building and Construction (BC) Industry Cluster
(Highlighted occupations are new additions in 2012)
Job Openings All Industries
Page 3 of 10
SLIDE 7 Center for Workforce Information & Analysis 10/01/2012
SOC Code Occupation Educational Attainment 1 Industry Cluster Wage, 2011 Industry Cluster All Industries Percent Employment Change, 2008-2010 Percent Change in Wages, 2009-2011 Unempl. Rate, 2009- 2011 Completers as Percent
Openings Source 2
11-1021 General & Operations Managers AD+ $144,168 155 956 28.20% 9.20% 6.25% 271.03% Criteria Met 11-2022 Sales Managers BD+ $127,045 91 380 14.23% 5.72% 4.00% 104.21% Criteria Met 13-1031 Claims Adjusters, Examiners & Investigators LT OJT $59,890 203 349
4.65% 6.44% 13.75% CWIA Added 13-1081 Logisticians BD+ $73,618 80 213
3.88% 1.48% 12.21% CWIA Added 13-1111 Management Analysts BD+ $99,399 305 686 0.30% 4.49% 6.04% 11.22% Criteria Met 13-1151 Training & Development Specialists BD $58,318 96 329
N/A N/A N/A
75.38% Criteria Met 13-1161 Market Research Analysts & Marketing Specialists BD $62,318 440 889
N/A N/A N/A
267.27% Criteria Met 13-2011 Accountants & Auditors BD $73,832 860 1,668
4.23% 5.10% 168.59% Criteria Met 13-2072 Loan Officers MT OJT $63,489 323 338
14.95% 15.21% 106.80% CWIA Added 15-1121 Computer Systems Analysts BD $78,223 170 627
N/A N/A N/A
136.52% Criteria Met 15-1132 Software Developers, Applications BD $87,698 88 334
N/A N/A N/A
160.18% Criteria Met 15-1142 Network & Computer Systems Administrators BD $81,180 210 575
N/A N/A N/A
261.74% Criteria Met 15-1150 Computer Support Specialists PS $49,999 178 783
N/A N/A N/A N/A
Criteria Met 17-2112 Industrial Engineers BD $80,945 79 359 13.26% 2.20% 1.19% 53.20% Criteria Met 23-2011 Paralegals & Legal Assistants AD $51,365 208 266
4.93% 3.21% 125.19% Criteria Met 29-2056 Veterinary Technologists & Technicians AD $32,481 123 188 5.14% 8.49% 0.87% 36.17% Criteria Met 37-2021 Pest Control Workers MT OJT $33,511 103 126 21.15% 3.22% 42.15% 0.00% Criteria Met 41-3021 Insurance Sales Agents MT OJT $77,041 432 611
14.05% 7.69% 5.24% CWIA Added 41-3031 Securities, Commodities & Financial Services Sales Agents BD $86,654 315 349 13.65%
1.38% 15.19% CWIA Added 41-9022 Real Estate Sales Agents LT OJT $53,218 208 466 9.02% 9.66% 1.52% 15.02% Criteria Met 43-1011 Supervisors - Office & Administrative Support Workers WK EXP $55,496 534 1,762 10.58% 4.80% 6.08% 114.93% Criteria Met 43-3011 Bill & Account Collectors MT OJT $34,399 201 327
8.63% 5.54% 11.01% Criteria Met 43-3021 Billing & Posting Clerks ST OJT $34,596 173 619 7.05% 3.63% 4.27% 20.03% Criteria Met 43-3031 Bookkeeping, Accounting & Auditing Clerks MT OJT $37,967 317 1,200
4.94% 3.11% 144.25% CWIA Added 43-4051 Customer Service Representatives ST OJT $33,820 1,423 3,240
2.19% 9.29% 5.40% Criteria Met 43-4131 Loan Interviewers & Clerks ST OJT $33,467 89 92
5.70% 0.82% 10.87% CWIA Added 43-6011 Executive Secretaries & Executive Administrative Assistants WK EXP $48,722 166 631
11.24% 4.15% 16.48% CWIA Added 43-6012 Legal Secretaries MT OJT $44,326 179 200
7.11% 4.15% 17.00% CWIA Added 43-9041 Insurance Claims & Policy Processing Clerks MT OJT $39,930 217 330
6.35% 1.67% 11.82% Criteria Met 49-2098 Security & Fire Alarm Systems Installers MT OJT $46,819 107 155 13.77% 12.10% 2.65% 14.84% Criteria Met 49-9071 Maintenance & Repair Workers, General MT OJT $34,097 318 1,443
N/A N/A N/A
0.76% Criteria Met
Job Openings All Industries
(Highlighted occupations are new additions in 2012)
2012 HPO's in the Business and Financial Services (BFS) Industry Cluster
Page 4 of 10
SLIDE 8 Center for Workforce Information & Analysis 10/01/2012
SOC Code Occupation Educational Attainment 1 Industry Cluster Wage, 2011 Industry Cluster All Industries Percent Employment Change, 2008-2010 Percent Change in Wages, 2009-2011 Unempl. Rate, 2009- 2011 Completers as Percent
Openings Source 2
25-1011 Business Teachers, Postsecondary PhD $88,722 111 112 2.55% 8.73% 4.06% 40.18% Criteria Met 25-1072 Nursing Instructors & Teachers, Postsecondary MD $75,507 66 75 19.59% 14.42% 4.06% 36.00% CWIA Added 25-1081 Education Teachers, Postsecondary PhD $73,129 92 92 3.34% 7.94% 4.06% 65.22% Criteria Met 25-1194 Vocational Education Teachers, Postsecondary WK EXP $51,753 90 120 11.51% 2.79% 4.06% 72.50% Criteria Met 25-2011 Preschool Teachers AD $28,295 342 514
9.02% 5.72% 74.32% 2008 Petition 25-2032 Career/Technical Education Teachers, Secondary School BD+ $61,784 125 126
5.80% 2.98% 26.98% Criteria Met 25-2053 Special Education Teachers, Middle School BD $64,791 150 152
N/A N/A N/A
209.21% Criteria Met 25-2054 Special Education Teachers, Secondary School BD $61,955 200 204
N/A N/A N/A
248.53% Criteria Met 27-2022 Coaches & Scouts LT OJT $32,535 267 394
7.10% 5.91% 119.29% Criteria Met 43-6014 Secretaries ST OJT $33,426 263 1,264 0.24% 6.19% 4.15% 17.33% Criteria Met
2012 HPO's in the Education (ED) Industry Cluster
(Highlighted occupations are new additions in 2012)
Job Openings All Industries
Page 5 of 10
SLIDE 9 Center for Workforce Information & Analysis 10/01/2012
SOC Code Occupation Educational Attainment 1 Industry Cluster Wage, 2011 Industry Cluster All Industries Percent Employment Change, 2008-2010 Percent Change in Wages, 2009-2011 Unempl. Rate, 2009- 2011 Completers as Percent
Openings Source 2
11-1021 General & Operations Managers AD+ $117,080 27 956 28.20% 9.20% 6.25% 271.03% Criteria Met 43-4051 Customer Service Representatives ST OJT $37,862 45 3,240
2.19% 9.29% 5.40% Criteria Met 43-9061 Office Clerks, General ST OJT $32,131 46 3,629
4.21% 9.91% 7.50% Criteria Met 47-1011 Supervisors - Construction Trades & Extraction Workers WK EXP $69,092 65 675
6.73% 7.70% 8.15% Criteria Met 47-2073 Operating Engineers & Other Construction Equipment Operators MT OJT $48,355 105 828 32.03% 6.68% 16.76% 0.24% Criteria Met 47-5012 Rotary Drill Operators, Oil & Gas MT OJT $45,658 128 134 2.80% 5.18% 8.01%
N/A Criteria Met
47-5013 Service Unit Operators, Oil, Gas & Mining MT OJT $47,861 124 131 20.93% 53.46% 8.01%
N/A Criteria Met
47-5071 Roustabouts, Oil & Gas MT OJT $35,831 135 137
24.76% 33.33%
N/A CWIA Added
49-1011 Supervisors - Mechanics, Installers & Repairers WK EXP $69,840 33 448
2.68% 4.11% 1.12% Criteria Met 49-2095 Elec. Repairers, Powerhouse & Substation PS $64,667 47 55 23.21% 8.08% 0.00% 3.64% 2010 Petition 49-9041 Industrial Machinery Mechanics LT OJT $48,752 40 738 5.54% 2.24% 4.46% 2.17% Criteria Met 49-9051 Electrical Power-Line Installers & Repairers LT OJT $59,652 204 264 0.86% 0.44% 4.44% 10.98% Criteria Met 49-9071 Maintenance & Repair Workers, General MT OJT $40,500 47 1,443
N/A N/A N/A
0.76% Criteria Met 51-4121 Welders, Cutters, Solderers & Brazers MT OJT $39,391 44 528
4.54% 15.84% 21.78% CWIA Added 51-8013 Power Plant Operators LT OJT $61,241 88 100 7.86% 4.73% 11.74% 0.00% Criteria Met 51-8031 Water & Liquid Waste Treatment Plant & System Operators LT OJT $41,074 2 168
3.72% 2.67% 0.00% 2009 Petition 53-3032 Heavy & Tractor-Trailer Truck Drivers WK EXP $36,848 123 2,575
3.30% 7.77%
N/A Criteria Met
53-7073 Wellhead Pumpers MT OJT $36,090 105 114 157.14% 0.77% 0.00%
N/A CWIA Added
2012 HPO's in the Energy (ENGY) Industry Cluster
(Highlighted occupations are new additions in 2012)
Job Openings All Industries
Page 6 of 10
SLIDE 10 Center for Workforce Information & Analysis 10/01/2012
SOC Code Occupation Educational Attainment 1 Industry Cluster Wage, 2011 Industry Cluster All Industries Percent Employment Change, 2008-2010 Percent Change in Wages, 2009-2011 Unempl. Rate, 2009- 2011 Completers as Percent
Openings Source 2
21-1011 Substance Abuse & Behavioral Disorder Counselors MT OJT $37,972 153 247 21.54%
9.88% 106.07% Criteria Met 21-1014 Mental Health Counselors MD $38,047 447 631 12.40% 4.29% 9.88% 95.56% Criteria Met 21-1015 Rehabilitation Counselors MD $35,474 81 206
11.95% 9.88% 100.49% CWIA Added 21-1022 Healthcare Social Workers MD $48,815 198 344
9.98% 2.11% 68.90% CWIA Added 21-1023 Mental Health & Substance Abuse Social Workers BD $41,183 203 345 10.03% 7.22% 2.11% 78.26% Criteria Met 29-1031 Dietitians & Nutritionists BD $49,383 100 166 12.18%
4.06% 215.66% CWIA Added 29-1051 Pharmacists PROF $102,776 120 399 0.00% 7.17% 0.58% 229.07% Criteria Met 29-1111 Registered Nurses AD $67,499 4,247 4,784 0.78% 5.57% 0.64% 180.96% Criteria Met 29-1122 Occupational Therapists MD $70,267 200 236 0.00% 5.02% 0.00% 197.03% Criteria Met 29-1126 Respiratory Therapists AD $57,306 180 196 7.26% 5.75% 2.49% 75.00% Criteria Met 29-2011 Medical & Clinical Laboratory Technologists BD $55,192 140 181
2.26% 5.09% 29.83% CWIA Added 29-2012 Medical & Clinical Laboratory Technicians AD $43,059 161 226
5.91% 5.09% 55.75% CWIA Added 29-2021 Dental Hygienists AD $59,041 304 311 14.60% 0.94% 0.00% 92.93% Criteria Met 29-2031 Cardiovascular Technologists & Technicians AD $52,775 101 104
1.69% 4.76% 28.85% CWIA Added 29-2032 Diagnostic Medical Sonographers AD $61,937 88 101 1.35% 0.26% 4.76% 168.32% CWIA Added 29-2037 Radiologic Technologists and Technicians AD $53,313 277 326
N/A N/A N/A N/A Criteria Met
29-2041 Emergency Medical Technicians & Paramedics PS $30,499 556 637
5.99% 5.58% 10.68% Criteria Met 29-2052 Pharmacy Technicians MT OJT $35,133 89 418
5.78% 0.87% 14.35% Criteria Met 29-2055 Surgical Technologists PS $41,185 95 95
7.51% 0.87% 164.21% CWIA Added 29-2061 Licensed Practical & Licensed Vocational Nurses PS $42,659 1,212 1,450
3.92% 3.81% 19.17% Criteria Met 29-2071 Medical Records & Health Information Technicians PS $33,559 183 229
6.38% 7.19% 47.60% Criteria Met 31-2011 Occupational Therapist Assistants AD $46,683 73 78 0.51% 0.90% 0.00% 110.26% CWIA Added 31-2021 Physical Therapist Assistants AD $44,036 163 166 5.51% 4.66% 0.00% 112.05% Criteria Met 31-9091 Dental Assistants PS $32,584 343 351
2.29% 3.95% 27.92% Criteria Met 43-1011 Supervisors - Office & Administrative Support Workers WK EXP $51,066 291 1,762 10.58% 4.80% 6.08% 114.93% Criteria Met 43-3021 Billing & Posting Clerks ST OJT $32,688 224 619 7.05% 3.63% 4.27% 20.03% Criteria Met 43-4051 Customer Service Representatives ST OJT $34,843 272 3,240
2.19% 9.29% 5.40% Criteria Met 43-4111 Interviewers ST OJT $31,513 111 184
4.12% 25.74% 5.98% Criteria Met 43-6014 Secretaries ST OJT $32,173 176 1,264 0.24% 6.19% 4.15% 17.33% Criteria Met 43-9041 Insurance Claims & Policy Processing Clerks MT OJT $40,765 105 330
6.35% 1.67% 11.82% Criteria Met
Job Openings All Industries
(Highlighted occupations are new additions in 2012)
2012 HPO's in the Health Care (HC) Industry Cluster
Page 7 of 10
SLIDE 11 Center for Workforce Information & Analysis 10/01/2012
SOC Code Occupation Educational Attainment 1 Industry Cluster Wage, 2011 Industry Cluster All Industries Percent Employment Change, 2008-2010 Percent Change in Wages, 2009-2011 Unempl. Rate, 2009- 2011 Completers as Percent
Openings Source 2
13-2011 Accountants & Auditors BD $77,082 63 1,668
4.23% 5.10% 168.59% Criteria Met 15-1121 Computer Systems Analysts BD $79,661 240 627
N/A N/A N/A
136.52% Criteria Met 15-1131 Computer Programmers BD $71,733 161 331
N/A N/A N/A
203.02% Criteria Met 15-1132 Software Developers, Applications BD $87,171 135 334
N/A N/A N/A
160.18% Criteria Met 15-1133 Software Developers, Systems Software BD $96,739 342 505
N/A N/A N/A
176.24% Criteria Met 15-1142 Network & Computer Systems Administrators BD $79,877 124 575
N/A N/A N/A
261.74% Criteria Met 15-1150 Computer Support Specialists PS $49,999 178 783
N/A N/A N/A N/A
Criteria Met 17-2051 Civil Engineers BD $80,145 241 423 5.60% 3.47% 0.96% 186.76% Criteria Met 17-2141 Mechanical Engineers BD $86,367 88 452 16.15% 2.19% 5.83% 191.37% Criteria Met 17-3011 Architectural & Civil Drafters AD $46,481 67 99
7.65% 10.20% 287.88% 2008 Petition 41-4011 Sales Representatives, Technical & Scientific Products BD $96,463 91 506
14.96% 6.20% 6.32% Criteria Met 43-4051 Customer Service Representatives ST OJT $41,670 216 3,240
2.19% 9.29% 5.40% Criteria Met 43-9061 Office Clerks, General ST OJT $31,450 123 3,629
4.21% 9.91% 7.50% Criteria Met 47-4011 Construction & Building Inspectors WK EXP $48,809 99 237 1.93% 3.98% 6.92% 13.50% Criteria Met 49-2022 Telecommunications Equipment Installers & Repairers PS $54,385 98 136 0.00% 7.47% 7.16% 6.62% Criteria Met 49-9052 Telecommunications Line Installers & Repairers LT OJT $58,872 144 209
8.61% 8.46% 0.00% CWIA Added
2012 HPO's in the Information and Communication Services (ICS) Industry Cluster
(Highlighted occupations are new additions in 2012)
Job Openings All Industries
Page 8 of 10
SLIDE 12 Center for Workforce Information & Analysis 10/01/2012
SOC Code Occupation Educational Attainment 1 Industry Cluster Wage, 2011 Industry Cluster All Industries Percent Employment Change, 2008-2010 Percent Change in Wages, 2009-2011 Unempl. Rate, 2009- 2011 Completers as Percent
Openings Source 2
43-4051 Customer Service Representatives ST OJT $33,637 76 3,240
2.19% 9.29% 5.40% Criteria Met 43-5011 Cargo & Freight Agents ST OJT $42,543 95 138 10.23% 7.24% 0.00% 3.62% Criteria Met 43-5071 Shipping, Receiving & Traffic Clerks ST OJT $34,087 103 697
2.15% 8.41% 7.03% Criteria Met 49-3031 Bus & Truck Mechanics & Diesel Engine Specialists LT OJT $40,877 81 353
6.14% 2.03% 10.20% Criteria Met 49-9071 Maintenance & Repair Workers, General MT OJT $38,487 44 1,443
N/A N/A N/A
0.76% Criteria Met 53-1021 Supervisors - Helpers, Laborers & Material Movers WK EXP $53,047 106 253
6.10% 5.38% 7.91% Criteria Met 53-1031 Supervisors - Transportation & Vehicle Operations WK EXP $61,320 71 224
0.10% 5.38% 15.18% CWIA Added 53-3032 Heavy & Tractor-Trailer Truck Drivers WK EXP $44,007 1,294 2,575
3.30% 7.77%
N/A Criteria Met
53-3033 Light Truck or Delivery Services Drivers ST OJT $44,346 208 941
2.96% 7.77%
N/A Criteria Met
53-7051 Industrial Truck & Tractor Operators ST OJT $33,412 298 864
3.87% 6.61%
N/A CWIA Added SOC Code Occupation Educational Attainment 1 Industry Cluster Wage, 2011 Industry Cluster All Industries Percent Employment Change, 2008-2010 Percent Change in Wages, 2009-2011 Unempl. Rate, 2009- 2011 Completers as Percent
Openings Source 2
41-4012 Sales Representatives MT OJT $63,730 83 2,357
2.92% 6.20% 19.73% Criteria Met 43-4051 Customer Service Representatives ST OJT $36,726 27 3,240
2.19% 9.29% 5.40% Criteria Met 49-9041 Industrial Machinery Mechanics LT OJT $47,687 41 738 5.54% 2.24% 4.46% 2.17% Criteria Met 53-3032 Heavy & Tractor-Trailer Truck Drivers WK EXP $35,809 54 2,575
3.30% 7.77%
N/A Criteria Met
2012 HPO's in the Logistics and Transportation (LT) Industry Cluster
Job Openings All Industries
(Highlighted occupations are new additions in 2012)
Job Openings All Industries
2012 HPO's in the Lumber Wood and Paper (LWP) Industry Cluster
(Highlighted occupations are new additions in 2012) Page 9 of 10
SLIDE 13 Center for Workforce Information & Analysis 10/01/2012
SOC Code Occupation Educational Attainment 1 Industry Cluster Wage, 2011 Industry Cluster All Industries Percent Employment Change, 2008-2010 Percent Change in Wages, 2009-2011 Unempl. Rate, 2009- 2011 Completers as Percent
Openings Source 2
13-1022 Wholesale & Retail Buyers LT OJT $54,485 91 194
3.39% 22.16% CWIA Added 21-1021 Child, Family & School Social Workers BD $34,039 221 518
9.98% 2.11% 112.93% Criteria Met 41-1011 Supervisors - Retail Sales Workers WK EXP $44,294 817 1,132 0.44% 5.16% 4.94% 5.30% Criteria Met 41-2022 Parts Salespersons MT OJT $32,555 380 411
6.16% 8.81% 0.00% Criteria Met 49-3021 Automotive Body & Related Repairers MT OJT $40,230 179 211
2.74% 2.85% 12.32% CWIA Added 49-3023 Automotive Service Technicians & Mechanics LT OJT $35,499 1,025 1,258
0.47% 7.31% 15.10% Criteria Met 51-3021 Butchers & Meat Cutters LT OJT $31,531 176 234 17.81%
8.95% 0.00% Criteria Met
Short-term or Moderate-term training (ST OJT or MT OJT) – basic tasks and skills are learned through a period of on-the-job training. A high school diploma may be required. Long-term training (LT OJT) – a high school diploma and at least one year of on-the-job training or an apprenticeship. Related work experience (WK EXP) – a high school diploma and training gained through hands-on work in a similar occupation. Postsecondary training (PS or PS+) – training is gained through a postsecondary training program. Some period of related work experience may be required. Associate Degree (AD or AD+) – degree completed after two years of full-time schooling beyond high school. Some period of related work experience may be required. Bachelor’s Degree (BD or BD+) – degree completed after four years of full-time schooling beyond high school. Some period of related work experience may be required. Master’s Degree (MD or MD+) – degree completed after two years of full-time schooling beyond a bachelor’s degree. Some period of related work experience may be required. Doctoral (PhD) or First Professional Degree (PROF) – degree programs requiring 3-6 years of education at the college or university level beyond a four-year bachelor’s degree.
2 Source Definitions:
Criteria Met - Occupations met all of the data screens established for the HPO process. CWIA added - Occupations failing only one criteria screen (other than job openings) that were evaluated and added by the Center for Workforce Information & Analysis. 2008, 2009, 2010 or 2011 Petition - Occupation was added to the list via the formal petitioning process in the given year. Footnotes:
1 Educational Attainment Abbreviations:
2012 HPO's Outside of PA's Defined Industry Clusters
(Highlighted occupations are new additions in 2012)
Job Openings All Industries
Page 10 of 10
SLIDE 14
Table 5 SOC 2010 Career Cluster_Pathway
SOC CODE SOC TITLE Career Clstr SOC_Career Clusters PTHW Y NO PTHWY TITLE HPO_PA Employment Growth Ave Annual Employment Growth Quartile Student Rank Student Rank Quartile 33.9031 Gaming Surveillance Officers and Gaming Investig 12 Law, Public Safety, Co 12.3 Security & Protective Services 16.20% 4 7 2 39.1011 Gaming Supervisors 9 Hospitality & Tourism 9.4 Recreation, Amusements & Attractions 15.10% 4 5 2 39.1012 Slot Supervisors 9 Hospitality & Tourism 9.4 Recreation, Amusements & Attractions 13.50% 4 5 2 41.2012 Gaming Change Persons and Booth Cashiers 9 Hospitality & Tourism 9.4 Recreation, Amusements & Attractions 11.90% 4 5 2 39.3012 Gaming and Sports Book Writers and Runners 9 Hospitality & Tourism 9.4 Recreation, Amusements & Attractions 8.50% 4 5 2 39.3092 Costume Attendants 3 Arts, Audio/Video Te 3.4 Performing Arts 8.30% 4 16 4 39.3099 Entertainment Attendants and Related Workers, A 9 Hospitality & Tourism 9.4 Recreation, Amusements & Attractions 6.30% 4 5 2 39.3093 Locker Room, Coatroom, and Dressing Room Atte 10 Human Services 10.4 Personal Care Services 5.40% 4 14 4 43.3041 Gaming Cage Workers 9 Hospitality & Tourism 9.4 Recreation, Amusements & Attractions 4.70% 4 5 2 39.5094 Skincare Specialists 10 Human Services 10.4 Personal Care Services 3.20% 4 14 4 39.5092 Manicurists and Pedicurists 10 Human Services 10.4 Personal Care Services 2.80% 4 14 4 29.2052 Pharmacy Technicians 8 Health Science 8.1 Therapeutic Services 8 2.70% 4 15 4 39.9099 Personal Care and Service Workers, All Other 10 Human Services 10.4 Personal Care Services 2.20% 4 14 4 35.2013 Cooks, Private Household 9 Hospitality & Tourism 9.1 Services 2.20% 4 5 2 31.1011 Home Health Aides 8 Health Science 8.1 Therapeutic Services 2.10% 4 15 4 31.9092 Medical Assistants 8 Health Science 8.1 Therapeutic Services 2.10% 4 15 4 39.9021 Personal Care Aides 10 Human Services 10.4 Personal Care Services 2.10% 4 14 4 47.5051 Rock Splitters, Quarry 2 Architecture & Const 2.2 Construction 2.10% 4 10 3 29.2056 Veterinary Technologists and Technicians 8 Health Science 8.2 Diagnostic Services 2,5 2.00% 4 15 4 31.2021 Physical Therapist Assistants 8 Health Science 8.1 Therapeutic Services 8 1.80% 4 15 4 53.4031 Railroad Conductors and Yardmasters 16 Transportation, Distr 16.1 Transportation Operations 1.80% 4 13 4 29.1051 Pharmacists 8 Health Science 8.1 Therapeutic Services 8 1.70% 4 15 4 29.1071 Physician Assistants 8 Health Science 8.1 Therapeutic Services 1.70% 4 15 4 29.1124 Radiation Therapists 8 Health Science 8.1 Therapeutic Services 1.70% 4 15 4 29.1131 Veterinarians 8 Health Science 8.1 Therapeutic Services 1.70% 4 15 4 29.2031 Cardiovascular Technologists and Technicians 8 Health Science 8.2 Diagnostic Services 8 1.70% 4 15 4 21.1011 Substance Abuse and Behavioral Disorder Counse 10 Human Services 10.2 Counseling & Mental Health Services 8 1.70% 4 14 4 21.1093 Social and Human Service Assistants 10 Human Services 10.3 Family & Community Services 1.70% 4 14 4 19.4092 Forensic Science Technicians 12 Law, Public Safety, Co 12.4 Law Enforcement Services 1.70% 4 7 2 29.1123 Physical Therapists 8 Health Science 8.1 Therapeutic Services 1.60% 4 15 4 29.1126 Respiratory Therapists 8 Health Science 8.1 Therapeutic Services 8 1.60% 4 15 4 29.2055 Surgical Technologists 8 Health Science 8.1 Therapeutic Services 8 1.60% 4 15 4 31.2011 Occupational Therapy Assistants 8 Health Science 8.1 Therapeutic Services 8 1.60% 4 15 4 53.1011 Aircraft Cargo Handling Supervisors 16 Transportation, Distr 16.1 Transportation Operations 1.60% 4 13 4 25.1031 Architecture Teachers, Postsecondary 5 Education & Training 5.3 Teaching/Training 1.60% 4 12 3 25.1052 Chemistry Teachers, Postsecondary 5 Education & Training 5.3 Teaching/Training 1.60% 4 12 3 25.1053 Environmental Science Teachers, Postsecondary 5 Education & Training 5.3 Teaching/Training 1.60% 4 12 3 25.1061 Anthropology and Archeology Teachers, Postseco 5 Education & Training 5.3 Teaching/Training 1.60% 4 12 3 25.1063 Economics Teachers, Postsecondary 5 Education & Training 5.3 Teaching/Training 1.60% 4 12 3 25.1064 Geography Teachers, Postsecondary 5 Education & Training 5.3 Teaching/Training 1.60% 4 12 3 25.1111 Criminal Justice and Law Enforcement Teachers, P 5 Education & Training 5.3 Teaching/Training 1.60% 4 12 3 25.1113 Social Work Teachers, Postsecondary 5 Education & Training 5.3 Teaching/Training 1.60% 4 12 3 25.1191 Graduate Teaching Assistants 5 Education & Training 5.3 Teaching/Training 1.60% 4 12 3
1 August 2012
SLIDE 15
Table 5 SOC 2010 Career Cluster_Pathway
SOC CODE SOC TITLE Career Clstr SOC_Career Clusters PTHW Y NO PTHWY TITLE HPO_PA Employment Growth Ave Annual Employment Growth Quartile Student Rank Student Rank Quartile 17.2031 Biomedical Engineers 8 Health Science 8.5 Development 1.50% 4 15 4 29.2021 Dental Hygienists 8 Health Science 8.1 Therapeutic Services 8 1.50% 4 15 4 31.9091 Dental Assistants 8 Health Science 8.1 Therapeutic Services 8 1.50% 4 15 4 21.1023 Mental Health and Substance Abuse Social Worke 10 Human Services 10.2 Counseling & Mental Health Services 8 1.50% 4 14 4 31.9011 Massage Therapists 10 Human Services 10.4 Personal Care Services 1.50% 4 14 4 49.3093 Tire Repairers and Changers 16 Transportation, Distr 16.4 Maintenance 1.50% 4 13 4 53.4011 Locomotive Engineers 16 Transportation, Distr 16.1 Transportation Operations 1.50% 4 13 4 25.1011 Business Teachers, Postsecondary 5 Education & Training 5.3 Teaching/Training 6 1.50% 4 12 3 25.1022 Mathematical Science Teachers, Postsecondary 5 Education & Training 5.3 Teaching/Training 1.50% 4 12 3 25.1032 Engineering Teachers, Postsecondary 5 Education & Training 5.3 Teaching/Training 1.50% 4 12 3 25.1042 Biological Science Teachers, Postsecondary 5 Education & Training 5.3 Teaching/Training 1.50% 4 12 3 25.1043 Forestry and Conservation Science Teachers, Post 5 Education & Training 5.3 Teaching/Training 1.50% 4 12 3 25.1051 Atmospheric, Earth, Marine, and Space Sciences T 5 Education & Training 5.3 Teaching/Training 1.50% 4 12 3 25.1054 Physics Teachers, Postsecondary 5 Education & Training 5.3 Teaching/Training 1.50% 4 12 3 25.1062 Area, Ethnic, and Cultural Studies Teachers, Posts 5 Education & Training 5.3 Teaching/Training 1.50% 4 12 3 25.1065 Political Science Teachers, Postsecondary 5 Education & Training 5.3 Teaching/Training 1.50% 4 12 3 25.1066 Psychology Teachers, Postsecondary 5 Education & Training 5.3 Teaching/Training 1.50% 4 12 3 25.1067 Sociology Teachers, Postsecondary 5 Education & Training 5.3 Teaching/Training 1.50% 4 12 3 25.1071 Health Specialties Teachers, Postsecondary 5 Education & Training 5.3 Teaching/Training 1.50% 4 12 3 25.1081 Education Teachers, Postsecondary 5 Education & Training 5.3 Teaching/Training 6 1.50% 4 12 3 25.1112 Law Teachers, Postsecondary 5 Education & Training 5.3 Teaching/Training 1.50% 4 12 3 25.1121 Art, Drama, and Music Teachers, Postsecondary 5 Education & Training 5.3 Teaching/Training 1.50% 4 12 3 25.1122 Communications Teachers, Postsecondary 5 Education & Training 5.3 Teaching/Training 1.50% 4 12 3 25.1123 English Language and Literature Teachers, Postse 5 Education & Training 5.3 Teaching/Training 1.50% 4 12 3 25.1124 Foreign Language and Literature Teachers, Postse 5 Education & Training 5.3 Teaching/Training 1.50% 4 12 3 25.1125 History Teachers, Postsecondary 5 Education & Training 5.3 Teaching/Training 1.50% 4 12 3 25.1192 Home Economics Teachers, Postsecondary 5 Education & Training 5.3 Teaching/Training 1.50% 4 12 3 25.1193 Recreation and Fitness Studies Teachers, Postseco 5 Education & Training 5.3 Teaching/Training 1.50% 4 12 3 25.1199 Postsecondary Teachers, All Other 5 Education & Training 5.3 Teaching/Training 1.50% 4 12 3 39.2011 Animal Trainers 9 Hospitality & Tourism 9.4 Recreation, Amusements & Attractions 1.50% 4 5 2 33.3021 Detectives and Criminal Investigators 12 Law, Public Safety, Co 12.4 Law Enforcement Services 1.50% 4 7 2 29.1122 Occupational Therapists 8 Health Science 8.1 Therapeutic Services 8 1.40% 4 15 4 31.2022 Physical Therapist Aides 8 Health Science 8.1 Therapeutic Services 1.40% 4 15 4 21.1014 Mental Health Counselors 10 Human Services 10.2 Counseling & Mental Health Services 8 1.40% 4 14 4 21.1091 Health Educators 10 Human Services 10.3 Family & Community Services 1.40% 4 14 4 25.1021 Computer Science Teachers, Postsecondary 5 Education & Training 5.3 Teaching/Training 1.40% 4 12 3 25.1041 Agricultural Sciences Teachers, Postsecondary 5 Education & Training 5.3 Teaching/Training 1.40% 4 12 3 25.1072 Nursing Instructors and Teachers, Postsecondary 5 Education & Training 5.3 Teaching/Training 6 1.40% 4 12 3 33.3012 Correctional Officers and Jailers 12 Law, Public Safety, Co 12.1 Correction Services 1.40% 4 7 2 49.9062 Medical Equipment Repairers 13 Manufacturing 13.3 Maintenance, Installation & Repair 1.40% 4 8 2 27.1014 Multimedia Artists and Animators 3 Arts, Audio/Video Te 3.3 Visual Arts 1.30% 4 16 4 27.4032 Film and Video Editors 3 Arts, Audio/Video Te 3.5 Journalism and Broadcasting 1.30% 4 16 4 19.1041 Epidemiologists 8 Health Science 8.2 Diagnostic Services 1.30% 4 15 4
2 August 2012
SLIDE 16
Table 5 SOC 2010 Career Cluster_Pathway
SOC CODE SOC TITLE Career Clstr SOC_Career Clusters PTHW Y NO PTHWY TITLE HPO_PA Employment Growth Ave Annual Employment Growth Quartile Student Rank Student Rank Quartile 19.1042 Medical Scientists, Except Epidemiologists 8 Health Science 8.5 Development 1.30% 4 15 4 29.9091 Athletic Trainers 8 Health Science 8.1 Therapeutic Services 1.30% 4 15 4 39.5012 Hairdressers, Hairstylists, and Cosmetologists 10 Human Services 10.4 Personal Care Services 1.30% 4 14 4 39.5093 Shampooers 10 Human Services 10.4 Personal Care Services 1.30% 4 14 4 45.2092 Farmworkers and Laborers, Crop, Nursery, and Gr 1 Agriculture, Food & N 1.2 Plant Systems 1.30% 4 9 3 25.1082 Library Science Teachers, Postsecondary 5 Education & Training 5.3 Teaching/Training 1.30% 4 12 3 19.3092 Geographers 15 Science, Technology, 15.2 Science and Mathematics 1.30% 4 11 3 13.2051 Financial Analysts 6 Finance 6.2 Business Finance 1.30% 4 2 1 27.4011 Audio and Video Equipment Technicians 3 Arts, Audio/Video Te 3.5 Journalism and Broadcasting 1.20% 4 16 4 31.2012 Occupational Therapy Aides 8 Health Science 8.1 Therapeutic Services 1.20% 4 15 4 39.9011 Childcare Workers 10 Human Services 10.1 Services 1.20% 4 14 4 13.1081 Logisticians 16 Transportation, Distr 16.2 Services 5 1.20% 4 13 4 53.2021 Air Traffic Controllers 16 Transportation, Distr 16.5 Planning, Management and Regulation 1.20% 4 13 4 45.2093 Farmworkers, Farm, Ranch, and Aquacultural Ani 1 Agriculture, Food & N 1.3 Animal Systems 1.20% 4 9 3 25.1069 Social Sciences Teachers, Postsecondary, All Othe 5 Education & Training 5.3 Teaching/Training 1.20% 4 12 3 27.3091 Interpreters and Translators 5 Education & Training 5.2 Professional Support Services 1.20% 4 12 3 17.2112 Industrial Engineers 15 Science, Technology, 15.1 Engineering and Technology 1,3,5 1.20% 4 11 3 13.1199 Business Operations Specialists, All Other 4 Business Manageme 4.4 Operations Management 1.20% 4 6 2 23.2011 Paralegals and Legal Assistants 12 Law, Public Safety, Co 12.5 Legal Services 5 1.20% 4 7 2 33.1099 First‐Line Supervisors of Protective Service Worke 12 Law, Public Safety, Co 12.3 Security & Protective Services 1.20% 4 7 2 51.2011 Aircraft Structure, Surfaces, Rigging, and Systems 13 Manufacturing 13.1 Production 1.20% 4 8 2 51.3092 Food Batchmakers 13 Manufacturing 13.1 Production 1.20% 4 8 2 43.3011 Bill and Account Collectors 6 Finance 6.5 Banking Services 5 1.20% 4 2 1 53.6051 Transportation Inspectors 7 Government & Public 7.1 Governance 1.20% 4 1 1 41.3099 Sales Representatives, Services, All Other 14 Marketing 14.2 Professional Sales 1.20% 4 3 1 53.5021 Captains, Mates, and Pilots of Water Vessels 16 Transportation, Distr 16.1 Transportation Operations 1.10% 4 13 4 53.7073 Wellhead Pumpers 16 Transportation, Distr 16.1 Transportation Operations 7 1.10% 4 13 4 39.2021 Nonfarm Animal Caretakers 1 Agriculture, Food & N 1.3 Animal Systems 1.10% 4 9 3 45.1011 First‐Line Supervisors of Farming, Fishing, and For 1 Agriculture, Food & N 1.1 Food Products and Processing Systems 2 1.10% 4 9 3 47.5071 Roustabouts, Oil and Gas 2 Architecture & Const 2.2 Construction 7 1.10% 4 10 3 19.1021 Biochemists and Biophysicists 15 Science, Technology, 15.2 Science and Mathematics 1.10% 4 11 3 19.1099 Life Scientists, All Other 15 Science, Technology, 15.2 Science and Mathematics 1.10% 4 11 3 43.4051 Customer Service Representatives 4 Business Manageme 4.5 Administrative Support 3,5,7,8,9,10,11 1.10% 4 6 2 39.3091 Amusement and Recreation Attendants 9 Hospitality & Tourism 9.4 Recreation, Amusements & Attractions 1.10% 4 5 2 23.2091 Court Reporters 12 Law, Public Safety, Co 12.5 Legal Services 1.10% 4 7 2 51.3091 Food and Tobacco Roasting, Baking, and Drying M 13 Manufacturing 13.1 Production 1.10% 4 8 2 41.2021 Counter and Rental Clerks 14 Marketing 14.2 Professional Sales 1.10% 4 3 1 29.1061 Anesthesiologists 8 Health Science 8.1 Therapeutic Services 1.00% 4 15 4 29.1064 Obstetricians and Gynecologists 8 Health Science 8.1 Therapeutic Services 1.00% 4 15 4 29.2032 Diagnostic Medical Sonographers 8 Health Science 8.2 Diagnostic Services 8 1.00% 4 15 4 29.2051 Dietetic Technicians 8 Health Science 8.1 Therapeutic Services 1.00% 4 15 4 19.3039 Psychologists, All Other 10 Human Services 10.2 Counseling & Mental Health Services 1.00% 4 14 4 21.1099 Community and Social Service Specialists, All Othe 10 Human Services 10.3 Family & Community Services 1.00% 4 14 4
3 August 2012
SLIDE 17
Table 5 SOC 2010 Career Cluster_Pathway
SOC CODE SOC TITLE Career Clstr SOC_Career Clusters PTHW Y NO PTHWY TITLE HPO_PA Employment Growth Ave Annual Employment Growth Quartile Student Rank Student Rank Quartile 39.9031 Fitness Trainers and Aerobics Instructors 10 Human Services 10.4 Personal Care Services 1.00% 4 14 4 47.4061 Rail‐Track Laying and Maintenance Equipment Op 16 Transportation, Distr 16.4 Maintenance 1.00% 4 13 4 53.5022 Motorboat Operators 16 Transportation, Distr 16.1 Transportation Operations 1.00% 4 13 4 17.2081 Environmental Engineers 1 Agriculture, Food & N 1.6 Environmental Service Systems 1.00% 4 9 3 45.2021 Animal Breeders 1 Agriculture, Food & N 1.3 Animal Systems 1.00% 4 9 3 45.2091 Agricultural Equipment Operators 1 Agriculture, Food & N 1.4 Power, Structural & Technical Systems 1.00% 4 9 3 25.1126 Philosophy and Religion Teachers, Postsecondary 5 Education & Training 5.3 Teaching/Training 1.00% 4 12 3 17.2011 Aerospace Engineers 15 Science, Technology, 15.1 Engineering and Technology 1.00% 4 11 3 27.2023 Umpires, Referees, and Other Sports Officials 9 Hospitality & Tourism 9.4 Recreation, Amusements & Attractions 1.00% 4 5 2 35.3011 Bartenders 9 Hospitality & Tourism 9.1 Services 1.00% 4 5 2 35.3021 Combined Food Preparation and Serving Workers 9 Hospitality & Tourism 9.1 Services 1.00% 4 5 2 35.9011 Dining Room and Cafeteria Attendants and Barten 9 Hospitality & Tourism 9.1 Services 1.00% 4 5 2 49.2098 Security and Fire Alarm Systems Installers 13 Manufacturing 13.3 Maintenance, Installation & Repair 5 1.00% 4 8 2 49.9094 Locksmiths and Safe Repairers 13 Manufacturing 13.3 Maintenance, Installation & Repair 1.00% 4 8 2 41.9099 Sales and Related Workers, All Other 14 Marketing 14.2 Professional Sales 1.00% 4 3 1 29.1069 Physicians and Surgeons, All Other 8 Health Science 8.1 Therapeutic Services 0.90% 4 15 4 29.2071 Medical Records and Health Information Technici 8 Health Science 8.3 Health Informatics 8 0.90% 4 15 4 49.2091 Avionics Technicians 16 Transportation, Distr 16.4 Maintenance 0.90% 4 13 4 11.9121 Natural Sciences Managers 1 Agriculture, Food & N 1.5 Natural Resources Systems 0.90% 4 9 3 19.1012 Food Scientists and Technologists 1 Agriculture, Food & N 1.1 Food Products and Processing Systems 0.90% 4 9 3 19.4021 Biological Technicians 1 Agriculture, Food & N 1.2 Plant Systems 3 0.90% 4 9 3 45.4011 Forest and Conservation Workers 1 Agriculture, Food & N 1.5 Natural Resources Systems 0.90% 4 9 3 11.9021 Construction Managers 2 Architecture & Const 2.2 Construction 0.90% 4 10 3 25.1194 Vocational Education Teachers, Postsecondary 5 Education & Training 5.3 Teaching/Training 6 0.90% 4 12 3 25.4012 Curators 5 Education & Training 5.2 Professional Support Services 0.90% 4 12 3 35.2014 Cooks, Restaurant 9 Hospitality & Tourism 9.1 Services 0.90% 4 5 2 35.2021 Food Preparation Workers 9 Hospitality & Tourism 9.1 Services 0.90% 4 5 2 35.3041 Food Servers, Nonrestaurant 9 Hospitality & Tourism 9.1 Services 0.90% 4 5 2 43.4081 Hotel, Motel, and Resort Desk Clerks 9 Hospitality & Tourism 9.2 Lodging 0.90% 4 5 2 33.9092 Lifeguards, Ski Patrol, and Other Recreational Pro 12 Law, Public Safety, Co 12.3 Security & Protective Services 0.90% 4 7 2 47.4011 Construction and Building Inspectors 7 Government & Public 7.6 Regulation 9 0.90% 4 1 1 27.3031 Public Relations Specialists 14 Marketing 14.4 Marketing Communications 0.90% 4 3 1 27.1019 Artists and Related Workers, All Other 3 Arts, Audio/Video Te 3.3 Visual Arts 0.80% 4 16 4 27.1023 Floral Designers 3 Arts, Audio/Video Te 3.3 Visual Arts 0.80% 4 16 4 11.9111 Medical and Health Services Managers 8 Health Science 8.4 Support Services 0.80% 4 15 4 29.1199 Health Diagnosing and Treating Practitioners, All O 8 Health Science 8.1 Therapeutic Services 0.80% 4 15 4 29.2012 Medical and Clinical Laboratory Technicians 8 Health Science 8.2 Diagnostic Services 8 0.80% 4 15 4 29.2033 Nuclear Medicine Technologists 8 Health Science 8.2 Diagnostic Services 0.80% 4 15 4 29.2034 Radiologic Technologists 8 Health Science 8.2 Diagnostic Services 8 0.80% 4 15 4 11.9061 Funeral Service Managers 10 Human Services 10.4 Personal Care Services 0.80% 4 14 4 39.4021 Funeral Attendants 10 Human Services 10.4 Personal Care Services 0.80% 4 14 4 51.6011 Laundry and Dry‐Cleaning Workers 10 Human Services 10.4 Personal Care Services 0.80% 4 14 4 49.3011 Aircraft Mechanics and Service Technicians 16 Transportation, Distr 16.4 Maintenance 0.80% 4 13 4
4 August 2012
SLIDE 18
Table 5 SOC 2010 Career Cluster_Pathway
SOC CODE SOC TITLE Career Clstr SOC_Career Clusters PTHW Y NO PTHWY TITLE HPO_PA Employment Growth Ave Annual Employment Growth Quartile Student Rank Student Rank Quartile 49.3042 Mobile Heavy Equipment Mechanics, Except Engi 16 Transportation, Distr 16.4 Maintenance 0.80% 4 13 4 45.2099 Agricultural Workers, All Other 1 Agriculture, Food & N 1.2 Plant Systems 0.80% 4 9 3 17.1022 Surveyors 2 Architecture & Const 2.1 Design/Pre‐Construction 0.80% 4 10 3 37.3011 Landscaping and Groundskeeping Workers 2 Architecture & Const 2.3 Maintenance/Operations 0.80% 4 10 3 11.9033 Education Administrators, Postsecondary 5 Education & Training 5.1 Support 0.80% 4 12 3 25.2011 Preschool Teachers, Except Special Education 5 Education & Training 5.3 Teaching/Training 6 0.80% 4 12 3 25.4013 Museum Technicians and Conservators 5 Education & Training 5.2 Professional Support Services 0.80% 4 12 3 25.9031 Instructional Coordinators 5 Education & Training 5.2 Professional Support Services 0.80% 4 12 3 39.3031 Ushers, Lobby Attendants, and Ticket Takers 9 Hospitality & Tourism 9.4 Recreation, Amusements & Attractions 0.80% 4 5 2 49.9041 Industrial Machinery Mechanics 13 Manufacturing 13.3 Maintenance, Installation & Repair 1,2,7,11 0.80% 4 8 2 13.1032 Insurance Appraisers, Auto Damage 6 Finance 6.4 Insurance 0.80% 4 2 1 13.2052 Personal Financial Advisors 6 Finance 6.1 Securities & Investments 0.80% 4 2 1 13.1011 Agents and Business Managers of Artists, Perform 3 Arts, Audio/Video Te 3.4 Performing Arts 0.70% 3 16 4 27.2011 Actors 3 Arts, Audio/Video Te 3.4 Performing Arts 0.70% 3 16 4 27.4099 Media and Communication Equipment Workers, A 3 Arts, Audio/Video Te 3.5 Journalism and Broadcasting 0.70% 3 16 4 29.1011 Chiropractors 8 Health Science 8.1 Therapeutic Services 0.70% 3 15 4 29.2011 Medical and Clinical Laboratory Technologists 8 Health Science 8.2 Diagnostic Services 8 0.70% 3 15 4 29.2099 Health Technologists and Technicians, All Other 8 Health Science 8.2 Diagnostic Services 0.70% 3 15 4 31.9093 Medical Equipment Preparers 8 Health Science 8.4 Support Services 0.70% 3 15 4 31.9099 Healthcare Support Workers, All Other 8 Health Science 8.4 Support Services 0.70% 3 15 4 43.6013 Medical Secretaries 8 Health Science 8.3 Health Informatics 0.70% 3 15 4 21.1022 Healthcare Social Workers 10 Human Services 10.3 Family & Community Services 8 0.70% 3 14 4 39.4011 Embalmers 10 Human Services 10.4 Personal Care Services 0.70% 3 14 4 53.2011 Airline Pilots, Copilots, and Flight Engineers 16 Transportation, Distr 16.1 Transportation Operations 0.70% 3 13 4 53.2022 Airfield Operations Specialists 16 Transportation, Distr 16.5 Planning, Management and Regulation 0.70% 3 13 4 13.1051 Cost Estimators 2 Architecture & Const 2.1 Design/Pre‐Construction 4 0.70% 3 10 3 17.2051 Civil Engineers 2 Architecture & Const 2.1 Design/Pre‐Construction 9 0.70% 3 10 3 47.2011 Boilermakers 2 Architecture & Const 2.3 Maintenance/Operations 0.70% 3 10 3 47.5013 Service Unit Operators, Oil, Gas, and Mining 2 Architecture & Const 2.2 Construction 7 0.70% 3 10 3 11.9031 Education Administrators, Preschool and Childcar 5 Education & Training 5.1 Support 0.70% 3 12 3 17.1021 Cartographers and Photogrammetrists 15 Science, Technology, 15.2 Science and Mathematics 0.70% 3 11 3 19.2041 Environmental Scientists and Specialists, Including 15 Science, Technology, 15.2 Science and Mathematics 0.70% 3 11 3 19.2042 Geoscientists, Except Hydrologists and Geographe 15 Science, Technology, 15.2 Science and Mathematics 0.70% 3 11 3 27.2021 Athletes and Sports Competitors 9 Hospitality & Tourism 9.4 Recreation, Amusements & Attractions 0.70% 3 5 2 35.3031 Waiters and Waitresses 9 Hospitality & Tourism 9.1 Services 0.70% 3 5 2 35.9031 Hosts and Hostesses, Restaurant, Lounge, and Co 9 Hospitality & Tourism 9.1 Services 0.70% 3 5 2 33.9021 Private Detectives and Investigators 12 Law, Public Safety, Co 12.4 Law Enforcement Services 0.70% 3 7 2 33.9032 Security Guards 12 Law, Public Safety, Co 12.3 Security & Protective Services 0.70% 3 7 2 33.9099 Protective Service Workers, All Other 12 Law, Public Safety, Co 12.3 Security & Protective Services 0.70% 3 7 2 51.3022 Meat, Poultry, and Fish Cutters and Trimmers 13 Manufacturing 13.1 Production 0.70% 3 8 2 43.4061 Eligibility Interviewers, Government Programs 7 Government & Public 7.7 Administration 0.70% 3 1 1 27.1027 Set and Exhibit Designers 3 Arts, Audio/Video Te 3.3 Visual Arts 0.60% 3 16 4 29.2061 Licensed Practical and Licensed Vocational Nurses 8 Health Science 8.1 Therapeutic Services 8 0.60% 3 15 4
5 August 2012
SLIDE 19
Table 5 SOC 2010 Career Cluster_Pathway
SOC CODE SOC TITLE Career Clstr SOC_Career Clusters PTHW Y NO PTHWY TITLE HPO_PA Employment Growth Ave Annual Employment Growth Quartile Student Rank Student Rank Quartile 29.9099 Healthcare Practitioners and Technical Workers, A 8 Health Science 8.1 Therapeutic Services 0.60% 3 15 4 11.9151 Social and Community Service Managers 10 Human Services 10.3 Family & Community Services 0.60% 3 14 4 19.3031 Clinical, Counseling, and School Psychologists 10 Human Services 10.2 Counseling & Mental Health Services 0.60% 3 14 4 21.1015 Rehabilitation Counselors 10 Human Services 10.2 Counseling & Mental Health Services 8 0.60% 3 14 4 21.1019 Counselors, All Other 10 Human Services 10.2 Counseling & Mental Health Services 0.60% 3 14 4 39.9041 Residential Advisors 10 Human Services 10.4 Personal Care Services 0.60% 3 14 4 53.2012 Commercial Pilots 16 Transportation, Distr 16.1 Transportation Operations 0.60% 3 13 4 53.3032 Heavy and Tractor‐Trailer Truck Drivers 16 Transportation, Distr 16.1 Transportation Operations 2,4,7,10,11 0.60% 3 13 4 53.3041 Taxi Drivers and Chauffeurs 16 Transportation, Distr 16.1 Transportation Operations 0.60% 3 13 4 53.5031 Ship Engineers 16 Transportation, Distr 16.1 Transportation Operations 0.60% 3 13 4 17.3025 Environmental Engineering Technicians 1 Agriculture, Food & N 1.6 Environmental Service Systems 0.60% 3 9 3 19.4091 Environmental Science and Protection Technician 1 Agriculture, Food & N 1.6 Environmental Service Systems 0.60% 3 9 3 45.4022 Logging Equipment Operators 1 Agriculture, Food & N 1.5 Natural Resources Systems 0.60% 3 9 3 37.1012 First‐Line Supervisors of Landscaping, Lawn Servic 2 Architecture & Const 2.3 Maintenance/Operations 0.60% 3 10 3 25.4011 Archivists 5 Education & Training 5.2 Professional Support Services 0.60% 3 12 3 17.2171 Petroleum Engineers 15 Science, Technology, 15.1 Engineering and Technology 0.60% 3 11 3 19.1022 Microbiologists 15 Science, Technology, 15.2 Science and Mathematics 0.60% 3 11 3 19.2043 Hydrologists 15 Science, Technology, 15.2 Science and Mathematics 0.60% 3 11 3 19.3041 Sociologists 15 Science, Technology, 15.2 Science and Mathematics 0.60% 3 11 3 19.4099 Life, Physical, and Social Science Technicians, All O 15 Science, Technology, 15.2 Science and Mathematics 0.60% 3 11 3 13.1121 Meeting, Convention, and Event Planners 4 Business Manageme 4.4 Operations Management 0.60% 3 6 2 43.4111 Interviewers, Except Eligibility and Loan 4 Business Manageme 4.5 Administrative Support 8 0.60% 3 6 2 43.4171 Receptionists and Information Clerks 4 Business Manageme 4.5 Administrative Support 0.60% 3 6 2 11.9081 Lodging Managers 9 Hospitality & Tourism 9.2 Lodging 0.60% 3 5 2 35.1012 First‐Line Supervisors of Food Preparation and Se 9 Hospitality & Tourism 9.1 Services 0.60% 3 5 2 35.3022 Counter Attendants, Cafeteria, Food Concession, 9 Hospitality & Tourism 9.1 Services 0.60% 3 5 2 35.9021 Dishwashers 9 Hospitality & Tourism 9.1 Services 0.60% 3 5 2 35.9099 Food Preparation and Serving Related Workers, A 9 Hospitality & Tourism 9.1 Services 0.60% 3 5 2 37.2012 Maids and Housekeeping Cleaners 9 Hospitality & Tourism 9.2 Lodging 0.60% 3 5 2 51.3011 Bakers 9 Hospitality & Tourism 9.1 Services 0.60% 3 5 2 33.9011 Animal Control Workers 12 Law, Public Safety, Co 12.4 Law Enforcement Services 0.60% 3 7 2 15.2011 Actuaries 6 Finance 6.4 Insurance 0.60% 3 2 1 41.9011 Demonstrators and Product Promoters 14 Marketing 14.2 Professional Sales 0.60% 3 3 1 27.4031 Camera Operators, Television, Video, and Motion 3 Arts, Audio/Video Te 3.5 Journalism and Broadcasting 0.50% 3 16 4 29.1066 Psychiatrists 8 Health Science 8.1 Therapeutic Services 0.50% 3 15 4 29.1129 Therapists, All Other 8 Health Science 8.1 Therapeutic Services 0.50% 3 15 4 29.2053 Psychiatric Technicians 8 Health Science 8.1 Therapeutic Services 0.50% 3 15 4 21.1013 Marriage and Family Therapists 10 Human Services 10.2 Counseling & Mental Health Services 0.50% 3 14 4 21.1021 Child, Family, and School Social Workers 10 Human Services 10.3 Family & Community Services 12 0.50% 3 14 4 21.1029 Social Workers, All Other 10 Human Services 10.3 Family & Community Services 0.50% 3 14 4 53.3099 Motor Vehicle Operators, All Other 16 Transportation, Distr 16.1 Transportation Operations 0.50% 3 13 4 19.4041 Geological and Petroleum Technicians 1 Agriculture, Food & N 1.5 Natural Resources Systems 0.50% 3 9 3 51.8031 Water and Wastewater Treatment Plant and Syst 1 Agriculture, Food & N 1.6 Environmental Service Systems 7 0.50% 3 9 3
6 August 2012
SLIDE 20
Table 5 SOC 2010 Career Cluster_Pathway
SOC CODE SOC TITLE Career Clstr SOC_Career Clusters PTHW Y NO PTHWY TITLE HPO_PA Employment Growth Ave Annual Employment Growth Quartile Student Rank Student Rank Quartile 47.2044 Tile and Marble Setters 2 Architecture & Const 2.2 Construction 0.50% 3 10 3 47.2141 Painters, Construction and Maintenance 2 Architecture & Const 2.2 Construction 4 0.50% 3 10 3 47.5012 Rotary Drill Operators, Oil and Gas 2 Architecture & Const 2.2 Construction 7 0.50% 3 10 3 47.5042 Mine Cutting and Channeling Machine Operators 2 Architecture & Const 2.2 Construction 0.50% 3 10 3 25.9099 Education, Training, and Library Workers, All Othe 5 Education & Training 5.3 Teaching/Training 0.50% 3 12 3 17.2061 Computer Hardware Engineers 15 Science, Technology, 15.1 Engineering and Technology 0.50% 3 11 3 19.3093 Historians 15 Science, Technology, 15.2 Science and Mathematics 0.50% 3 11 3 19.4061 Social Science Research Assistants 15 Science, Technology, 15.2 Science and Mathematics 0.50% 3 11 3 39.6012 Concierges 9 Hospitality & Tourism 9.2 Lodging 0.50% 3 5 2 21.1092 Probation Officers and Correctional Treatment Sp 12 Law, Public Safety, Co 12.1 Correction Services 0.50% 3 7 2 23.2099 Legal Support Workers, All Other 12 Law, Public Safety, Co 12.5 Legal Services 0.50% 3 7 2 33.1011 First‐Line Supervisors of Correctional Officers 12 Law, Public Safety, Co 12.1 Correction Services 0.50% 3 7 2 33.3041 Parking Enforcement Workers 12 Law, Public Safety, Co 12.4 Law Enforcement Services 0.50% 3 7 2 49.9091 Coin, Vending, and Amusement Machine Servicer 13 Manufacturing 13.3 Maintenance, Installation & Repair 0.50% 3 8 2 13.2011 Accountants and Auditors 6 Finance 6.3 Accounting 5,9 0.50% 3 2 1 11.2031 Public Relations and Fundraising Managers 14 Marketing 14.1 Marketing Management 0.50% 3 3 1 27.1026 Merchandise Displayers and Window Trimmers 14 Marketing 14.3 Merchandising 0.50% 3 3 1 41.3011 Advertising Sales Agents 14 Marketing 14.2 Professional Sales 0.50% 3 3 1 27.1013 Fine Artists, Including Painters, Sculptors, and Illu 3 Arts, Audio/Video Te 3.3 Visual Arts 0.40% 3 16 4 27.1029 Designers, All Other 3 Arts, Audio/Video Te 3.3 Visual Arts 0.40% 3 16 4 27.2012 Producers and Directors 3 Arts, Audio/Video Te 3.4 Performing Arts 0.40% 3 16 4 27.3042 Technical Writers 3 Arts, Audio/Video Te 3.5 Journalism and Broadcasting 0.40% 3 16 4 27.4014 Sound Engineering Technicians 3 Arts, Audio/Video Te 3.5 Journalism and Broadcasting 0.40% 3 16 4 29.1065 Pediatricians, General 8 Health Science 8.1 Therapeutic Services 0.40% 3 15 4 29.2091 Orthotists and Prosthetists 8 Health Science 8.1 Therapeutic Services 0.40% 3 15 4 31.9094 Medical Transcriptionists 8 Health Science 8.3 Health Informatics 0.40% 3 15 4 39.1021 First‐Line Supervisors of Personal Service Workers 10 Human Services 10.4 Personal Care Services 0.40% 3 14 4 49.3031 Bus and Truck Mechanics and Diesel Engine Speci 16 Transportation, Distr 16.4 Maintenance 10 0.40% 3 13 4 53.3011 Ambulance Drivers and Attendants, Except Emerg 16 Transportation, Distr 16.1 Transportation Operations 0.40% 3 13 4 53.3022 Bus Drivers, School or Special Client 16 Transportation, Distr 16.1 Transportation Operations 0.40% 3 13 4 53.6031 Automotive and Watercraft Service Attendants 16 Transportation, Distr 16.4 Maintenance 0.40% 3 13 4 53.7071 Gas Compressor and Gas Pumping Station Operat 16 Transportation, Distr 16.1 Transportation Operations 0.40% 3 13 4 19.1013 Soil and Plant Scientists 1 Agriculture, Food & N 1.2 Plant Systems 0.40% 3 9 3 37.3012 Pesticide Handlers, Sprayers, and Applicators, Veg 1 Agriculture, Food & N 1.2 Plant Systems 0.40% 3 9 3 17.1012 Landscape Architects 2 Architecture & Const 2.1 Design/Pre‐Construction 0.40% 3 10 3 17.3031 Surveying and Mapping Technicians 2 Architecture & Const 2.1 Design/Pre‐Construction 0.40% 3 10 3 47.4051 Highway Maintenance Workers 2 Architecture & Const 2.3 Maintenance/Operations 0.40% 3 10 3 53.7032 Excavating and Loading Machine and Dragline Op 2 Architecture & Const 2.2 Construction 0.40% 3 10 3 53.7033 Loading Machine Operators, Underground Mining 2 Architecture & Const 2.2 Construction 0.40% 3 10 3 25.2012 Kindergarten Teachers, Except Special Education 5 Education & Training 5.3 Teaching/Training 0.40% 3 12 3 17.2041 Chemical Engineers 15 Science, Technology, 15.1 Engineering and Technology 0.40% 3 11 3 19.3091 Anthropologists and Archeologists 15 Science, Technology, 15.2 Science and Mathematics 0.40% 3 11 3 19.3099 Social Scientists and Related Workers, All Other 15 Science, Technology, 15.2 Science and Mathematics 0.40% 3 11 3
7 August 2012
SLIDE 21
Table 5 SOC 2010 Career Cluster_Pathway
SOC CODE SOC TITLE Career Clstr SOC_Career Clusters PTHW Y NO PTHWY TITLE HPO_PA Employment Growth Ave Annual Employment Growth Quartile Student Rank Student Rank Quartile 11.3021 Computer and Information Systems Managers 4 Business Manageme 4.2 Business Information Management 0.40% 3 6 2 11.9199 Managers, All Other 4 Business Manageme 4.1 General Management 0.40% 3 6 2 43.4021 Correspondence Clerks 4 Business Manageme 4.5 Administrative Support 0.40% 3 6 2 35.1011 Chefs and Head Cooks 9 Hospitality & Tourism 9.1 Services 0.40% 3 5 2 37.1011 First‐Line Supervisors of Housekeeping and Janito 9 Hospitality & Tourism 9.2 Lodging 0.40% 3 5 2 37.2011 Janitors and Cleaners, Except Maids and Houseke 9 Hospitality & Tourism 9.2 Lodging 0.40% 3 5 2 39.6011 Baggage Porters and Bellhops 9 Hospitality & Tourism 9.2 Lodging 0.40% 3 5 2 23.1011 Lawyers 12 Law, Public Safety, Co 12.5 Legal Services 0.40% 3 7 2 29.2041 Emergency Medical Technicians and Paramedics 12 Law, Public Safety, Co 12.2 Services 8 0.40% 3 7 2 43.5031 Police, Fire, and Ambulance Dispatchers 12 Law, Public Safety, Co 12.2 Services 0.40% 3 7 2 49.2094 Electrical and Electronics Repairers, Commercial a 13 Manufacturing 13.3 Maintenance, Installation & Repair 0.40% 3 8 2 51.3023 Slaughterers and Meat Packers 13 Manufacturing 13.1 Production 0.40% 3 8 2 51.8092 Gas Plant Operators 13 Manufacturing 13.1 Production 0.40% 3 8 2 13.2061 Financial Examiners 7 Government & Public 7.1 Governance 0.40% 3 1 1 13.2081 Tax Examiners and Collectors, and Revenue Agent 7 Government & Public 7.5 Revenue and Taxation 0.40% 3 1 1 19.3051 Urban and Regional Planners 7 Government & Public 7.4 Planning 0.40% 3 1 1 41.2031 Retail Salespersons 14 Marketing 14.2 Professional Sales 0.40% 3 3 1 27.2099 Entertainers and Performers, Sports and Related 3 Arts, Audio/Video Te 3.4 Performing Arts 0.30% 3 16 4 29.1041 Optometrists 8 Health Science 8.1 Therapeutic Services 0.30% 3 15 4 29.1062 Family and General Practitioners 8 Health Science 8.1 Therapeutic Services 0.30% 3 15 4 29.1063 Internists, General 8 Health Science 8.1 Therapeutic Services 0.30% 3 15 4 29.1067 Surgeons 8 Health Science 8.1 Therapeutic Services 0.30% 3 15 4 11.3071 Transportation, Storage, and Distribution Manage 16 Transportation, Distr 16.2 Services 0.30% 3 13 4 43.5011 Cargo and Freight Agents 16 Transportation, Distr 16.7 Sales and Service 10 0.30% 3 13 4 49.3022 Automotive Glass Installers and Repairers 16 Transportation, Distr 16.4 Maintenance 0.30% 3 13 4 49.3023 Automotive Service Technicians and Mechanics 16 Transportation, Distr 16.4 Maintenance 12 0.30% 3 13 4 53.1031 First‐Line Supervisors of Transportation and Mate 16 Transportation, Distr 16.1 Transportation Operations 10 0.30% 3 13 4 53.7121 Tank Car, Truck, and Ship Loaders 16 Transportation, Distr 16.1 Transportation Operations 0.30% 3 13 4 19.4011 Agricultural and Food Science Technicians 1 Agriculture, Food & N 1.1 Food Products and Processing Systems 0.30% 3 9 3 37.3013 Tree Trimmers and Pruners 1 Agriculture, Food & N 1.2 Plant Systems 0.30% 3 9 3 17.1011 Architects, Except Landscape and Naval 2 Architecture & Const 2.1 Design/Pre‐Construction 0.30% 3 10 3 47.2061 Construction Laborers 2 Architecture & Const 2.2 Construction 0.30% 3 10 3 47.2073 Operating Engineers and Other Construction Equi 2 Architecture & Const 2.2 Construction 4,7 0.30% 3 10 3 47.2151 Pipelayers 2 Architecture & Const 2.2 Construction 0.30% 3 10 3 47.2152 Plumbers, Pipefitters, and Steamfitters 2 Architecture & Const 2.2 Construction 4 0.30% 3 10 3 47.3015 Helpers‐‐Pipelayers, Plumbers, Pipefitters, and St 2 Architecture & Const 2.2 Construction 0.30% 3 10 3 47.5021 Earth Drillers, Except Oil and Gas 2 Architecture & Const 2.2 Construction 0.30% 3 10 3 47.5041 Continuous Mining Machine Operators 2 Architecture & Const 2.2 Construction 0.30% 3 10 3 47.5081 Helpers‐‐Extraction Workers 2 Architecture & Const 2.2 Construction 0.30% 3 10 3 25.3021 Self‐Enrichment Education Teachers 5 Education & Training 5.3 Teaching/Training 0.30% 3 12 3 15.2041 Statisticians 15 Science, Technology, 15.2 Science and Mathematics 0.30% 3 11 3 17.2111 Health and Safety Engineers, Except Mining Safet 15 Science, Technology, 15.1 Engineering and Technology 0.30% 3 11 3 19.1029 Biological Scientists, All Other 15 Science, Technology, 15.2 Science and Mathematics 0.30% 3 11 3
8 August 2012
SLIDE 22
Table 5 SOC 2010 Career Cluster_Pathway
SOC CODE SOC TITLE Career Clstr SOC_Career Clusters PTHW Y NO PTHWY TITLE HPO_PA Employment Growth Ave Annual Employment Growth Quartile Student Rank Student Rank Quartile 19.2031 Chemists 15 Science, Technology, 15.2 Science and Mathematics 0.30% 3 11 3 19.2099 Physical Scientists, All Other 15 Science, Technology, 15.2 Science and Mathematics 0.30% 3 11 3 43.4161 Human Resources Assistants, Except Payroll and T 4 Business Manageme 4.5 Administrative Support 0.30% 3 6 2 39.9032 Recreation Workers 9 Hospitality & Tourism 9.4 Recreation, Amusements & Attractions 0.30% 3 5 2 33.1021 First‐Line Supervisors of Fire Fighting and Prevent 12 Law, Public Safety, Co 12.2 Services 0.30% 3 7 2 33.2011 Firefighters 12 Law, Public Safety, Co 12.2 Services 0.30% 3 7 2 33.2021 Fire Inspectors and Investigators 12 Law, Public Safety, Co 12.2 Services 0.30% 3 7 2 33.3051 Police and Sheriff's Patrol Officers 12 Law, Public Safety, Co 12.4 Law Enforcement Services 0.30% 3 7 2 43.6012 Legal Secretaries 12 Law, Public Safety, Co 12.5 Legal Services 5 0.30% 3 7 2 19.4031 Chemical Technicians 13 Manufacturing 13.2 Development 0.30% 3 8 2 49.9069 Precision Instrument and Equipment Repairers, A 13 Manufacturing 13.3 Maintenance, Installation & Repair 0.30% 3 8 2 49.9099 Installation, Maintenance, and Repair Workers, A 13 Manufacturing 13.3 Maintenance, Installation & Repair 0.30% 3 8 2 51.9082 Medical Appliance Technicians 13 Manufacturing 13.3 Maintenance, Installation & Repair 0.30% 3 8 2 29.9012 Occupational Health and Safety Technicians 7 Government & Public 7.6 Regulation 0.30% 3 1 1 29.1127 Speech‐Language Pathologists 8 Health Science 8.1 Therapeutic Services 0.20% 3 15 4 49.3051 Motorboat Mechanics and Service Technicians 16 Transportation, Distr 16.4 Maintenance 0.20% 3 13 4 53.1021 First‐Line Supervisors of Helpers, Laborers, and M 16 Transportation, Distr 16.1 Transportation Operations 10 0.20% 3 13 4 53.3021 Bus Drivers, Transit and Intercity 16 Transportation, Distr 16.1 Transportation Operations 0.20% 3 13 4 37.2021 Pest Control Workers 1 Agriculture, Food & N 1.6 Environmental Service Systems 5 0.20% 3 9 3 27.1025 Interior Designers 2 Architecture & Const 2.1 Design/Pre‐Construction 0.20% 3 10 3 37.3019 Grounds Maintenance Workers, All Other 2 Architecture & Const 2.3 Maintenance/Operations 0.20% 3 10 3 47.1011 First‐Line Supervisors of Construction Trades and 2 Architecture & Const 2.2 Construction 4,7 0.20% 3 10 3 47.2071 Paving, Surfacing, and Tamping Equipment Opera 2 Architecture & Const 2.2 Construction 0.20% 3 10 3 47.2181 Roofers 2 Architecture & Const 2.2 Construction 4 0.20% 3 10 3 47.3019 Helpers, Construction Trades, All Other 2 Architecture & Const 2.2 Construction 0.20% 3 10 3 47.4031 Fence Erectors 2 Architecture & Const 2.2 Construction 0.20% 3 10 3 47.5061 Roof Bolters, Mining 2 Architecture & Const 2.2 Construction 0.20% 3 10 3 49.9011 Mechanical Door Repairers 2 Architecture & Const 2.3 Maintenance/Operations 0.20% 3 10 3 49.9021 Heating, Air Conditioning, and Refrigeration Mech 2 Architecture & Const 2.3 Maintenance/Operations 4 0.20% 3 10 3 49.9044 Millwrights 2 Architecture & Const 2.3 Maintenance/Operations 0.20% 3 10 3 11.9039 Education Administrators, All Other 5 Education & Training 5.1 Support 0.20% 3 12 3 25.2021 Elementary School Teachers, Except Special Educa 5 Education & Training 5.3 Teaching/Training 0.20% 3 12 3 25.3099 Teachers and Instructors, All Other 5 Education & Training 5.3 Teaching/Training 0.20% 3 12 3 25.4031 Library Technicians 5 Education & Training 5.2 Professional Support Services 0.20% 3 12 3 11.3011 Administrative Services Managers 4 Business Manageme 4.4 Operations Management 0.20% 3 6 2 43.3031 Bookkeeping, Accounting, and Auditing Clerks 4 Business Manageme 4.5 Administrative Support 5 0.20% 3 6 2 43.6011 Executive Secretaries and Executive Administrativ 4 Business Manageme 4.5 Administrative Support 5 0.20% 3 6 2 43.9061 Office Clerks, General 4 Business Manageme 4.5 Administrative Support 3,7,9 0.20% 3 6 2 11.9051 Food Service Managers 9 Hospitality & Tourism 9.1 Services 0.20% 3 5 2 35.2011 Cooks, Fast Food 9 Hospitality & Tourism 9.1 Services 0.20% 3 5 2 37.2019 Building Cleaning Workers, All Other 9 Hospitality & Tourism 9.2 Lodging 0.20% 3 5 2 23.1023 Judges, Magistrate Judges, and Magistrates 12 Law, Public Safety, Co 12.5 Legal Services 0.20% 3 7 2 33.1012 First‐Line Supervisors of Police and Detectives 12 Law, Public Safety, Co 12.4 Law Enforcement Services 0.20% 3 7 2
9 August 2012
SLIDE 23
Table 5 SOC 2010 Career Cluster_Pathway
SOC CODE SOC TITLE Career Clstr SOC_Career Clusters PTHW Y NO PTHWY TITLE HPO_PA Employment Growth Ave Annual Employment Growth Quartile Student Rank Student Rank Quartile 33.3011 Bailiffs 12 Law, Public Safety, Co 12.3 Security & Protective Services 0.20% 3 7 2 33.3052 Transit and Railroad Police 12 Law, Public Safety, Co 12.4 Law Enforcement Services 0.20% 3 7 2 17.3029 Engineering Technicians, Except Drafters, All Othe 13 Manufacturing 13.2 Development 0.20% 3 8 2 51.8093 Petroleum Pump System Operators, Refinery Ope 13 Manufacturing 13.1 Production 0.20% 3 8 2 13.2031 Budget Analysts 6 Finance 6.2 Business Finance 0.20% 3 2 1 43.3071 Tellers 6 Finance 6.5 Banking Services 0.20% 3 2 1 13.1041 Compliance Officers 7 Government & Public 7.1 Governance 0.20% 3 1 1 43.4031 Court, Municipal, and License Clerks 7 Government & Public 7.7 Administration 0.20% 3 1 1 43.9111 Statistical Assistants 7 Government & Public 7.4 Planning 0.20% 3 1 1 45.2011 Agricultural Inspectors 7 Government & Public 7.6 Regulation 0.20% 3 1 1 11.2021 Marketing Managers 14 Marketing 14.1 Marketing Management 0.20% 3 3 1 41.4011 Sales Representatives, Wholesale and Manufactu 14 Marketing 14.2 Professional Sales 3,9 0.20% 3 3 1 27.1011 Art Directors 3 Arts, Audio/Video Te 3.3 Visual Arts 0.10% 2 16 4 49.2022 Telecommunications Equipment Installers and Re 3 Arts, Audio/Video Te 3.6 Telecommunications 9 0.10% 2 16 4 39.5011 Barbers 10 Human Services 10.4 Personal Care Services 0.10% 2 14 4 53.7061 Cleaners of Vehicles and Equipment 16 Transportation, Distr 16.4 Maintenance 0.10% 2 13 4 53.7081 Refuse and Recyclable Material Collectors 1 Agriculture, Food & N 1.6 Environmental Service Systems 0.10% 2 9 3 47.2031 Carpenters 2 Architecture & Const 2.2 Construction 4 0.10% 2 10 3 47.2051 Cement Masons and Concrete Finishers 2 Architecture & Const 2.2 Construction 4 0.10% 2 10 3 47.3012 Helpers‐‐Carpenters 2 Architecture & Const 2.2 Construction 0.10% 2 10 3 49.9098 Helpers‐‐Installation, Maintenance, and Repair W 2 Architecture & Const 2.3 Maintenance/Operations 0.10% 2 10 3 21.1012 Educational, Guidance, School, and Vocational Co 5 Education & Training 5.2 Professional Support Services 0.10% 2 12 3 25.3011 Adult Basic and Secondary Education and Literacy 5 Education & Training 5.3 Teaching/Training 0.10% 2 12 3 27.2022 Coaches and Scouts 5 Education & Training 5.3 Teaching/Training 6 0.10% 2 12 3 17.2151 Mining and Geological Engineers, Including Minin 15 Science, Technology, 15.1 Engineering and Technology 0.10% 2 11 3 19.2032 Materials Scientists 15 Science, Technology, 15.2 Science and Mathematics 0.10% 2 11 3 13.1111 Management Analysts 4 Business Manageme 4.4 Operations Management 5 0.10% 2 6 2 43.4121 Library Assistants, Clerical 4 Business Manageme 4.5 Administrative Support 0.10% 2 6 2 35.2012 Cooks, Institution and Cafeteria 9 Hospitality & Tourism 9.1 Services 0.10% 2 5 2 35.2015 Cooks, Short Order 9 Hospitality & Tourism 9.1 Services 0.10% 2 5 2 23.1021 Administrative Law Judges, Adjudicators, and Hea 12 Law, Public Safety, Co 12.5 Legal Services 0.10% 2 7 2 23.1022 Arbitrators, Mediators, and Conciliators 12 Law, Public Safety, Co 12.5 Legal Services 0.10% 2 7 2 49.3053 Outdoor Power Equipment and Other Small Engin 13 Manufacturing 13.3 Maintenance, Installation & Repair 0.10% 2 8 2 51.9071 Jewelers and Precious Stone and Metal Workers 13 Manufacturing 13.1 Production 0.10% 2 8 2 13.1031 Claims Adjusters, Examiners, and Investigators 6 Finance 6.4 Insurance 5 0.10% 2 2 1 41.3021 Insurance Sales Agents 6 Finance 6.4 Insurance 5 0.10% 2 2 1 41.1011 First‐Line Supervisors of Retail Sales Workers 14 Marketing 14.2 Professional Sales 12 0.10% 2 3 1 41.4012 Sales Representatives, Wholesale and Manufactu 14 Marketing 14.2 Professional Sales 1,2,4,11 0.10% 2 3 1 27.2031 Dancers 3 Arts, Audio/Video Te 3.4 Performing Arts 0.00% 2 16 4 27.3012 Public Address System and Other Announcers 3 Arts, Audio/Video Te 3.4 Performing Arts 0.00% 2 16 4 27.3099 Media and Communication Workers, All Other 3 Arts, Audio/Video Te 3.5 Journalism and Broadcasting 0.00% 2 16 4 29.1022 Oral and Maxillofacial Surgeons 8 Health Science 8.1 Therapeutic Services 0.00% 2 15 4 29.1029 Dentists, All Other Specialists 8 Health Science 8.1 Therapeutic Services 0.00% 2 15 4
10 August 2012
SLIDE 24
Table 5 SOC 2010 Career Cluster_Pathway
SOC CODE SOC TITLE Career Clstr SOC_Career Clusters PTHW Y NO PTHWY TITLE HPO_PA Employment Growth Ave Annual Employment Growth Quartile Student Rank Student Rank Quartile 29.1031 Dietitians and Nutritionists 8 Health Science 8.1 Therapeutic Services 8 0.00% 2 15 4 29.1081 Podiatrists 8 Health Science 8.1 Therapeutic Services 0.00% 2 15 4 31.1013 Psychiatric Aides 8 Health Science 8.1 Therapeutic Services 0.00% 2 15 4 31.9096 Veterinary Assistants and Laboratory Animal Care 8 Health Science 8.4 Support Services 0.00% 2 15 4 49.2093 Electrical and Electronics Installers and Repairers, 16 Transportation, Distr 16.4 Maintenance 0.00% 2 13 4 49.2096 Electronic Equipment Installers and Repairers, Mo 16 Transportation, Distr 16.4 Maintenance 0.00% 2 13 4 49.3091 Bicycle Repairers 16 Transportation, Distr 16.4 Maintenance 0.00% 2 13 4 49.9097 Signal and Track Switch Repairers 16 Transportation, Distr 16.4 Maintenance 0.00% 2 13 4 53.5011 Sailors and Marine Oilers 16 Transportation, Distr 16.1 Transportation Operations 0.00% 2 13 4 53.6021 Parking Lot Attendants 16 Transportation, Distr 16.7 Sales and Service 0.00% 2 13 4 53.6041 Traffic Technicians 16 Transportation, Distr 16.5 Planning, Management and Regulation 0.00% 2 13 4 17.2021 Agricultural Engineers 1 Agriculture, Food & N 1.4 Power, Structural & Technical Systems 0.00% 2 9 3 19.1023 Zoologists and Wildlife Biologists 1 Agriculture, Food & N 1.5 Natural Resources Systems 0.00% 2 9 3 19.4093 Forest and Conservation Technicians 1 Agriculture, Food & N 1.5 Natural Resources Systems 0.00% 2 9 3 45.2041 Graders and Sorters, Agricultural Products 1 Agriculture, Food & N 1.1 Food Products and Processing Systems 0.00% 2 9 3 45.4021 Fallers 1 Agriculture, Food & N 1.5 Natural Resources Systems 0.00% 2 9 3 47.2053 Terrazzo Workers and Finishers 2 Architecture & Const 2.2 Construction 0.00% 2 10 3 47.2081 Drywall and Ceiling Tile Installers 2 Architecture & Const 2.2 Construction 0.00% 2 10 3 47.2082 Tapers 2 Architecture & Const 2.2 Construction 0.00% 2 10 3 47.2111 Electricians 2 Architecture & Const 2.2 Construction 4 0.00% 2 10 3 47.2132 Insulation Workers, Mechanical 2 Architecture & Const 2.2 Construction 4 0.00% 2 10 3 47.2161 Plasterers and Stucco Masons 2 Architecture & Const 2.2 Construction 0.00% 2 10 3 47.2171 Reinforcing Iron and Rebar Workers 2 Architecture & Const 2.2 Construction 0.00% 2 10 3 47.5011 Derrick Operators, Oil and Gas 2 Architecture & Const 2.2 Construction 0.00% 2 10 3 47.5031 Explosives Workers, Ordnance Handling Experts, a 2 Architecture & Const 2.2 Construction 0.00% 2 10 3 47.5049 Mining Machine Operators, All Other 2 Architecture & Const 2.2 Construction 0.00% 2 10 3 47.5099 Extraction Workers, All Other 2 Architecture & Const 2.2 Construction 0.00% 2 10 3 49.9051 Electrical Power‐Line Installers and Repairers 2 Architecture & Const 2.3 Maintenance/Operations 7 0.00% 2 10 3 25.2022 Middle School Teachers, Except Special and Caree 5 Education & Training 5.3 Teaching/Training 0.00% 2 12 3 17.2121 Marine Engineers and Naval Architects 15 Science, Technology, 15.1 Engineering and Technology 0.00% 2 11 3 17.2161 Nuclear Engineers 15 Science, Technology, 15.1 Engineering and Technology 0.00% 2 11 3 17.2199 Engineers, All Other 15 Science, Technology, 15.1 Engineering and Technology 0.00% 2 11 3 19.1031 Conservation Scientists 15 Science, Technology, 15.2 Science and Mathematics 0.00% 2 11 3 19.2012 Physicists 15 Science, Technology, 15.2 Science and Mathematics 0.00% 2 11 3 19.2021 Atmospheric and Space Scientists 15 Science, Technology, 15.2 Science and Mathematics 0.00% 2 11 3 19.3011 Economists 15 Science, Technology, 15.2 Science and Mathematics 0.00% 2 11 3 13.1071 Human Resources Specialists 4 Business Manageme 4.3 Human Resources Management 0.00% 2 6 2 43.2099 Communications Equipment Operators, All Other 4 Business Manageme 4.5 Administrative Support 0.00% 2 6 2 41.3041 Travel Agents 9 Hospitality & Tourism 9.3 Travel & Tourism 0.00% 2 5 2 33.3031 Fish and Game Wardens 12 Law, Public Safety, Co 12.4 Law Enforcement Services 0.00% 2 7 2 17.3027 Mechanical Engineering Technicians 13 Manufacturing 13.2 Development 0.00% 2 8 2 49.2021 Radio, Cellular, and Tower Equipment Installers a 13 Manufacturing 13.3 Maintenance, Installation & Repair 0.00% 2 8 2 49.9063 Musical Instrument Repairers and Tuners 13 Manufacturing 13.3 Maintenance, Installation & Repair 0.00% 2 8 2
11 August 2012
SLIDE 25
Table 5 SOC 2010 Career Cluster_Pathway
SOC CODE SOC TITLE Career Clstr SOC_Career Clusters PTHW Y NO PTHWY TITLE HPO_PA Employment Growth Ave Annual Employment Growth Quartile Student Rank Student Rank Quartile 51.3021 Butchers and Meat Cutters 13 Manufacturing 13.1 Production 12 0.00% 2 8 2 51.6041 Shoe and Leather Workers and Repairers 13 Manufacturing 13.1 Production 0.00% 2 8 2 51.8011 Nuclear Power Reactor Operators 13 Manufacturing 13.1 Production 0.00% 2 8 2 29.9011 Occupational Health and Safety Specialists 7 Government & Public 7.6 Regulation 0.00% 2 1 1 29.1021 Dentists, General 8 Health Science 8.1 Therapeutic Services ‐0.10% 2 15 4 29.2081 Opticians, Dispensing 8 Health Science 8.1 Therapeutic Services ‐0.10% 2 15 4 49.3043 Rail Car Repairers 16 Transportation, Distr 16.4 Maintenance ‐0.10% 2 13 4 53.3033 Light Truck or Delivery Services Drivers 16 Transportation, Distr 16.1 Transportation Operations 2,10 ‐0.10% 2 13 4 49.3041 Farm Equipment Mechanics and Service Technicia 1 Agriculture, Food & N 1.4 Power, Structural & Technical Systems ‐0.10% 2 9 3 17.3022 Civil Engineering Technicians 2 Architecture & Const 2.1 Design/Pre‐Construction ‐0.10% 2 10 3 47.4021 Elevator Installers and Repairers 2 Architecture & Const 2.3 Maintenance/Operations ‐0.10% 2 10 3 47.4071 Septic Tank Servicers and Sewer Pipe Cleaners 2 Architecture & Const 2.3 Maintenance/Operations ‐0.10% 2 10 3 51.8021 Stationary Engineers and Boiler Operators 2 Architecture & Const 2.3 Maintenance/Operations ‐0.10% 2 10 3 25.9041 Teacher Assistants 5 Education & Training 5.3 Teaching/Training ‐0.10% 2 12 3 17.2072 Electronics Engineers, Except Computer 15 Science, Technology, 15.1 Engineering and Technology ‐0.10% 2 11 3 19.3022 Survey Researchers 15 Science, Technology, 15.2 Science and Mathematics ‐0.10% 2 11 3 17.3026 Industrial Engineering Technicians 13 Manufacturing 13.2 Development 1 ‐0.10% 2 8 2 49.1011 First‐Line Supervisors of Mechanics, Installers, an 13 Manufacturing 13.3 Maintenance, Installation & Repair 7 ‐0.10% 2 8 2 51.9012 Separating, Filtering, Clarifying, Precipitating, and 13 Manufacturing 13.1 Production ‐0.10% 2 8 2 51.9083 Ophthalmic Laboratory Technicians 13 Manufacturing 13.1 Production ‐0.10% 2 8 2 51.9123 Painting, Coating, and Decorating Workers 13 Manufacturing 13.1 Production ‐0.10% 2 8 2 11.3031 Financial Managers 6 Finance 6.2 Business Finance ‐0.10% 2 2 1 13.2099 Financial Specialists, All Other 6 Finance 6.1 Securities & Investments ‐0.10% 2 2 1 13.2021 Appraisers and Assessors of Real Estate 7 Government & Public 7.5 Revenue and Taxation ‐0.10% 2 1 1 11.2022 Sales Managers 14 Marketing 14.1 Marketing Management 5 ‐0.10% 2 3 1 41.9031 Sales Engineers 14 Marketing 14.2 Professional Sales ‐0.10% 2 3 1 27.1024 Graphic Designers 3 Arts, Audio/Video Te 3.3 Visual Arts ‐0.20% 2 16 4 27.3043 Writers and Authors 3 Arts, Audio/Video Te 3.5 Journalism and Broadcasting ‐0.20% 2 16 4 27.4012 Broadcast Technicians 3 Arts, Audio/Video Te 3.5 Journalism and Broadcasting ‐0.20% 2 16 4 47.2021 Brickmasons and Blockmasons 2 Architecture & Const 2.2 Construction 4 ‐0.20% 2 10 3 47.2022 Stonemasons 2 Architecture & Const 2.2 Construction ‐0.20% 2 10 3 47.2131 Insulation Workers, Floor, Ceiling, and Wall 2 Architecture & Const 2.2 Construction ‐0.20% 2 10 3 47.3011 Helpers‐‐Brickmasons, Blockmasons, Stonemason 2 Architecture & Const 2.2 Construction ‐0.20% 2 10 3 47.3013 Helpers‐‐Electricians 2 Architecture & Const 2.2 Construction ‐0.20% 2 10 3 25.4021 Librarians 5 Education & Training 5.2 Professional Support Services ‐0.20% 2 12 3 17.2071 Electrical Engineers 15 Science, Technology, 15.1 Engineering and Technology ‐0.20% 2 11 3 11.3061 Purchasing Managers 4 Business Manageme 4.4 Operations Management ‐0.20% 2 6 2 15.2031 Operations Research Analysts 4 Business Manageme 4.4 Operations Management ‐0.20% 2 6 2 39.3021 Motion Picture Projectionists 9 Hospitality & Tourism 9.4 Recreation, Amusements & Attractions ‐0.20% 2 5 2 49.2011 Computer, Automated Teller, and Office Machine 13 Manufacturing 13.3 Maintenance, Installation & Repair ‐0.20% 2 8 2 49.9031 Home Appliance Repairers 13 Manufacturing 13.3 Maintenance, Installation & Repair ‐0.20% 2 8 2 51.8099 Plant and System Operators, All Other 13 Manufacturing 13.1 Production ‐0.20% 2 8 2 13.2053 Insurance Underwriters 6 Finance 6.4 Insurance ‐0.20% 2 2 1
12 August 2012
SLIDE 26
Table 5 SOC 2010 Career Cluster_Pathway
SOC CODE SOC TITLE Career Clstr SOC_Career Clusters PTHW Y NO PTHWY TITLE HPO_PA Employment Growth Ave Annual Employment Growth Quartile Student Rank Student Rank Quartile 41.3031 Securities, Commodities, and Financial Services Sa 6 Finance 6.1 Securities & Investments 5 ‐0.20% 2 2 1 11.9141 Property, Real Estate, and Community Association 14 Marketing 14.1 Marketing Management ‐0.20% 2 3 1 27.1021 Commercial and Industrial Designers 3 Arts, Audio/Video Te 3.3 Visual Arts ‐0.30% 2 16 4 43.9081 Proofreaders and Copy Markers 3 Arts, Audio/Video Te 3.2 Printing Technology ‐0.30% 2 16 4 49.9052 Telecommunications Line Installers and Repairers 3 Arts, Audio/Video Te 3.6 Telecommunications 9 ‐0.30% 2 16 4 29.1125 Recreational Therapists 8 Health Science 8.1 Therapeutic Services ‐0.30% 2 15 4 29.2054 Respiratory Therapy Technicians 8 Health Science 8.1 Therapeutic Services ‐0.30% 2 15 4 49.3021 Automotive Body and Related Repairers 16 Transportation, Distr 16.4 Maintenance 12 ‐0.30% 2 13 4 49.3092 Recreational Vehicle Service Technicians 16 Transportation, Distr 16.4 Maintenance ‐0.30% 2 13 4 53.4021 Railroad Brake, Signal, and Switch Operators 16 Transportation, Distr 16.1 Transportation Operations ‐0.30% 2 13 4 47.2121 Glaziers 2 Architecture & Const 2.2 Construction ‐0.30% 2 10 3 47.2221 Structural Iron and Steel Workers 2 Architecture & Const 2.2 Construction ‐0.30% 2 10 3 11.9032 Education Administrators, Elementary and Second 5 Education & Training 5.1 Support ‐0.30% 2 12 3 25.9021 Farm and Home Management Advisors 5 Education & Training 5.3 Teaching/Training ‐0.30% 2 12 3 11.9041 Architectural and Engineering Managers 15 Science, Technology, 15.1 Engineering and Technology ‐0.30% 2 11 3 43.4181 Reservation and Transportation Ticket Agents and 9 Hospitality & Tourism 9.3 Travel & Tourism ‐0.30% 2 5 2 43.5061 Production, Planning, and Expediting Clerks 13 Manufacturing 13.4 Quality Assurance 1 ‐0.30% 2 8 2 29.1023 Orthodontists 8 Health Science 8.1 Therapeutic Services ‐0.40% 2 15 4 21.2011 Clergy 10 Human Services 10.3 Family & Community Services ‐0.40% 2 14 4 21.2099 Religious Workers, All Other 10 Human Services 10.3 Family & Community Services ‐0.40% 2 14 4 53.6099 Transportation Workers, All Other 16 Transportation, Distr 16.1 Transportation Operations ‐0.40% 2 13 4 19.1032 Foresters 1 Agriculture, Food & N 1.5 Natural Resources Systems ‐0.40% 2 9 3 47.4041 Hazardous Materials Removal Workers 1 Agriculture, Food & N 1.6 Environmental Service Systems ‐0.40% 2 9 3 47.2211 Sheet Metal Workers 2 Architecture & Const 2.2 Construction 4 ‐0.40% 2 10 3 17.2131 Materials Engineers 15 Science, Technology, 15.1 Engineering and Technology ‐0.40% 2 11 3 17.3012 Electrical and Electronics Drafters 13 Manufacturing 13.2 Development ‐0.40% 2 8 2 51.4011 Computer‐Controlled Machine Tool Operators, M 13 Manufacturing 13.1 Production 1 ‐0.40% 2 8 2 51.9011 Chemical Equipment Operators and Tenders 13 Manufacturing 13.1 Production ‐0.40% 2 8 2 51.9199 Production Workers, All Other 13 Manufacturing 13.1 Production ‐0.40% 2 8 2 41.2011 Cashiers 14 Marketing 14.2 Professional Sales ‐0.40% 2 3 1 41.9091 Door‐to‐Door Sales Workers, News and Street Ve 14 Marketing 14.2 Professional Sales ‐0.40% 2 3 1 27.2042 Musicians and Singers 3 Arts, Audio/Video Te 3.4 Performing Arts ‐0.50% 2 16 4 21.2021 Directors, Religious Activities and Education 10 Human Services 10.3 Family & Community Services ‐0.50% 2 14 4 51.6052 Tailors, Dressmakers, and Custom Sewers 10 Human Services 10.4 Personal Care Services ‐0.50% 2 14 4 43.5032 Dispatchers, Except Police, Fire, and Ambulance 16 Transportation, Distr 16.2 Services ‐0.50% 2 13 4 53.6011 Bridge and Lock Tenders 16 Transportation, Distr 16.1 Transportation Operations ‐0.50% 2 13 4 13.1021 Buyers and Purchasing Agents, Farm Products 1 Agriculture, Food & N 1.7 Agribusiness Systems ‐0.50% 2 9 3 49.9012 Control and Valve Installers and Repairers, Except 2 Architecture & Const 2.3 Maintenance/Operations ‐0.50% 2 10 3 25.2031 Secondary School Teachers, Except Special and Ca 5 Education & Training 5.3 Teaching/Training ‐0.50% 2 12 3 17.2141 Mechanical Engineers 15 Science, Technology, 15.1 Engineering and Technology 1,3,9 ‐0.50% 2 11 3 43.1011 First‐Line Supervisors of Office and Administrative 4 Business Manageme 4.5 Administrative Support 5,8 ‐0.50% 2 6 2 49.2097 Electronic Home Entertainment Equipment Instal 13 Manufacturing 13.3 Maintenance, Installation & Repair ‐0.50% 2 8 2 51.4122 Welding, Soldering, and Brazing Machine Setters, 13 Manufacturing 13.1 Production ‐0.50% 2 8 2
13 August 2012
SLIDE 27
Table 5 SOC 2010 Career Cluster_Pathway
SOC CODE SOC TITLE Career Clstr SOC_Career Clusters PTHW Y NO PTHWY TITLE HPO_PA Employment Growth Ave Annual Employment Growth Quartile Student Rank Student Rank Quartile 51.9023 Mixing and Blending Machine Setters, Operators, 13 Manufacturing 13.1 Production ‐0.50% 2 8 2 51.9081 Dental Laboratory Technicians 13 Manufacturing 13.1 Production ‐0.50% 2 8 2 51.9122 Painters, Transportation Equipment 13 Manufacturing 13.1 Production ‐0.50% 2 8 2 51.9197 Tire Builders 13 Manufacturing 13.1 Production ‐0.50% 2 8 2 13.2072 Loan Officers 6 Finance 6.5 Banking Services 5 ‐0.50% 2 2 1 41.1012 First‐Line Supervisors of Non‐Retail Sales Workers 14 Marketing 14.2 Professional Sales ‐0.50% 2 3 1 27.1012 Craft Artists 3 Arts, Audio/Video Te 3.3 Visual Arts ‐0.60% 1 16 4 27.1022 Fashion Designers 3 Arts, Audio/Video Te 3.3 Visual Arts ‐0.60% 1 16 4 27.4021 Photographers 3 Arts, Audio/Video Te 3.5 Journalism and Broadcasting ‐0.60% 1 16 4 43.9031 Desktop Publishers 3 Arts, Audio/Video Te 3.2 Printing Technology ‐0.60% 1 16 4 43.3021 Billing and Posting Clerks 16 Transportation, Distr 16.7 Sales and Service 5,8 ‐0.60% 1 13 4 53.7072 Pump Operators, Except Wellhead Pumpers 16 Transportation, Distr 16.1 Transportation Operations ‐0.60% 1 13 4 53.7199 Material Moving Workers, All Other 16 Transportation, Distr 16.1 Transportation Operations ‐0.60% 1 13 4 47.3016 Helpers‐‐Roofers 2 Architecture & Const 2.2 Construction ‐0.60% 1 10 3 53.7021 Crane and Tower Operators 2 Architecture & Const 2.2 Construction ‐0.60% 1 10 3 43.3061 Procurement Clerks 4 Business Manageme 4.5 Administrative Support ‐0.60% 1 6 2 43.5071 Shipping, Receiving, and Traffic Clerks 4 Business Manageme 4.5 Administrative Support 1,2,10 ‐0.60% 1 6 2 13.1023 Purchasing Agents, Except Wholesale, Retail, and 13 Manufacturing 13.2 Development 1 ‐0.60% 1 8 2 49.9043 Maintenance Workers, Machinery 13 Manufacturing 13.3 Maintenance, Installation & Repair 1 ‐0.60% 1 8 2 51.3093 Food Cooking Machine Operators and Tenders 13 Manufacturing 13.1 Production ‐0.60% 1 8 2 51.4041 Machinists 13 Manufacturing 13.1 Production 1 ‐0.60% 1 8 2 51.9032 Cutting and Slicing Machine Setters, Operators, a 13 Manufacturing 13.1 Production ‐0.60% 1 8 2 41.9022 Real Estate Sales Agents 14 Marketing 14.2 Professional Sales 5 ‐0.60% 1 3 1 53.7062 Laborers and Freight, Stock, and Material Movers 16 Transportation, Distr 16.1 Transportation Operations ‐0.70% 1 13 4 49.9095 Manufactured Building and Mobile Home Installe 2 Architecture & Const 2.2 Construction ‐0.70% 1 10 3 43.3051 Payroll and Timekeeping Clerks 4 Business Manageme 4.5 Administrative Support 1 ‐0.70% 1 6 2 35.2019 Cooks, All Other 9 Hospitality & Tourism 9.1 Services ‐0.70% 1 5 2 33.9091 Crossing Guards 12 Law, Public Safety, Co 12.3 Security & Protective Services ‐0.70% 1 7 2 17.3013 Mechanical Drafters 13 Manufacturing 13.2 Development 1 ‐0.70% 1 8 2 19.4051 Nuclear Technicians 13 Manufacturing 13.2 Development ‐0.70% 1 8 2 51.4081 Multiple Machine Tool Setters, Operators, and Te 13 Manufacturing 13.1 Production 1 ‐0.70% 1 8 2 11.1031 Legislators 7 Government & Public 7.1 Governance ‐0.70% 1 1 1 13.1022 Wholesale and Retail Buyers, Except Farm Produc 14 Marketing 14.3 Merchandising 12 ‐0.70% 1 3 1 53.3031 Driver/Sales Workers 14 Marketing 14.2 Professional Sales 2 ‐0.70% 1 3 1 27.2041 Music Directors and Composers 3 Arts, Audio/Video Te 3.4 Performing Arts ‐0.80% 1 16 4 53.7051 Industrial Truck and Tractor Operators 16 Transportation, Distr 16.1 Transportation Operations 10 ‐0.80% 1 13 4 47.2043 Floor Sanders and Finishers 2 Architecture & Const 2.2 Construction ‐0.80% 1 10 3 47.3014 Helpers‐‐Painters, Paperhangers, Plasterers, and S 2 Architecture & Const 2.2 Construction ‐0.80% 1 10 3 11.1021 General and Operations Managers 4 Business Manageme 4.1 General Management 1,5,7 ‐0.80% 1 6 2 17.3019 Drafters, All Other 13 Manufacturing 13.2 Development ‐0.80% 1 8 2 17.3023 Electrical and Electronics Engineering Technicians 13 Manufacturing 13.2 Development ‐0.80% 1 8 2 49.9064 Watch Repairers 13 Manufacturing 13.3 Maintenance, Installation & Repair ‐0.80% 1 8 2 41.9021 Real Estate Brokers 14 Marketing 14.2 Professional Sales ‐0.80% 1 3 1
14 August 2012
SLIDE 28
Table 5 SOC 2010 Career Cluster_Pathway
SOC CODE SOC TITLE Career Clstr SOC_Career Clusters PTHW Y NO PTHWY TITLE HPO_PA Employment Growth Ave Annual Employment Growth Quartile Student Rank Student Rank Quartile 43.5021 Couriers and Messengers 16 Transportation, Distr 16.1 Transportation Operations ‐0.90% 1 13 4 53.7111 Mine Shuttle Car Operators 16 Transportation, Distr 16.1 Transportation Operations ‐0.90% 1 13 4 17.3011 Architectural and Civil Drafters 2 Architecture & Const 2.1 Design/Pre‐Construction 9 ‐0.90% 1 10 3 49.9096 Riggers 2 Architecture & Const 2.2 Construction ‐0.90% 1 10 3 53.7041 Hoist and Winch Operators 2 Architecture & Const 2.2 Construction ‐0.90% 1 10 3 49.9061 Camera and Photographic Equipment Repairers 13 Manufacturing 13.3 Maintenance, Installation & Repair ‐0.90% 1 8 2 51.2091 Fiberglass Laminators and Fabricators 13 Manufacturing 13.1 Production ‐0.90% 1 8 2 51.4051 Metal‐Refining Furnace Operators and Tenders 13 Manufacturing 13.1 Production ‐0.90% 1 8 2 51.4111 Tool and Die Makers 13 Manufacturing 13.1 Production ‐0.90% 1 8 2 51.4121 Welders, Cutters, Solderers, and Brazers 13 Manufacturing 13.1 Production 1,7 ‐0.90% 1 8 2 51.8013 Power Plant Operators 13 Manufacturing 13.1 Production 7 ‐0.90% 1 8 2 51.9195 Molders, Shapers, and Casters, Except Metal and 13 Manufacturing 13.1 Production ‐0.90% 1 8 2 47.2041 Carpet Installers 2 Architecture & Const 2.2 Construction ‐1.00% 1 10 3 47.4099 Construction and Related Workers, All Other 2 Architecture & Const 2.3 Maintenance/Operations ‐1.00% 1 10 3 43.6014 Secretaries and Administrative Assistants, Except 4 Business Manageme 4.5 Administrative Support 6,8 ‐1.00% 1 6 2 23.2093 Title Examiners, Abstractors, and Searchers 12 Law, Public Safety, Co 12.5 Legal Services ‐1.00% 1 7 2 17.3024 Electro‐Mechanical Technicians 13 Manufacturing 13.2 Development ‐1.00% 1 8 2 51.8091 Chemical Plant and System Operators 13 Manufacturing 13.1 Production ‐1.00% 1 8 2 51.9041 Extruding, Forming, Pressing, and Compacting Ma 13 Manufacturing 13.1 Production ‐1.00% 1 8 2 51.9193 Cooling and Freezing Equipment Operators and T 13 Manufacturing 13.1 Production ‐1.00% 1 8 2 51.9198 Helpers‐‐Production Workers 13 Manufacturing 13.1 Production ‐1.00% 1 8 2 43.4011 Brokerage Clerks 6 Finance 6.1 Securities & Investments ‐1.00% 1 2 1 41.2022 Parts Salespersons 14 Marketing 14.2 Professional Sales 12 ‐1.00% 1 3 1 27.3022 Reporters and Correspondents 3 Arts, Audio/Video Te 3.5 Journalism and Broadcasting ‐1.10% 1 16 4 51.6021 Pressers, Textile, Garment, and Related Materials 10 Human Services 10.4 Personal Care Services ‐1.10% 1 14 4 51.1011 First‐Line Supervisors of Production and Operatin 13 Manufacturing 13.1 Production 1 ‐1.10% 1 8 2 51.2023 Electromechanical Equipment Assemblers 13 Manufacturing 13.1 Production ‐1.10% 1 8 2 51.4021 Extruding and Drawing Machine Setters, Operato 13 Manufacturing 13.1 Production 1 ‐1.10% 1 8 2 51.7099 Woodworkers, All Other 13 Manufacturing 13.1 Production ‐1.10% 1 8 2 51.9111 Packaging and Filling Machine Operators and Ten 13 Manufacturing 13.1 Production 2,3 ‐1.10% 1 8 2 51.9194 Etchers and Engravers 13 Manufacturing 13.1 Production ‐1.10% 1 8 2 51.9196 Paper Goods Machine Setters, Operators, and Ten 13 Manufacturing 13.1 Production ‐1.10% 1 8 2 43.9041 Insurance Claims and Policy Processing Clerks 6 Finance 6.4 Insurance 5,8 ‐1.10% 1 2 1 13.2071 Credit Counselors 10 Human Services 10.5 Consumer Services ‐1.20% 1 14 4 49.3052 Motorcycle Mechanics 16 Transportation, Distr 16.4 Maintenance ‐1.20% 1 13 4 53.7011 Conveyor Operators and Tenders 2 Architecture & Const 2.2 Construction ‐1.20% 1 10 3 11.3051 Industrial Production Managers 4 Business Manageme 4.4 Operations Management 1 ‐1.20% 1 6 2 43.5051 Postal Service Clerks 4 Business Manageme 4.5 Administrative Support ‐1.20% 1 6 2 43.5052 Postal Service Mail Carriers 4 Business Manageme 4.5 Administrative Support ‐1.20% 1 6 2 49.2092 Electric Motor, Power Tool, and Related Repairers 13 Manufacturing 13.3 Maintenance, Installation & Repair ‐1.20% 1 8 2 51.4012 Computer Numerically Controlled Machine Tool P 13 Manufacturing 13.1 Production 1 ‐1.20% 1 8 2 51.4023 Rolling Machine Setters, Operators, and Tenders, 13 Manufacturing 13.1 Production ‐1.20% 1 8 2 51.4052 Pourers and Casters, Metal 13 Manufacturing 13.1 Production ‐1.20% 1 8 2
15 August 2012
SLIDE 29
Table 5 SOC 2010 Career Cluster_Pathway
SOC CODE SOC TITLE Career Clstr SOC_Career Clusters PTHW Y NO PTHWY TITLE HPO_PA Employment Growth Ave Annual Employment Growth Quartile Student Rank Student Rank Quartile 51.4061 Model Makers, Metal and Plastic 13 Manufacturing 13.1 Production ‐1.20% 1 8 2 51.4062 Patternmakers, Metal and Plastic 13 Manufacturing 13.1 Production ‐1.20% 1 8 2 27.3041 Editors 3 Arts, Audio/Video Te 3.5 Journalism and Broadcasting ‐1.30% 1 16 4 31.9095 Pharmacy Aides 8 Health Science 8.4 Support Services ‐1.30% 1 15 4 43.5081 Stock Clerks and Order Fillers 4 Business Manageme 4.5 Administrative Support ‐1.30% 1 6 2 51.2092 Team Assemblers 13 Manufacturing 13.1 Production ‐1.30% 1 8 2 51.9061 Inspectors, Testers, Sorters, Samplers, and Weigh 13 Manufacturing 13.4 Quality Assurance 1 ‐1.30% 1 8 2 11.9131 Postmasters and Mail Superintendents 7 Government & Public 7.7 Administration ‐1.30% 1 1 1 51.6051 Sewers, Hand 13 Manufacturing 13.1 Production ‐1.40% 1 8 2 13.2041 Credit Analysts 6 Finance 6.5 Banking Services ‐1.40% 1 2 1 51.2041 Structural Metal Fabricators and Fitters 2 Architecture & Const 2.2 Construction ‐1.50% 1 10 3 25.2032 Career/Technical Education Teachers, Secondary 5 Education & Training 5.3 Teaching/Training 6 ‐1.50% 1 12 3 43.9071 Office Machine Operators, Except Computer 4 Business Manageme 4.5 Administrative Support ‐1.50% 1 6 2 51.2099 Assemblers and Fabricators, All Other 13 Manufacturing 13.1 Production ‐1.50% 1 8 2 53.4013 Rail Yard Engineers, Dinkey Operators, and Hostle 16 Transportation, Distr 16.1 Transportation Operations ‐1.60% 1 13 4 25.2023 Career/Technical Education Teachers, Middle Sch 5 Education & Training 5.3 Teaching/Training ‐1.60% 1 12 3 51.4191 Heat Treating Equipment Setters, Operators, and 13 Manufacturing 13.1 Production 1 ‐1.60% 1 8 2 51.4193 Plating and Coating Machine Setters, Operators, a 13 Manufacturing 13.1 Production ‐1.60% 1 8 2 51.6093 Upholsterers 13 Manufacturing 13.1 Production ‐1.60% 1 8 2 51.7042 Woodworking Machine Setters, Operators, and Te 13 Manufacturing 13.1 Production ‐1.60% 1 8 2 51.9022 Grinding and Polishing Workers, Hand 13 Manufacturing 13.1 Production ‐1.60% 1 8 2 51.9031 Cutters and Trimmers, Hand 13 Manufacturing 13.1 Production ‐1.60% 1 8 2 51.9051 Furnace, Kiln, Oven, Drier, and Kettle Operators a 13 Manufacturing 13.1 Production ‐1.60% 1 8 2 51.9191 Adhesive Bonding Machine Operators and Tende 13 Manufacturing 13.1 Production ‐1.60% 1 8 2 51.9192 Cleaning, Washing, and Metal Pickling Equipment 13 Manufacturing 13.1 Production ‐1.60% 1 8 2 27.3021 Broadcast News Analysts 3 Arts, Audio/Video Te 3.5 Journalism and Broadcasting ‐1.70% 1 16 4 49.9045 Refractory Materials Repairers, Except Brickmaso 2 Architecture & Const 2.3 Maintenance/Operations ‐1.70% 1 10 3 43.9021 Data Entry Keyers 4 Business Manageme 4.5 Administrative Support ‐1.70% 1 6 2 51.2031 Engine and Other Machine Assemblers 13 Manufacturing 13.1 Production ‐1.70% 1 8 2 51.9021 Crushing, Grinding, and Polishing Machine Setters 13 Manufacturing 13.1 Production ‐1.70% 1 8 2 43.2011 Switchboard Operators, Including Answering Serv 4 Business Manageme 4.5 Administrative Support ‐1.80% 1 6 2 43.9051 Mail Clerks and Mail Machine Operators, Except P 4 Business Manageme 4.5 Administrative Support ‐1.80% 1 6 2 43.5111 Weighers, Measurers, Checkers, and Samplers, Re 13 Manufacturing 13.4 Quality Assurance ‐1.80% 1 8 2 49.2095 Electrical and Electronics Repairers, Powerhouse, 13 Manufacturing 13.3 Maintenance, Installation & Repair 7 ‐1.80% 1 8 2 51.7041 Sawing Machine Setters, Operators, and Tenders, 13 Manufacturing 13.1 Production ‐1.80% 1 8 2 51.9141 Semiconductor Processors 13 Manufacturing 13.1 Production ‐1.80% 1 8 2 53.4099 Rail Transportation Workers, All Other 16 Transportation, Distr 16.1 Transportation Operations ‐1.90% 1 13 4 53.7064 Packers and Packagers, Hand 16 Transportation, Distr 16.1 Transportation Operations ‐1.90% 1 13 4 47.2142 Paperhangers 2 Architecture & Const 2.2 Construction ‐1.90% 1 10 3 43.4199 Information and Record Clerks, All Other 4 Business Manageme 4.5 Administrative Support ‐1.90% 1 6 2 43.9022 Word Processors and Typists 4 Business Manageme 4.5 Administrative Support ‐1.90% 1 6 2 43.9199 Office and Administrative Support Workers, All Ot 4 Business Manageme 4.5 Administrative Support ‐1.90% 1 6 2 51.4072 Molding, Coremaking, and Casting Machine Sette 13 Manufacturing 13.1 Production ‐1.90% 1 8 2
16 August 2012
SLIDE 30
Table 5 SOC 2010 Career Cluster_Pathway
SOC CODE SOC TITLE Career Clstr SOC_Career Clusters PTHW Y NO PTHWY TITLE HPO_PA Employment Growth Ave Annual Employment Growth Quartile Student Rank Student Rank Quartile 51.9121 Coating, Painting, and Spraying Machine Setters, 13 Manufacturing 13.1 Production ‐1.90% 1 8 2 53.7063 Machine Feeders and Offbearers 13 Manufacturing 13.1 Production ‐1.90% 1 8 2 25.9011 Audio‐Visual and Multimedia Collections Specialis 5 Education & Training 5.2 Professional Support Services ‐2.00% 1 12 3 43.5041 Meter Readers, Utilities 4 Business Manageme 4.5 Administrative Support ‐2.00% 1 6 2 51.4033 Grinding, Lapping, Polishing, and Buffing Machine 13 Manufacturing 13.1 Production ‐2.00% 1 8 2 51.7021 Furniture Finishers 13 Manufacturing 13.1 Production ‐2.00% 1 8 2 51.8012 Power Distributors and Dispatchers 13 Manufacturing 13.1 Production ‐2.00% 1 8 2 47.2042 Floor Layers, Except Carpet, Wood, and Hard Tiles 2 Architecture & Const 2.2 Construction ‐2.10% 1 10 3 43.5053 Postal Service Mail Sorters, Processors, and Proce 4 Business Manageme 4.5 Administrative Support ‐2.10% 1 6 2 51.2093 Timing Device Assemblers and Adjusters 13 Manufacturing 13.1 Production ‐2.10% 1 8 2 51.7011 Cabinetmakers and Bench Carpenters 13 Manufacturing 13.1 Production ‐2.20% 1 8 2 43.4041 Credit Authorizers, Checkers, and Clerks 6 Finance 6.5 Banking Services ‐2.20% 1 2 1 43.4131 Loan Interviewers and Clerks 6 Finance 6.5 Banking Services 5 ‐2.20% 1 2 1 41.9041 Telemarketers 14 Marketing 14.2 Professional Sales ‐2.20% 1 3 1 51.4031 Cutting, Punching, and Press Machine Setters, Op 13 Manufacturing 13.1 Production ‐2.30% 1 8 2 51.4035 Milling and Planing Machine Setters, Operators, a 13 Manufacturing 13.1 Production ‐2.30% 1 8 2 51.4194 Tool Grinders, Filers, and Sharpeners 13 Manufacturing 13.1 Production ‐2.40% 1 8 2 51.6091 Extruding and Forming Machine Setters, Operato 13 Manufacturing 13.1 Production ‐2.40% 1 8 2 13.2082 Tax Preparers 6 Finance 6.2 Business Finance ‐2.40% 1 2 1 27.2032 Choreographers 3 Arts, Audio/Video Te 3.4 Performing Arts ‐2.50% 1 16 4 27.3011 Radio and Television Announcers 3 Arts, Audio/Video Te 3.5 Journalism and Broadcasting ‐2.50% 1 16 4 51.4032 Drilling and Boring Machine Tool Setters, Operato 13 Manufacturing 13.1 Production ‐2.60% 1 8 2 51.4034 Lathe and Turning Machine Tool Setters, Operato 13 Manufacturing 13.1 Production ‐2.60% 1 8 2 45.4023 Log Graders and Scalers 1 Agriculture, Food & N 1.5 Natural Resources Systems ‐2.80% 1 9 3 51.4071 Foundry Mold and Coremakers 13 Manufacturing 13.1 Production ‐2.90% 1 8 2 43.4141 New Accounts Clerks 4 Business Manageme 4.5 Administrative Support ‐3.00% 1 6 2 43.4151 Order Clerks 4 Business Manageme 4.5 Administrative Support ‐3.10% 1 6 2 51.2021 Coil Winders, Tapers, and Finishers 13 Manufacturing 13.1 Production ‐3.20% 1 8 2 51.6062 Textile Cutting Machine Setters, Operators, and T 13 Manufacturing 13.1 Production ‐3.20% 1 8 2 27.4013 Radio Operators 3 Arts, Audio/Video Te 3.5 Journalism and Broadcasting ‐3.30% 1 16 4 51.6042 Shoe Machine Operators and Tenders 13 Manufacturing 13.1 Production ‐3.30% 1 8 2 51.4192 Layout Workers, Metal and Plastic 13 Manufacturing 13.1 Production ‐3.40% 1 8 2 51.2022 Electrical and Electronic Equipment Assemblers 13 Manufacturing 13.1 Production ‐3.50% 1 8 2 51.4022 Forging Machine Setters, Operators, and Tenders 13 Manufacturing 13.1 Production ‐3.60% 1 8 2 51.4199 Metal Workers and Plastic Workers, All Other 13 Manufacturing 13.1 Production ‐3.70% 1 8 2 43.9011 Computer Operators 4 Business Manageme 4.5 Administrative Support ‐3.80% 1 6 2 51.6031 Sewing Machine Operators 13 Manufacturing 13.1 Production ‐4.10% 1 8 2 51.6099 Textile, Apparel, and Furnishings Workers, All Oth 13 Manufacturing 13.1 Production ‐4.10% 1 8 2 43.2021 Telephone Operators 4 Business Manageme 4.5 Administrative Support ‐4.40% 1 6 2 51.6061 Textile Bleaching and Dyeing Machine Operators 13 Manufacturing 13.1 Production ‐4.60% 1 8 2 51.6092 Fabric and Apparel Patternmakers 13 Manufacturing 13.1 Production ‐5.30% 1 8 2 51.6064 Textile Winding, Twisting, and Drawing Out Mach 13 Manufacturing 13.1 Production ‐5.70% 1 8 2 51.7032 Patternmakers, Wood 13 Manufacturing 13.1 Production ‐5.80% 1 8 2
17 August 2012
SLIDE 31
Table 5 SOC 2010 Career Cluster_Pathway
SOC CODE SOC TITLE Career Clstr SOC_Career Clusters PTHW Y NO PTHWY TITLE HPO_PA Employment Growth Ave Annual Employment Growth Quartile Student Rank Student Rank Quartile 43.4071 File Clerks 4 Business Manageme 4.5 Administrative Support ‐6.10% 1 6 2 51.6063 Textile Knitting and Weaving Machine Setters, Op 13 Manufacturing 13.1 Production ‐6.80% 1 8 2 51.5111 Prepress Technicians and Workers 3 Arts, Audio/Video Te 3.2 Printing Technology ‐ 16 4 51.5112 Printing Press Operators 3 Arts, Audio/Video Te 3.2 Printing Technology ‐ 16 4 51.5113 Print Binding and Finishing Workers 3 Arts, Audio/Video Te 3.2 Printing Technology ‐ 16 4 39.5091 Makeup Artists, Theatrical and Performance 3 Arts, Audio/Video Te 3.4 Performing Arts ‐ 16 4 29.1024 Prosthodontists 8 Health Science 8.1 Therapeutic Services ‐ 15 4 29.1128 Exercise Physiologists 8 Health Science 8.1 Therapeutic Services ‐ 15 4 29.1141 Registered Nurses 8 Health Science 8.1 Therapeutic Services 8 ‐ 15 4 29.1151 Nurse Anesthetists 8 Health Science 8.1 Therapeutic Services ‐ 15 4 29.1161 Nurse Midwives 8 Health Science 8.1 Therapeutic Services ‐ 15 4 29.1171 Nurse Practitioners 8 Health Science 8.1 Therapeutic Services ‐ 15 4 29.1181 Audiologists 8 Health Science 8.1 Therapeutic Services ‐ 15 4 29.2035 Magnetic Resonance Imaging Technologists 8 Health Science 8.2 Diagnostic Services ‐ 15 4 29.2057 Ophthalmic Medical Technicians 8 Health Science 8.1 Therapeutic Services ‐ 15 4 29.2092 Hearing Aid Specialists 8 Health Science 8.1 Therapeutic Services ‐ 15 4 29.9092 Genetic Counselors 8 Health Science 8.1 Therapeutic Services ‐ 15 4 31.1014 Nursing Assistants 8 Health Science 8.1 Therapeutic Services ‐ 15 4 31.1015 Orderlies 8 Health Science 8.4 Support Services ‐ 15 4 31.9097 Phlebotomists 8 Health Science 8.4 Support Services ‐ 15 4 21.1094 Community Health Workers 10 Human Services 10.3 Family & Community Services ‐ 14 4 39.4031 Morticians, Undertakers, and Funeral Directors 10 Human Services 10.4 Personal Care Services ‐ 14 4 19.3032 Industrial‐Organizational Psychologists 10 Human Services 10.2 Counseling & Mental Health Services ‐ 14 4 53.2031 Flight Attendants 16 Transportation, Distr 16.1 Transportation Operations ‐ 13 4 53.6061 Transportation Attendants, Except Flight Attenda 16 Transportation, Distr 16.1 Transportation Operations ‐ 13 4 53.4012 Locomotive Firers 16 Transportation, Distr 16.1 Transportation Operations ‐ 13 4 53.4041 Subway and Streetcar Operators 16 Transportation, Distr 16.1 Transportation Operations ‐ 13 4 11.9013 Farmers, Ranchers, and Other Agricultural Manag 1 Agriculture, Food & N 1.7 Agribusiness Systems 2 ‐ 9 3 13.1074 Farm Labor Contractors 1 Agriculture, Food & N 1.7 Agribusiness Systems ‐ 9 3 45.3011 Fishers and Related Fishing Workers 1 Agriculture, Food & N 1.5 Natural Resources Systems ‐ 9 3 45.3021 Hunters and Trappers 1 Agriculture, Food & N 1.5 Natural Resources Systems ‐ 9 3 19.1011 Animal Scientists 1 Agriculture, Food & N 1.3 Animal Systems ‐ 9 3 45.4029 Logging Workers, All Other 1 Agriculture, Food & N 1.5 Natural Resources Systems ‐ 9 3 47.2231 Solar Photovoltaic Installers 2 Architecture & Const 2.2 Construction ‐ 10 3 49.9092 Commercial Divers 2 Architecture & Const 2.3 Maintenance/Operations ‐ 10 3 47.2072 Pile‐Driver Operators 2 Architecture & Const 2.2 Construction ‐ 10 3 47.4091 Segmental Pavers 2 Architecture & Const 2.2 Construction ‐ 10 3 53.7031 Dredge Operators 2 Architecture & Const 2.2 Construction ‐ 10 3 25.2051 Special Education Teachers, Preschool 5 Education & Training 5.3 Teaching/Training ‐ 12 3 25.2052 Special Education Teachers, Kindergarten and Ele 5 Education & Training 5.3 Teaching/Training ‐ 12 3 25.2053 Special Education Teachers, Middle School 5 Education & Training 5.3 Teaching/Training 6 ‐ 12 3 25.2054 Special Education Teachers, Secondary School 5 Education & Training 5.3 Teaching/Training 6 ‐ 12 3 25.2059 Special Education Teachers, All Other 5 Education & Training 5.3 Teaching/Training ‐ 12 3
18 August 2012
SLIDE 32
Table 5 SOC 2010 Career Cluster_Pathway
SOC CODE SOC TITLE Career Clstr SOC_Career Clusters PTHW Y NO PTHWY TITLE HPO_PA Employment Growth Ave Annual Employment Growth Quartile Student Rank Student Rank Quartile 15.1111 Computer and Information Research Scientists 15 Science, Technology, 15.2 Science and Mathematics ‐ 11 3 19.2011 Astronomers 15 Science, Technology, 15.2 Science and Mathematics ‐ 11 3 15.2021 Mathematicians 15 Science, Technology, 15.2 Science and Mathematics ‐ 11 3 15.2091 Mathematical Technicians 15 Science, Technology, 15.2 Science and Mathematics ‐ 11 3 15.2099 Mathematical Science Occupations, All Other 15 Science, Technology, 15.2 Science and Mathematics ‐ 11 3 19.3094 Political Scientists 15 Science, Technology, 15.2 Science and Mathematics ‐ 11 3 11.3111 Compensation and Benefits Managers 4 Business Manageme 4.3 Human Resources Management ‐ 6 2 11.3121 Human Resources Managers 4 Business Manageme 4.3 Human Resources Management ‐ 6 2 11.3131 Training and Development Managers 4 Business Manageme 4.3 Human Resources Management ‐ 6 2 11.1011 Chief Executives 4 Business Manageme 4.1 General Management ‐ 6 2 13.1075 Labor Relations Specialists 4 Business Manageme 4.3 Human Resources Management ‐ 6 2 13.1131 Fundraisers 4 Business Manageme 4.4 Operations Management ‐ 6 2 13.1141 Compensation, Benefits, and Job Analysis Speciali 4 Business Manageme 4.3 Human Resources Management ‐ 6 2 13.1151 Training and Development Specialists 4 Business Manageme 4.3 Human Resources Management 5 ‐ 6 2 39.3011 Gaming Dealers 9 Hospitality & Tourism 9.4 Recreation, Amusements & Attractions ‐ 5 2 39.7011 Tour Guides and Escorts 9 Hospitality & Tourism 9.3 Travel & Tourism ‐ 5 2 39.7012 Travel Guides 9 Hospitality & Tourism 9.3 Travel & Tourism ‐ 5 2 11.9071 Gaming Managers 9 Hospitality & Tourism 9.4 Recreation, Amusements & Attractions ‐ 5 2 39.3019 Gaming Service Workers, All Other 9 Hospitality & Tourism 9.4 Recreation, Amusements & Attractions ‐ 5 2 23.1012 Judicial Law Clerks 12 Law, Public Safety, Co 12.5 Legal Services ‐ 7 2 33.2022 Forest Fire Inspectors and Prevention Specialists 12 Law, Public Safety, Co 12.2 Services ‐ 7 2 49.9071 Maintenance and Repair Workers, General 13 Manufacturing 13.3 Maintenance, Installation & Repair 1,2,5,7,10 ‐ 8 2 49.9081 Wind Turbine Service Technicians 13 Manufacturing 13.3 Maintenance, Installation & Repair ‐ 8 2 51.3099 Food Processing Workers, All Other 13 Manufacturing 13.1 Production ‐ 8 2 51.9151 Photographic Process Workers and Processing Ma 13 Manufacturing 13.1 Production ‐ 8 2 17.3021 Aerospace Engineering and Operations Technician 13 Manufacturing 13.2 Development ‐ 8 2 49.9093 Fabric Menders, Except Garment 13 Manufacturing 13.3 Maintenance, Installation & Repair ‐ 8 2 51.7031 Model Makers, Wood 13 Manufacturing 13.1 Production ‐ 8 2 43.3099 Financial Clerks, All Other 6 Finance 6.5 Banking Services ‐ 2 1 11.9161 Emergency Management Directors 7 Government & Public 7.7 Administration ‐ 1 1 33.9093 Transportation Security Screeners 7 Government & Public 7.2 National Security ‐ 1 1 55.1011 Air Crew Officers 7 Government & Public 7.2 National Security ‐ 1 1 55.1012 Aircraft Launch and Recovery Officers 7 Government & Public 7.2 National Security ‐ 1 1 55.1013 Armored Assault Vehicle Officers 7 Government & Public 7.2 National Security ‐ 1 1 55.1014 Artillery and Missile Officers 7 Government & Public 7.2 National Security ‐ 1 1 55.1015 Command and Control Center Officers 7 Government & Public 7.2 National Security ‐ 1 1 55.1016 Infantry Officers 7 Government & Public 7.2 National Security ‐ 1 1 55.1017 Special Forces Officers 7 Government & Public 7.2 National Security ‐ 1 1 55.1019 Military Officer Special and Tactical Operations Le 7 Government & Public 7.2 National Security ‐ 1 1 55.2011 First‐Line Supervisors of Air Crew Members 7 Government & Public 7.2 National Security ‐ 1 1 55.2012 First‐Line Supervisors of Weapons Specialists/Cre 7 Government & Public 7.2 National Security ‐ 1 1 55.2013 First‐Line Supervisors of All Other Tactical Operat 7 Government & Public 7.2 National Security ‐ 1 1 55.3011 Air Crew Members 7 Government & Public 7.2 National Security ‐ 1 1
19 August 2012
SLIDE 33
Table 5 SOC 2010 Career Cluster_Pathway
SOC CODE SOC TITLE Career Clstr SOC_Career Clusters PTHW Y NO PTHWY TITLE HPO_PA Employment Growth Ave Annual Employment Growth Quartile Student Rank Student Rank Quartile 55.3012 Aircraft Launch and Recovery Specialists 7 Government & Public 7.2 National Security ‐ 1 1 55.3013 Armored Assault Vehicle Crew Members 7 Government & Public 7.2 National Security ‐ 1 1 55.3014 Artillery and Missile Crew Members 7 Government & Public 7.2 National Security ‐ 1 1 55.3015 Command and Control Center Specialists 7 Government & Public 7.2 National Security ‐ 1 1 55.3016 Infantry 7 Government & Public 7.2 National Security ‐ 1 1 55.3017 Radar and Sonar Technicians 7 Government & Public 7.2 National Security ‐ 1 1 55.3018 Special Forces 7 Government & Public 7.2 National Security ‐ 1 1 55.3019 Military Enlisted Tactical Operations and Air/Wea 7 Government & Public 7.2 National Security ‐ 1 1 15.1121 Computer Systems Analysts 11 Information Technolo 11.4 Development 5,9 ‐ 4 1 15.1122 Information Security Analysts 11 Information Technolo 11.1 Network Systems ‐ 4 1 15.1131 Computer Programmers 11 Information Technolo 11.4 Development 9 ‐ 4 1 15.1132 Software Developers, Applications 11 Information Technolo 11.4 Development 5,9 ‐ 4 1 15.1133 Software Developers, Systems Software 11 Information Technolo 11.4 Development 9 ‐ 4 1 15.1134 Web Developers 11 Information Technolo 11.3 Web and Digital Communications ‐ 4 1 15.1141 Database Administrators 11 Information Technolo 11.1 Network Systems ‐ 4 1 15.1142 Network and Computer Systems Administrators 11 Information Technolo 11.1 Network Systems 5,9 ‐ 4 1 15.1143 Computer Network Architects 11 Information Technolo 11.1 Network Systems ‐ 4 1 15.1151 Computer User Support Specialists 11 Information Technolo 11.2 Information Support and Services 5,9 ‐ 4 1 15.1152 Computer Network Support Specialists 11 Information Technolo 11.1 Network Systems 5,9 ‐ 4 1 15.1199 Computer Occupations, All Other 11 Information Technolo 11.2 Information Support and Services ‐ 4 1 11.2011 Advertising and Promotions Managers 14 Marketing 14.1 Marketing Management ‐ 3 1 13.1161 Market Research Analysts and Marketing Speciali 14 Marketing 14.5 Marketing Research 5 ‐ 3 1 41.9012 Models 14 Marketing 14.3 Merchandising ‐ 3 1
20 August 2012
SLIDE 34
Occupation Code (SOC) 53.7031 Dredge Oprs *** *** *** *** *** 53.4041 Subway & Streetcar Oprs *** *** *** *** *** 53.4012 Locomotive Firers *** *** *** *** *** 51.7031 Model Makers, Wood *** *** *** *** *** 49.9093 Fabric Menders *** *** *** *** *** 47.4091 Segmental Pavers *** *** *** *** *** 47.2072 Pile‐Driver Oprs *** *** *** *** *** 45.4029 Logging Workers, All Other *** *** *** *** *** 45.1012 Farm Labor Contractors *** *** *** *** *** 39.5091 Makeup Artists, Theatrical & Performance *** *** *** *** *** 39.3019 Gaming Service Workers, All Other *** *** *** *** *** 33.2022 Forest Fire Inspectors & Prevention Specialists *** *** *** *** *** 19.3094 Political Scientists *** *** *** *** *** 19.3032 Industrial‐Organizational Psychologists *** *** *** *** *** 19.1011 Animal Scientists *** *** *** *** *** 17.3021 Aerospace Engineering & Operations Technicians *** *** *** *** *** 15.2099 Mathematical Scientists, Other *** *** *** *** *** 15.2091 Mathematical Technicians *** *** *** *** *** 15.2021 Mathematicians *** *** *** *** *** 11.9071 Gaming Managers *** *** *** *** *** 33.9031 Gaming Surveillance Officers & Gaming Investigators 250 1,120 870 16.20% 348.00% 39.1011 Gaming Supervisors 140 570 430 15.10% 307.10% 39.1012 Slot Key Persons 150 530 380 13.50% 253.30% 41.2012 Gaming Change Persons & Booth Cashiers 250 770 520 11.90% 208.00% 39.3012 Gaming & Sports Book Writers & Runners 450 1,020 570 8.50% 126.70% 39.3092 Costume Attendants 90 200 110 8.30% 122.20% 39.3099 Entertainment Attendants & Related Workers, All Other 920 1,700 780 6.30% 84.80% 39.3093 Locker Room, Coatroom, & Dressing Room Attendants 860 1,460 600 5.40% 69.80% 43.3041 Gaming Cage Workers 730 1,160 430 4.70% 58.90% 15.1081 Network Systems & Data Communications Analysts 7,530 10,450 2,920 3.30% 38.80% 39.5094 Skin Care Specialists 2,350 3,220 870 3.20% 37.00% 39.5092 Manicurists & Pedicurists 2,970 3,910 940 2.80% 31.70% 29.2052 Pharmacy Technicians 15,010 19,500 4,490 2.70% 29.90% 39.9012 Child Care Workers, Private Household 3,050 3,870 820 2.40% 26.90% 37.2102 Housekeepers & Butlers, Private Household 1,040 1,320 280 2.40% 26.90% 37.2101 Cleaners & Servants, Private Household 3,850 4,880 1,030 2.40% 26.80% 15.1031 Computer Software Engineers, Applications 13,500 16,820 3,320 2.20% 24.60% 39.9099 Personal Care & Service Workers, Other 4,170 5,160 990 2.20% 23.70% 35.2013 Cooks, Private Household 970 1,200 230 2.20% 23.70% 31.9092 Medical Assistants 23,390 28,770 5,380 2.10% 23.00% 47.5051 Rock Splitters, Quarry 660 810 150 2.10% 22.70% 31.1011 Home Health Aides 54,110 66,380 12,270 2.10% 22.70% 39.9021 Personal & Home Care Aides 37,190 45,570 8,380 2.10% 22.50% 29.2056 Veterinary Technologists & Technicians 3,110 3,790 680 2.00% 21.90% 39.3 Entertainment Attendants & Related Workers 18,820 22,710 3,890 1.90% 20.70% Occupational Title 2008 Estimated Employment 2018 Projected Employment Total 2008‐2018 Employment Change Annual Avg. Percent Change Total Percent Change
SLIDE 35
Occupation Code (SOC) Occupational Title 2008 Estimated Employment 2018 Projected Employment Total 2008‐2018 Employment Change Annual Avg. Percent Change Total Percent Change 31.2021 Physical Therapist Assistants 3,990 4,790 800 1.80% 20.10% 53.4031 Railroad Conductors & Yardmasters 1,880 2,240 360 1.80% 19.20% 29.1124 Radiation Therapists 910 1,080 170 1.70% 18.70% 29.2031 Cardiovascular Technologists & Technicians 3,030 3,590 560 1.70% 18.50% 29.1051 Pharmacists 11,690 13,850 2,160 1.70% 18.50% 29.1071 Physician Assistants 3,750 4,440 690 1.70% 18.40% 21.1011 Substance Abuse & Behavioral Disorder Counselors 6,500 7,680 1,180 1.70% 18.20% 19.4092 Forensic Science Technicians 550 650 100 1.70% 18.20% 21.1093 Social & Human Service Assistants 20,610 24,330 3,720 1.70% 18.10% 11.9011. Farm, Ranch, & Other Agricultural Managers 14,350 16,930 2,580 1.70% 18.00% 39.1 Supervisors, Personal Care & Service Workers 5,830 6,870 1,040 1.70% 17.80% 31.2011 Occupational Therapist Assistants 1,970 2,320 350 1.60% 17.80% 31.2 Occupational & Physical Therapist Assistants & Aides 8,490 10,000 1,510 1.70% 17.80% 29.1131 Veterinarians 2,700 3,180 480 1.70% 17.80% 29.2055 Surgical Technologists 3,760 4,420 660 1.60% 17.60% 53.1011 Aircraft Cargo Handling Supervisors 230 270 40 1.60% 17.40% 25.1191 Graduate Teaching Assistants 1,270 1,490 220 1.60% 17.30% 25.1031 Architecture Teachers, Postsecondary 290 340 50 1.60% 17.20% 25.1063 Economics Teachers, Postsecondary 820 960 140 1.60% 17.10% 25.1061 Anthropology & Archeology Teachers, Postsecondary 410 480 70 1.60% 17.10% 25.1053 Environmental Science Teachers, Postsecondary 410 480 70 1.60% 17.10% 25.1113 Social Work Teachers, Postsecondary 590 690 100 1.60% 17.00% 25.1052 Chemistry Teachers, Postsecondary 1,180 1,380 200 1.60% 17.00% 29.1126 Respiratory Therapists 4,680 5,460 780 1.60% 16.70% 25.1111 Criminal Justice & Law Enforcement Teachers, Postsec. 540 630 90 1.60% 16.70% 25.1064 Geography Teachers, Postsecondary 360 420 60 1.60% 16.70% 29.1123 Physical Therapists 9,620 11,220 1,600 1.60% 16.60% 29.2021 Dental Hygienists 7,330 8,540 1,210 1.50% 16.50% 31.9091 Dental Assistants 11,290 13,120 1,830 1.50% 16.20% 29.1111 Registered Nurses 135,410 157,300 21,890 1.50% 16.20% 25.1193 Recreation & Fitness Teachers, Postsecondary 1,050 1,220 170 1.50% 16.20% 25.1081 Education Teachers, Postsecondary 3,590 4,170 580 1.50% 16.20% 25.1071 Health Specialties Teachers, Postsecondary 6,610 7,680 1,070 1.50% 16.20% 25.1066 Psychology Teachers, Postsecondary 1,910 2,220 310 1.50% 16.20% 25.1051 Atmosph., Earth, Marine & Space Sciences Teachers, Postsec. 680 790 110 1.50% 16.20% 25.1032 Engineering Teachers, Postsecondary 2,410 2,800 390 1.50% 16.20% 25.1124 Foreign Language & Literature Teachers, Postsecondary 1,550 1,800 250 1.50% 16.10% 25.1112 Law Teachers, Postsecondary 310 360 50 1.50% 16.10% 21.1023 Mental Health & Substance Abuse Social Workers 8,870 10,300 1,430 1.50% 16.10% 49.3093 Tire Repairers & Changers 2,880 3,340 460 1.50% 16.00% 33.3021 Detectives & Criminal Investigators 3,070 3,560 490 1.50% 16.00% 25.1192 Home Economics Teachers, Postsecondary 500 580 80 1.50% 16.00% 25.1123 English Language & Literature Teachers, Postsecondary 3,820 4,430 610 1.50% 16.00% 25.1042 Biological Science Teachers, Postsecondary 3,630 4,210 580 1.50% 16.00% 25.1022 Mathematical Science Teachers, Postsecondary 2,880 3,340 460 1.50% 16.00%
SLIDE 36
Occupation Code (SOC) Occupational Title 2008 Estimated Employment 2018 Projected Employment Total 2008‐2018 Employment Change Annual Avg. Percent Change Total Percent Change 53.4011 Locomotive Engineers 2,140 2,480 340 1.50% 15.90% 39.2011 Animal Trainers 880 1,020 140 1.50% 15.90% 31.9011 Massage Therapists 2,410 2,790 380 1.50% 15.80% 25.1065 Political Science Teachers, Postsecondary 950 1,100 150 1.50% 15.80% 25.1199 Postsecondary Teachers, Other 3,310 3,830 520 1.50% 15.70% 25.1067 Sociology Teachers, Postsecondary 1,210 1,400 190 1.50% 15.70% 25.1054 Physics Teachers, Postsecondary 830 960 130 1.50% 15.70% 25.1011 Business Teachers, Postsecondary 4,320 5,000 680 1.50% 15.70% 17.2031 Biomedical Engineers 1,210 1,400 190 1.50% 15.70% 25.1125. History Teachers, Postsecondary 1,350 1,560 210 1.50% 15.60% 25.1122 Communications Teachers, Postsecondary 1,540 1,780 240 1.50% 15.60% 25.1062 Area, Ethnic, & Cultural Teachers, Postsecondary 450 520 70 1.50% 15.60% 25.1043 Forestry & Conservation Science Teachers, Postsec. 320 370 50 1.50% 15.60% 49.9062 Medical Equipment Repairers 2,520 2,910 390 1.40% 15.50% 25.1121 Art, Drama, & Music Teachers, Postsecondary 3,990 4,610 620 1.50% 15.50% 25.1041 Agricultural Sciences Teachers, Postsecondary 460 530 70 1.40% 15.20% 25.1 Postsecondary Teachers 67,700 77,990 10,290 1.40% 15.20% 21.1091 Health Educators 2,430 2,800 370 1.40% 15.20% 25.1072 Nursing Instructors & Teachers, Postsecondary 2,910 3,350 440 1.40% 15.10% 15.1032 Computer Software Engineers, Systems Software 9,900 11,390 1,490 1.40% 15.10% 31 Healthcare Support Occupations 201,490 231,300 29,810 1.40% 14.80% 39 Personal Care & Service Occupations 204,630 234,790 30,160 1.40% 14.70% 33.3012 Correctional Officers & Jailers 17,710 20,320 2,610 1.40% 14.70% 31.9 Other Healthcare Support Occupations 55,400 63,560 8,160 1.40% 14.70% 25.1021 Computer Science Teachers, Postsecondary 2,320 2,660 340 1.40% 14.70% 39.9 Other Personal Care & Service Workers 114,750 131,460 16,710 1.40% 14.60% 39.5 Personal Appearance Workers 48,020 55,010 6,990 1.40% 14.60% 31.1 Nursing, Psychiatric, & Home Health Aides 137,610 157,740 20,130 1.40% 14.60% 29.1122 Occupational Therapists 6,240 7,150 910 1.40% 14.60% 31.2022 Physical Therapist Aides 1,930 2,210 280 1.40% 14.50% 21.1014 Mental Health Counselors 14,920 17,090 2,170 1.40% 14.50% 27.4032 Film & Video Editors 350 400 50 1.30% 14.30% 19.3092 Geographers 70 80 10 1.30% 14.30% 29.9091 Athletic Trainers 1,060 1,210 150 1.30% 14.20% 15.1051 Computer Systems Analysts 22,840 26,070 3,230 1.30% 14.10% 39.5093 Shampooers 1,240 1,410 170 1.30% 13.70% 25.1082 Library Science Teachers, Postsecondary 220 250 30 1.30% 13.60% 13.2051 Financial Analysts 10,360 11,770 1,410 1.30% 13.60% 45.2092 Farmworkers & Laborers ‐ Crop, Nursery, & Greenhouse 34,910 39,630 4,720 1.30% 13.50% 29.1 Health Diagnosing & Treating Practitioners 228,230 259,070 30,840 1.30% 13.50% 39.5012 Hairdressers, Hairstylists, & Cosmetologists 37,140 42,110 4,970 1.30% 13.40% 27.1014 Multi‐Media Artists & Animators 1,790 2,030 240 1.30% 13.40% 19.1042 Medical Scientists 8,280 9,390 1,110 1.30% 13.40% 19.1041 Epidemiologists 150 170 20 1.30% 13.30% 23.2011 Paralegals & Legal Assistants 9,200 10,410 1,210 1.20% 13.20%
SLIDE 37
Occupation Code (SOC) Occupational Title 2008 Estimated Employment 2018 Projected Employment Total 2008‐2018 Employment Change Annual Avg. Percent Change Total Percent Change 53.2021 Air Traffic Controllers 610 690 80 1.20% 13.10% 31.2012 Occupational Therapist Aides 610 690 80 1.20% 13.10% 13.1081 Logisticians 5,070 5,730 660 1.20% 13.00% 41.3099 Sales Representatives, Services, All Other 12,440 14,050 1,610 1.20% 12.90% 33.1099 Supervisors ‐ Other Protective Service Workers 1,470 1,660 190 1.20% 12.90% 15.1061 Database Administrators 4,800 5,420 620 1.20% 12.90% 45.2093 Farmworkers ‐ Farm & Ranch Animals 5,710 6,440 730 1.20% 12.80% 27.3091 Interpreters & Translators 780 880 100 1.20% 12.80% 17.2112 Industrial Engineers 9,650 10,880 1,230 1.20% 12.80% 45.2 Agricultural Workers 46,420 52,330 5,910 1.20% 12.70% 39.9011 Child Care Workers 44,140 49,710 5,570 1.20% 12.60% 27.4011 Audio & Video Equipment Technicians 1,590 1,790 200 1.20% 12.60% 15.1071 Network & Computer Systems Administrators 14,970 16,850 1,880 1.20% 12.60% 51.3092 Food Batchmakers 7,040 7,920 880 1.20% 12.50% 25.1069 Social Sciences Teachers, Postsecondary, All Other 80 90 10 1.20% 12.50% 45 Farming, Fishing, & Forestry Occupations 50,090 56,280 6,190 1.20% 12.40% 13.1199 Business Operations Specialists, Other 20,170 22,660 2,490 1.20% 12.40% 51.2011 Aircraft Structure, Surfaces, Rigging, & Systems Assemblers 650 730 80 1.20% 12.30% 39.2 Animal Care & Service Workers 7,910 8,880 970 1.20% 12.30% 53.6051 Transportation Inspectors 820 920 100 1.20% 12.20% 43.3011 Bill & Account Collectors 17,520 19,660 2,140 1.20% 12.20% 29 Healthcare Practitioners & Technical Occupations 370,940 416,240 45,300 1.20% 12.20% 53.7073 Wellhead Pumpers 420 470 50 1.10% 11.90% 53.5021 Captains, Mates & Pilots of Water Vessels 670 750 80 1.10% 11.90% 39.3091 Amusement & Recreation Attendants 10,290 11,510 1,220 1.10% 11.90% 39.2021 Non‐farm Animal Caretakers 7,030 7,860 830 1.10% 11.80% 47.5071 Roustabouts, Oil & Gas 1,450 1,620 170 1.10% 11.70% 19.1021 Biochemists & Biophysicists 2,220 2,480 260 1.10% 11.70% 51.3091 Food & Tobacco Roasting, Baking & Drying Machine Oprs 610 680 70 1.10% 11.50% 41.2021 Counter & Rental Clerks 17,240 19,230 1,990 1.10% 11.50% 23.2091 Court Reporters 700 780 80 1.10% 11.40% 19.1099 Life Scientists, Other 350 390 40 1.10% 11.40% 43.4051 Customer Service Representatives 100,840 112,250 11,410 1.10% 11.30% 45.1011 Supervisors ‐ Farming, Fishing & Forestry Workers 2,230 2,480 250 1.10% 11.20% 45.1 Supervisors, Farming, Fishing, & Forestry Workers 2,260 2,510 250 1.10% 11.10% 19.1 Life Scientists 13,580 15,070 1,490 1.00% 11.00% 29.1064 Obstetricians & Gynecologists 640 710 70 1.00% 10.90% 35.9011 Dining Room & Cafeteria Attendants & Bartender Helpers 15,980 17,700 1,720 1.00% 10.80% 35.3011 Bartenders 30,220 33,470 3,250 1.00% 10.80% 45.2091 Agricultural Equipment Oprs 3,370 3,730 360 1.00% 10.70% 41.9099 Sales & Related Workers, Other 2,830 3,130 300 1.00% 10.60% 29.1061 Anesthesiologists 1,700 1,880 180 1.00% 10.60% 53.5022 Motorboat Oprs 190 210 20 1.00% 10.50% 49.2098 Security & Fire Alarm Systems Installers 2,470 2,730 260 1.00% 10.50% 21.1 Counselors, Social Workers, & Other Social Services 112,770 124,590 11,820 1.00% 10.50%
SLIDE 38
Occupation Code (SOC) Occupational Title 2008 Estimated Employment 2018 Projected Employment Total 2008‐2018 Employment Change Annual Avg. Percent Change Total Percent Change 49.9094 Locksmiths & Safe Repairers 770 850 80 1.00% 10.40% 29.2032 Diagnostic Medical Sonographers 2,220 2,450 230 1.00% 10.40% 29.2 Health Technologists & Technicians 134,180 148,180 14,000 1.00% 10.40% 25.1126 Philosophy & Religion Teachers, Postsecondary 2,590 2,860 270 1.00% 10.40% 35.3021 Combined Food Preparation & Serving Workers 126,380 139,390 13,010 1.00% 10.30% 27.2023 Umpires, Referees, & Other Sports Officials 580 640 60 1.00% 10.30% 29.2051 Dietetic Technicians 1,080 1,190 110 1.00% 10.20% 19.3039 Psychologists, All Other 490 540 50 1.00% 10.20% 17.2011 Aerospace Engineers 1,280 1,410 130 1.00% 10.20% 39.9031 Fitness Trainers & Aerobics Instructors 11,310 12,450 1,140 1.00% 10.10% 21.1099 Community & Social Service Specialists, All Other 2,180 2,400 220 1.00% 10.10% 47.4061 Rail‐Track Laying & Maintenance Equipment Oprs 500 550 50 1.00% 10.00% 45.2021 Animal Breeders 200 220 20 1.00% 10.00% 17.2081 Environmental Engineers 2,910 3,200 290 1.00% 10.00% 47.4011 Construction & Building Inspectors 5,690 6,250 560 0.90% 9.80% 35.2021 Food Preparation Workers 35,480 38,940 3,460 0.90% 9.80% 11.9021 Construction Managers 10,270 11,280 1,010 0.90% 9.80% 31.1012 Nursing Aides, Orderlies, & Attendants 80,590 88,440 7,850 0.90% 9.70% 25.1194 Vocational Education Teachers, Postsecondary 6,080 6,670 590 0.90% 9.70% 19.1012 Food Scientists & Technologists 310 340 30 0.90% 9.70% 45.4011 Forest & Conservation Workers 520 570 50 0.90% 9.60% 53.4 Rail Transportation Workers 5,450 5,970 520 0.90% 9.50% 49.2091 Avionics Technicians 320 350 30 0.90% 9.40% 43.4081 Hotel, Motel & Resort Desk Clerks 6,500 7,110 610 0.90% 9.40% 35.3041 Food Servers, Non‐restaurant 11,320 12,380 1,060 0.90% 9.40% 35.2014 Cooks, Restaurant 34,440 37,690 3,250 0.90% 9.40% 27.3031 Public Relations Specialists 10,130 11,080 950 0.90% 9.40% 25.4012 Curators 430 470 40 0.90% 9.30% 19.4021 Biological Technicians 3,220 3,520 300 0.90% 9.30% 33.9092 Lifeguards, Ski Patrol, & Other Protective Service Workers 5,560 6,070 510 0.90% 9.20% 29.2071 Medical Records & Health Information Technicians 7,860 8,580 720 0.90% 9.20% 35.3 Food & Beverage Serving Workers 280,310 305,930 25,620 0.90% 9.10% 29.1069 Physicians & Surgeons, Other 10,730 11,680 950 0.90% 8.90% 11.9121 Natural Sciences Managers 1,460 1,590 130 0.90% 8.90% 39.3031 Ushers, Lobby Attendants, & Ticket Takers 5,690 6,190 500 0.80% 8.80% 37.3011 Landscaping & Groundskeeping Workers 46,520 50,590 4,070 0.80% 8.80% 49.3011 Aircraft Mechanics & Service Technicians 3,120 3,390 270 0.80% 8.70% 21 Community & Social Services Occupations 128,760 139,910 11,150 0.80% 8.70% 13.2052 Personal Financial Advisors 9,090 9,880 790 0.80% 8.70% 11.911.1 Medical & Health Services Managers 14,220 15,450 1,230 0.80% 8.70% 27.1023 Floral Designers 3,240 3,520 280 0.80% 8.60% 25.2011 Preschool Teachers 15,650 17,000 1,350 0.80% 8.60% 17.1022 Surveyors 2,100 2,280 180 0.80% 8.60% 15.1 Computer Specialists 123,680 134,290 10,610 0.80% 8.60% 29.2034 Radiologic Technologists & Technicians 10,950 11,880 930 0.80% 8.50%
SLIDE 39
Occupation Code (SOC) Occupational Title 2008 Estimated Employment 2018 Projected Employment Total 2008‐2018 Employment Change Annual Avg. Percent Change Total Percent Change 53.5 Water Transportation Workers 1,320 1,430 110 0.80% 8.30% 45.2099 Agricultural Workers, All Other 970 1,050 80 0.80% 8.30% 37.3 Grounds Maintenance Workers 50,530 54,740 4,210 0.80% 8.30% 29.2012 Medical & Clinical Laboratory Technicians 10,450 11,320 870 0.80% 8.30% 27.1019 Artists & Related Workers, All Other 240 260 20 0.80% 8.30% 25.9031 Instructional Coordinators 5,040 5,460 420 0.80% 8.30% 15 Computer & Mathematical Occupations 128,470 139,160 10,690 0.80% 8.30% 35 Food Preparation & Serving Related Occupations 485,200 524,560 39,360 0.80% 8.10% 29.1199 Health Diagnosing & Treating Practitioners, Other 1,110 1,200 90 0.80% 8.10% 49.9041 Industrial Machinery Mechanics 16,240 17,540 1,300 0.80% 8.00% 39.4021 Funeral Attendants 1,750 1,890 140 0.80% 8.00% 39.4 Funeral Service Workers 1,880 2,030 150 0.80% 8.00% 13.1032 Insurance Appraisers, Auto Damage 880 950 70 0.80% 8.00% 51.6011 Laundry & Dry‐Cleaning Workers 8,470 9,140 670 0.80% 7.90% 49.3042 Mobile Heavy Equipment Mechanics 5,670 6,120 450 0.80% 7.90% 33.3 Law Enforcement Workers 51,400 55,440 4,040 0.80% 7.90% 11.9033 Education Administrators, Postsecondary 6,450 6,960 510 0.80% 7.90% 35.9 Other Food Preparation & Serving Related Workers 54,070 58,310 4,240 0.80% 7.80% 29.2033 Nuclear Medicine Technologists 1,160 1,250 90 0.80% 7.80% 25.4013 Museum Technicians & Conservators 510 550 40 0.80% 7.80% 11.9061 Funeral Directors 1,660 1,790 130 0.80% 7.80% 53.2 Air Transportation Workers 3,000 3,230 230 0.70% 7.70% 47.2011 Boilermakers 390 420 30 0.70% 7.70% 39.4011 Embalmers 130 140 10 0.70% 7.70% 29.1011 Chiropractors 2,330 2,510 180 0.70% 7.70% 53.2011 Airline Pilots, Copilots, & Flight Engineers 1,580 1,700 120 0.70% 7.60% 33.9099 Protective Service Workers, Other 1,850 1,990 140 0.70% 7.60% 13.1011 Agents of Artists, Performers, & Athletes 530 570 40 0.70% 7.60% 35.3031 Waiters & Waitresses 97,160 104,460 7,300 0.70% 7.50% 39.6021 Tour Guides & Escorts 2,160 2,320 160 0.70% 7.40% 35.9031 Hosts & Hostesses ‐ Restaurant, Lounge & Coffee Shop 14,820 15,910 1,090 0.70% 7.40% 33.9 Other Protective Service Workers 55,560 59,670 4,110 0.70% 7.40% 33 Protective Service Occupations 119,620 128,300 8,680 0.70% 7.30% 19.2042 Geoscientists 690 740 50 0.70% 7.30% 13.1079 HR, Training, & Labor Relations Specialists, All Other 9,790 10,500 710 0.70% 7.30% 27.2021 Athletes & Sports Competitors 1,250 1,340 90 0.70% 7.20% 21.1022 Medical & Public Health Social Workers 10,490 11,240 750 0.70% 7.20% 17.2051 Civil Engineers 12,150 13,030 880 0.70% 7.20% 39.6022 Travel Guides 280 300 20 0.70% 7.10% 31.9099 Healthcare Support Workers, Other 6,590 7,060 470 0.70% 7.10% 17.1021 Cartographers & Photogrammetrists 280 300 20 0.70% 7.10% 47.5013 Service Unit Oprs, Oil, Gas, & Mining 860 920 60 0.70% 7.00% 25.2041 Special Education Teachers, Pre/Kindergarten/Elementary 11,690 12,510 820 0.70% 7.00% 13.1051 Cost Estimators 11,080 11,860 780 0.70% 7.00% 53.2022 Airfield Operations Specialists 290 310 20 0.70% 6.90%
SLIDE 40
Occupation Code (SOC) Occupational Title 2008 Estimated Employment 2018 Projected Employment Total 2008‐2018 Employment Change Annual Avg. Percent Change Total Percent Change 51.3022 Meat, Poultry & Fish Cutters & Trimmers 3,060 3,270 210 0.70% 6.90% 43.4061 Eligibility Interviewers, Government Programs 4,360 4,660 300 0.70% 6.90% 33.9021 Private Detectives & Investigators 3,610 3,860 250 0.70% 6.90% 27.2011 Actors 720 770 50 0.70% 6.90% 19.2041 Environmental Scientists & Specialists 1,890 2,020 130 0.70% 6.90% 47.5 Extraction Workers 8,280 8,840 560 0.70% 6.80% 43.6013 Medical Secretaries 20,370 21,750 1,380 0.70% 6.80% 33.9032 Security Guards 38,990 41,640 2,650 0.70% 6.80% 31.9093 Medical Equipment Preparers 1,770 1,890 120 0.70% 6.80% 29.2099 Health Technologists & Technicians, All Other 2,340 2,500 160 0.70% 6.80% 29.2011 Medical & Clinical Laboratory Technologists 9,030 9,640 610 0.70% 6.80% 27.4099 Media & Communication Equipment Workers, Other 440 470 30 0.70% 6.80% 11.9031 Education Administrators, Preschool & Child Care Center 2,490 2,660 170 0.70% 6.80% 33.9011 Animal Control Workers 300 320 20 0.60% 6.70% 19.3041 Sociologists 150 160 10 0.60% 6.70% 35.3022 Counter Attendants ‐ Cafeteria, Food Concession, Coffee Shop 15,230 16,230 1,000 0.60% 6.60% 45.4022 Logging Equipment Oprs 460 490 30 0.60% 6.50% 35.2 Cooks & Food Preparation Workers 114,860 122,340 7,480 0.60% 6.50% 17.3025 Environmental Engineering Technicians 1,550 1,650 100 0.60% 6.50% 11.9081 Lodging Managers 1,840 1,960 120 0.60% 6.50% 29.9099 Healthcare Practitioner & Technical Workers, Other 4,510 4,800 290 0.60% 6.40% 27.1027 Set & Exhibit Designers 470 500 30 0.60% 6.40% 21.1015 Rehabilitation Counselors 7,870 8,370 500 0.60% 6.40% 19.3031 Clinical, Counseling, & School Psychologists 6,300 6,700 400 0.60% 6.40% 53.3032 Truck Drivers, Heavy & Tractor‐Trailer 77,960 82,860 4,900 0.60% 6.30% 21.1019 Counselors, All Other 480 510 30 0.60% 6.30% 17.217.1 Petroleum Engineers 160 170 10 0.60% 6.30% 53.3041 Taxi Drivers & Chauffeurs 10,320 10,960 640 0.60% 6.20% 35.9021 Dishwashers 22,230 23,600 1,370 0.60% 6.20% 15.2011 Actuaries 1,130 1,200 70 0.60% 6.20% 51.3011 Bakers 9,390 9,960 570 0.60% 6.10% 39.9041 Residential Advisors 4,610 4,890 280 0.60% 6.10% 19 Life, Physical, & Social Science Occupations 60,960 64,680 3,720 0.60% 6.10% 13.1121 Meeting & Convention Planners 2,120 2,250 130 0.60% 6.10% 11.9151 Social & Community Service Managers 7,600 8,060 460 0.60% 6.10% 43.4171 Receptionists & Information Clerks 52,830 55,980 3,150 0.60% 6.00% 37.2012 Maids & Housekeeping Cleaners 37,500 39,740 2,240 0.60% 6.00% 37.1012 Supervisors ‐ Landscaping & Groundskeeping Workers 5,970 6,330 360 0.60% 6.00% 19.4091 Environmental Science & Protection Technicians 1,330 1,410 80 0.60% 6.00% 19.1022 Microbiologists 500 530 30 0.60% 6.00% 13.1073 Training & Development Specialists 9,470 10,040 570 0.60% 6.00% 53.5031 Ship Engineers 170 180 10 0.60% 5.90% 53.2012 Commercial Pilots 510 540 30 0.60% 5.90% 19.2043 Hydrologists 170 180 10 0.60% 5.90% 15.1011 Computer & Information Scientists, Research 1,180 1,250 70 0.60% 5.90%
SLIDE 41
Occupation Code (SOC) Occupational Title 2008 Estimated Employment 2018 Projected Employment Total 2008‐2018 Employment Change Annual Avg. Percent Change Total Percent Change 35.9099 Food Preparation & Serving Related Workers, Other 1,040 1,100 60 0.60% 5.80% 51.3 Food Processing Workers 31,090 32,850 1,760 0.60% 5.70% 43.4111 Interviewers 6,530 6,900 370 0.60% 5.70% 41.9011 Demonstrators & Product Promoters 3,360 3,550 190 0.60% 5.70% 35.1012 Supervisors ‐ Food Preparation & Serving Workers 31,760 33,580 1,820 0.60% 5.70% 29.2061 Licensed Practical & Licensed Vocational Nurses 38,800 41,000 2,200 0.60% 5.70% 25.4011 Archivists 350 370 20 0.60% 5.70% 19.4099 Life, Physical, & Social Science Technicians, Other 1,060 1,120 60 0.60% 5.70% 49.9091 Coin, Vending, & Amusement Machine Servicers & Repairers 1,980 2,090 110 0.50% 5.60% 35.1 Supervisors, Food Preparation & Serving Workers 35,970 37,970 2,000 0.50% 5.60% 13.1072 Compensation, Benefits & Job Analysis Specialists 5,320 5,620 300 0.60% 5.60% 27.4031 Camera Oprs ‐ TV, Video, & Motion Picture 550 580 30 0.50% 5.50% 27.1026 Merchandise Displayers & Window Trimmers 2,710 2,860 150 0.50% 5.50% 39.6 Transportation, Tourism, & Lodging Attendants 7,440 7,840 400 0.50% 5.40% 33.1011 Supervisors ‐ Correctional Officers 560 590 30 0.50% 5.40% 29.9 Other Healthcare Practitioners & Technical Occupations 8,530 8,990 460 0.50% 5.40% 19.4 Life, Physical, & Social Science Technicians 12,470 13,140 670 0.50% 5.40% 37 Building & Grounds Cleaning & Maintenance Occupations 214,970 226,260 11,290 0.50% 5.30% 29.2053 Psychiatric Technicians 1,140 1,200 60 0.50% 5.30% 23.2 Legal Support Workers 15,960 16,810 850 0.50% 5.30% 21.1092 Probation Officers & Correctional Treatment Specialists 4,320 4,550 230 0.50% 5.30% 21.1021 Child, Family, & School Social Workers 18,560 19,540 980 0.50% 5.30% 19.4061 Social Science Research Assistants 190 200 10 0.50% 5.30% 19.3093 Historians 190 200 10 0.50% 5.30% 13.1061 Emergency Management Specialists 750 790 40 0.50% 5.30% 11.9 Other Management Occupations 133,780 140,930 7,150 0.50% 5.30% 47.2044 Tile & Marble Setters 1,550 1,630 80 0.50% 5.20% 41.3011 Advertising Sales Agents 7,710 8,110 400 0.50% 5.20% 51.8031 Water & Liquid Waste Treatment Plant & System Oprs 7,280 7,650 370 0.50% 5.10% 39.6012 Concierges 390 410 20 0.50% 5.10% 29.1066 Psychiatrists 1,770 1,860 90 0.50% 5.10% 21.1029 Social Workers, All Other 990 1,040 50 0.50% 5.10% 17.2061 Computer Hardware Engineers 1,380 1,450 70 0.50% 5.10% 53.3099 Motor Vehicle Oprs, Other 1,390 1,460 70 0.50% 5.00% 47.2141 Painters, Construction, & Maintenance 10,050 10,550 500 0.50% 5.00% 37.1 Supervisors, Building & Grounds Workers 14,910 15,660 750 0.50% 5.00% 29.1129. Therapists, All Other 1,190 1,250 60 0.50% 5.00% 19.4041 Geological & Petroleum Technicians 200 210 10 0.50% 5.00% 13.2011 Accountants & Auditors 55,770 58,530 2,760 0.50% 5.00% 11.3042 Training & Development Managers 1,010 1,060 50 0.50% 5.00% 11.2031 Public Relations Managers 2,020 2,120 100 0.50% 5.00% 33.3041 Parking Enforcement Workers 630 660 30 0.50% 4.80% 33.1 First‐Line Supervisors of Protective Service Workers 7,050 7,390 340 0.50% 4.80% 25.9099 Education, Training, & Library Workers, All Other 1,680 1,760 80 0.50% 4.80% 23.2099 Legal Support Workers, Other 630 660 30 0.50% 4.80%
SLIDE 42 Occupation Code (SOC) Occupational Title 2008 Estimated Employment 2018 Projected Employment Total 2008‐2018 Employment Change Annual Avg. Percent Change Total Percent Change 19.3021 Market Research Analysts 13,400 14,040 640 0.50% 4.80% 47.5042 Mine Cutting & Channeling Machine Oprs 640 670 30 0.50% 4.70% 47.5012 Rotary Drill Oprs, Oil & Gas 1,070 1,120 50 0.50% 4.70% 21.1013 Marriage & Family Therapists 1,060 1,110 50 0.50% 4.70% 53.6031 Service Station Attendants 2,190 2,290 100 0.40% 4.60% 19.3 Social Scientists & Related Workers 25,930 27,120 1,190 0.50% 4.60% 13.2081 Tax Examiners, Collectors & Revenue Agents 5,020 5,250 230 0.40% 4.60% 47.4 Other Construction & Related Workers 20,380 21,290 910 0.40% 4.50% 25.2042 Special Education Teachers, Middle School 5,560 5,810 250 0.40% 4.50% 17.1 Architects, Surveyors, & Cartographers 8,600 8,990 390 0.40% 4.50% 53.7033 Loading Machine Oprs, Underground Mining 230 240 10 0.40% 4.40% 53.7032 Excavating & Loading Machine & Dragline Oprs 2,990 3,120 130 0.40% 4.40% 39.6031 Flight Attendants 2,530 2,640 110 0.40% 4.40% 37.1011 Supervisors ‐ Housekeeping & Janitorial Workers 8,940 9,330 390 0.40% 4.40% 19.3091 Anthropologists & Archeologists 230 240 10 0.40% 4.40% 19.1013 Soil & Plant Scientists 230 240 10 0.40% 4.40% 39.6011 Baggage Porters & Bellhops 1,400 1,460 60 0.40% 4.30% 39.1021 Supervisors, Personal Service Workers 5,530 5,770 240 0.40% 4.30% 37.3012 Pesticide Handlers, Sprayers & Applicators, Vegetation 1,880 1,960 80 0.40% 4.30% 35.1011 Chefs & Head Cooks 4,210 4,390 180 0.40% 4.30% 27.2012 Producers & Directors 2,590 2,700 110 0.40% 4.30% 25.2012 Kindergarten Teachers 8,710 9,080 370 0.40% 4.30% 51.3023 Slaughterers & Meat Packers 3,580 3,730 150 0.40% 4.20% 49.2094
- Elec. Repairers ‐ Commercial & Industrial Equipment
4,730 4,930 200 0.40% 4.20% 37.2 Building Cleaning & Pest Control Workers 149,530 155,860 6,330 0.40% 4.20% 27.3042 Technical Writers 1,670 1,740 70 0.40% 4.20% 27.1029 Designers, All Other 240 250 10 0.40% 4.20% 19.2 Physical Scientists 8,980 9,360 380 0.40% 4.20% 51.8092 Gas Plant Oprs 1,210 1,260 50 0.40% 4.10% 43.5031 Police, Fire, & Ambulance Dispatchers 3,160 3,290 130 0.40% 4.10% 29.1065 Pediatricians, General 730 760 30 0.40% 4.10% 17.3031 Surveying & Mapping Technicians 1,720 1,790 70 0.40% 4.10% 53.7071 Gas Compressor & Gas Pumping Station Oprs 250 260 10 0.40% 4.00% 27.4014 Sound Engineering Technicians 500 520 20 0.40% 4.00% 27.1013 Fine Artists 500 520 20 0.40% 4.00% 23 Legal Occupations 47,310 49,210 1,900 0.40% 4.00% 13.2061 Financial Examiners 990 1,030 40 0.40% 4.00% 53.3022 Bus Drivers, School 26,250 27,270 1,020 0.40% 3.90% 41.2031 Retail Salespersons 206,300 214,410 8,110 0.40% 3.90% 29.2091 Orthotists & Prosthetists 260 270 10 0.40% 3.90% 19.3099 Social Scientists & Related Workers, Other 520 540 20 0.40% 3.90% 49.3031 Bus & Truck Mechanics & Diesel Engine Specialists 12,120 12,580 460 0.40% 3.80% 17.2041 Chemical Engineers 1,320 1,370 50 0.40% 3.80% 17.2 Engineers 59,640 61,910 2,270 0.40% 3.80% 11.9199 Managers, Other 15,510 16,100 590 0.40% 3.80%
SLIDE 43
Occupation Code (SOC) Occupational Title 2008 Estimated Employment 2018 Projected Employment Total 2008‐2018 Employment Change Annual Avg. Percent Change Total Percent Change 47.4051 Highway Maintenance Workers 9,570 9,920 350 0.40% 3.70% 37.2011 Janitors & Cleaners 109,170 113,200 4,030 0.40% 3.70% 31.9094 Medical Transcriptionists 5,620 5,830 210 0.40% 3.70% 11.3021 Computer & Information Systems Managers 9,260 9,600 340 0.40% 3.70% 53.3011 Ambulance Drivers & Attendants 1,100 1,140 40 0.40% 3.60% 43.4021 Correspondence Clerks 1,110 1,150 40 0.40% 3.60% 33.2 Fire Fighting & Prevention Workers 5,600 5,800 200 0.40% 3.60% 29.2041 Emergency Medical Technicians & Paramedics 13,480 13,970 490 0.40% 3.60% 23.1011 Lawyers 28,390 29,410 1,020 0.40% 3.60% 19.3051 Urban & Regional Planners 1,650 1,710 60 0.40% 3.60% 17.1012 Landscape Architects 830 860 30 0.40% 3.60% 41.3 Sales Representatives, Services 53,350 55,220 1,870 0.30% 3.50% 33.2021 Fire Inspectors & Investigators 290 300 10 0.30% 3.50% 53.1031 Supervisors ‐ Trans. & Material‐Moving Machine Oprs 9,210 9,520 310 0.30% 3.40% 49.3022 Automotive Glass Installers & Repairers 1,170 1,210 40 0.30% 3.40% 33.2011 Fire Fighters 5,310 5,490 180 0.30% 3.40% 33.1021 Supervisors ‐ Fire Fighting & Prevention 1,190 1,230 40 0.30% 3.40% 23.1 Lawyers, Judges, & Related Workers 31,350 32,400 1,050 0.30% 3.40% 13.1 Business Operations Specialists 146,340 151,380 5,040 0.30% 3.40% 43.4161 Human Resources Assistants 9,060 9,360 300 0.30% 3.30% 19.4011 Agricultural & Food Science Technicians 610 630 20 0.30% 3.30% 11.3071 Transportation, Storage, & Distribution Managers 3,610 3,730 120 0.30% 3.30% 49.3 Vehicle & Mobile Equipment Mechanics, Installers 78,350 80,850 2,500 0.30% 3.20% 47.5021 Earth Drillers, except Oil & Gas 950 980 30 0.30% 3.20% 33.3051 Police & Sheriffs Patrol Officers 28,060 28,950 890 0.30% 3.20% 29.1041 Optometrists 1,560 1,610 50 0.30% 3.20% 25 Education, Training, & Library Occupations 378,520 390,470 11,950 0.30% 3.20% 19.2099 Physical Scientists, Other 310 320 10 0.30% 3.20% 19.2031 Chemists 5,070 5,230 160 0.30% 3.20% 19.1029 Biological Scientists, All Other 310 320 10 0.30% 3.20% 17.2111 Health & Safety Engineers 1,260 1,300 40 0.30% 3.20% 17.1011 Architects 5,390 5,560 170 0.30% 3.20% 13 Business & Financial Operations Occupations 259,860 268,240 8,380 0.30% 3.20% 47.2073 Operating Engineers & Other Construction Equipment Oprs 16,580 17,100 520 0.30% 3.10% 47.2061 Construction Laborers 39,010 40,230 1,220 0.30% 3.10% 29.1062 Family & General Practitioners 10,020 10,330 310 0.30% 3.10% 15.2041 Statisticians 1,310 1,350 40 0.30% 3.10% 49.3023 Automotive Service Technicians & Mechanics 39,150 40,330 1,180 0.30% 3.00% 47.5081 Helpers ‐ Extraction Workers 1,010 1,040 30 0.30% 3.00% 47.5041 Continuous Mining Machine Oprs 660 680 20 0.30% 3.00% 29.1067 Surgeons 3,020 3,110 90 0.30% 3.00% 49.9069 Precision Instrument & Equipment Repairers, Other 680 700 20 0.30% 2.90% 47.3015 Helpers ‐ Pipelayers, Plumbers, Pipefitters, & Steamfitters 2,050 2,110 60 0.30% 2.90% 39.6032 Transportation Attendants 680 700 20 0.30% 2.90% 29.1063 Internists, General 2,460 2,530 70 0.30% 2.90%
SLIDE 44
Occupation Code (SOC) Occupational Title 2008 Estimated Employment 2018 Projected Employment Total 2008‐2018 Employment Change Annual Avg. Percent Change Total Percent Change 27.2099 Entertainers, Performers, Sports, & Related Workers, Other 340 350 10 0.30% 2.90% 13.2 Financial Specialists 113,530 116,870 3,340 0.30% 2.90% 53.3 Motor Vehicle Operators 194,400 199,800 5,400 0.30% 2.80% 53.1 Supervisors, Transportation & Material Moving Workers 16,120 16,570 450 0.30% 2.80% 49.9099 Installation, Maintenance, & Repair Workers, Other 2,820 2,900 80 0.30% 2.80% 47.2151 Pipelayers 1,080 1,110 30 0.30% 2.80% 43.6012 Legal Secretaries 14,520 14,930 410 0.30% 2.80% 25.3021 Self‐Enrichment Education Teachers 8,920 9,170 250 0.30% 2.80% 53.7121 Tank Car, Truck & Ship Loaders 370 380 10 0.30% 2.70% 51.9082 Medical Appliance Technicians 1,130 1,160 30 0.30% 2.70% 43.5011 Cargo & Freight Agents 2,640 2,710 70 0.30% 2.70% 39.9032 Recreation Workers 13,330 13,670 340 0.30% 2.60% 37.3013 Tree Trimmers & Pruners 1,560 1,600 40 0.30% 2.60% 29.9012 Occupational Health & Safety Technicians 380 390 10 0.30% 2.60% 19.4031 Chemical Technicians 4,620 4,740 120 0.30% 2.60% 11.9012 Farmers & Ranchers 29,250 30,010 760 0.30% 2.60% 53.3021 Bus Drivers, Transit & Intercity 14,850 15,220 370 0.20% 2.50% 47.2152 Plumbers, Pipefitters, & Steamfitters 15,030 15,410 380 0.30% 2.50% 27.1025 Interior Designers 2,030 2,080 50 0.20% 2.50% 11.3049 Human Resources Managers, All Other 1,610 1,650 40 0.20% 2.50% 47.1011 Supervisors ‐ Construction Trades & Extraction Workers 20,060 20,550 490 0.20% 2.40% 47.1 Supervisors, Construction & Extraction Workers 20,060 20,550 490 0.20% 2.40% 43.3071 Tellers 30,870 31,600 730 0.20% 2.40% 17.3029 Engineering Technicians, Except Drafters, All Other 1,690 1,730 40 0.20% 2.40% 15.1099 Computer Specialists, Other 5,060 5,180 120 0.20% 2.40% 11.3011. Administrative Services Managers 9,510 9,740 230 0.20% 2.40% 45.2011 Agricultural Inspectors 430 440 10 0.20% 2.30% 43.4031 Court, Municipal, & License Clerks 2,170 2,220 50 0.20% 2.30% 43.3031 Bookkeeping, Accounting, & Auditing Clerks 82,980 84,900 1,920 0.20% 2.30% 37.2019 Building Cleaning Workers, All Other 1,300 1,330 30 0.20% 2.30% 33.3052 Transit & Railroad Police 430 440 10 0.20% 2.30% 25.3 Other Teachers & Instructors 19,760 20,220 460 0.20% 2.30% 13.1041 Compliance Officers 7,410 7,580 170 0.20% 2.30% 51.8093 Petroleum Pump System Oprs, Refinery Oprs & Gaugers 1,830 1,870 40 0.20% 2.20% 47.5061 Roof Bolters, Mining 460 470 10 0.20% 2.20% 47.2071 Paving, Surfacing, & Tamping Equipment Oprs 2,280 2,330 50 0.20% 2.20% 43.6011 Executive Secretaries & Administrative Assistants 42,950 43,880 930 0.20% 2.20% 41.4011 Sales Representatives, Technical & Scientific Products 17,010 17,380 370 0.20% 2.20% 25.3099 Teachers & Instructors, All Other 8,060 8,240 180 0.20% 2.20% 11.9051 Food Service Managers 6,720 6,870 150 0.20% 2.20% 49.9021 Heating, A/C & Refrigeration Mechanics/Installers 14,570 14,870 300 0.20% 2.10% 45.4 Forest, Conservation, & Logging Workers 1,410 1,440 30 0.20% 2.10% 49.9044 Millwrights 1,530 1,560 30 0.20% 2.00% 43.4 Information & Record Clerks 233,770 238,350 4,580 0.20% 2.00% 33.3011 Bailiffs 510 520 10 0.20% 2.00%
SLIDE 45
Occupation Code (SOC) Occupational Title 2008 Estimated Employment 2018 Projected Employment Total 2008‐2018 Employment Change Annual Avg. Percent Change Total Percent Change 25.4031 Library Technicians 5,130 5,230 100 0.20% 2.00% 25.2021 Elementary School Teachers 81,880 83,520 1,640 0.20% 2.00% 23.1023 Judges, Magistrate Judges, & Magistrates 1,010 1,030 20 0.20% 2.00% 11.2021 Marketing Managers 5,530 5,640 110 0.20% 2.00% 49.9011 Mechanical Door Repairers 540 550 10 0.20% 1.90% 49 Installation, Maintenance, & Repair Occupations 251,740 256,410 4,670 0.20% 1.90% 47.2181 Roofers 5,200 5,300 100 0.20% 1.90% 43.9111 Statistical Assistants 1,050 1,070 20 0.20% 1.90% 37.2021 Pest Control Workers 1,560 1,590 30 0.20% 1.90% 27.1 Art & Design Workers 27,330 27,850 520 0.20% 1.90% 53.6 Other Transportation Workers 10,000 10,180 180 0.20% 1.80% 47.4031 Fence Erectors 1,110 1,130 20 0.20% 1.80% 43.3 Financial Clerks 168,910 171,920 3,010 0.20% 1.80% 33.1012 Supervisors ‐ Police & Detectives 3,830 3,900 70 0.20% 1.80% 29.1127 Speech‐Language Pathologists 4,540 4,620 80 0.20% 1.80% 13.2031 Budget Analysts 2,210 2,250 40 0.20% 1.80% 53.1021 Supervisors ‐ Helpers, Laborers, & Material Movers 6,680 6,790 110 0.20% 1.70% 49.9 Other Installation, Maintenance, & Repair Occupations 135,340 137,610 2,270 0.20% 1.70% 49.3051 Motorboat Mechanics 580 590 10 0.20% 1.70% 37.3019 Grounds Maintenance Workers, All Other 580 590 10 0.20% 1.70% 15.2 Mathematical Scientists 4,790 4,870 80 0.20% 1.70% 47.3019 Helpers ‐ Other Construction Trades 620 630 10 0.20% 1.60% 47 Construction & Extraction Occupations 265,770 270,100 4,330 0.20% 1.60% 43.9061 Office Clerks, General 163,680 166,250 2,570 0.20% 1.60% 41.4 Sales Representatives, Wholesale & Manufacturing 102,310 103,930 1,620 0.20% 1.60% 35.2011 Cooks, Fast Food 12,080 12,270 190 0.20% 1.60% 11.9039 Education Administrators, All Other 1,270 1,290 20 0.20% 1.60% 53.7081 Refuse & Recyclable Material Collectors 5,490 5,570 80 0.10% 1.50% 49.3053 Outdoor Power Equipment & Other Small Engine Mechanics 1,380 1,400 20 0.10% 1.50% 41.4012 Sales Representatives 85,300 86,550 1,250 0.10% 1.50% 23.1022 Arbitrators, Mediators, & Conciliators 690 700 10 0.10% 1.50% 19.2032 Materials Scientists 690 700 10 0.10% 1.50% 47.3012 Helpers ‐ Carpenters 2,770 2,810 40 0.10% 1.40% 35.2012 Cooks, Institution & Cafeteria 19,320 19,590 270 0.10% 1.40% 51.9071 Jewelers & Precious Stone & Metal Workers 1,520 1,540 20 0.10% 1.30% 43.4121 Library Assistants, Clerical 6,130 6,210 80 0.10% 1.30% 17 Architecture & Engineering Occupations 101,910 103,280 1,370 0.10% 1.30% 47.2 Construction Trades Workers 206,590 208,980 2,390 0.10% 1.20% 21.1012 Educational, Vocational, & School Counselors 13,470 13,630 160 0.10% 1.20% 47.2031 Carpenters 55,080 55,670 590 0.10% 1.10% 35.2015 Cooks, Short Order 11,880 12,010 130 0.10% 1.10% 25.3011 Adult Literacy, Remedial Education, & GED Teachers 2,780 2,810 30 0.10% 1.10% 13.1031 Claims Adjusters, Examiners, & Investigators 15,900 16,070 170 0.10% 1.10% 17.2151 Mining & Geological Engineers 960 970 10 0.10% 1.00% 49.2022 Telecommunications Equipment Installers & Repairers 5,690 5,740 50 0.10% 0.90%
SLIDE 46 Occupation Code (SOC) Occupational Title 2008 Estimated Employment 2018 Projected Employment Total 2008‐2018 Employment Change Annual Avg. Percent Change Total Percent Change 49.9042 Maintenance & Repair Workers, General 65,710 66,250 540 0.10% 0.80% 41.2 Retail Sales Workers 391,050 394,280 3,230 0.10% 0.80% 27.1011 Art Directors 2,460 2,480 20 0.10% 0.80% 23.1021
- Admin. Law Judges, Adjudicators, & Hearing Officers
1,260 1,270 10 0.10% 0.80% 11 Management Occupations 268,610 270,750 2,140 0.10% 0.80% 49.9098 Helpers ‐ Installation, Maintenance & Repair Workers 6,740 6,790 50 0.10% 0.70% 47.2051 Cement Masons & Concrete Finishers 5,390 5,430 40 0.10% 0.70% 39.5011 Barbers 4,290 4,320 30 0.10% 0.70% 25.2 Primary, Secondary, & Special Education School Teachers 214,590 216,040 1,450 0.10% 0.70% 53.7061 Cleaners of Vehicles & Equipment 13,400 13,480 80 0.10% 0.60% 13.1111 Management Analysts 26,260 26,410 150 0.10% 0.60% 41.3021 Insurance Sales Agents 19,680 19,780 100 0.10% 0.50% 41.1011 Supervisors ‐ Retail Sales Workers 48,270 48,530 260 0.10% 0.50% 27.2022 Coaches & Scouts 9,300 9,350 50 0.10% 0.50% 17.2199 Engineers, Other 2,180 2,190 10 0.00% 0.50% 15.1041 Computer Support Specialists 23,710 23,830 120 0.10% 0.50% 13.1071 Employment, Recruitment & Placement Specialists 10,370 10,420 50 0.00% 0.50% 49.2 Electrical & Electronic Equipment Mechanics 23,120 23,200 80 0.00% 0.40% 41 Sales & Related Occupations 654,070 656,960 2,890 0.00% 0.40% 29.9011 Occupational Health & Safety Specialists 2,580 2,590 10 0.00% 0.40% 27.4 Media & Communication Equipment Workers 9,350 9,390 40 0.00% 0.40% 25.4 Librarians, Curators, & Archivists 13,820 13,880 60 0.00% 0.40% 25.2022 Middle School Teachers 30,760 30,890 130 0.00% 0.40% 29.1031 Dietitians & Nutritionists 3,120 3,130 10 0.00% 0.30% 11.2 Advertising, Marketing, Public Relations, & Sales Mgrs 19,270 19,290 20 0.00% 0.10% 53.6041 Traffic Technicians 60 60 N/A 0.00% 0.00% 53.5011 Sailors & Marine Oilers 290 290 N/A 0.00% 0.00% 51.8011 Nuclear Power Reactor Oprs 350 350 N/A 0.00% 0.00% 51.6041 Shoe & Leather Workers & Repairers 220 220 N/A 0.00% 0.00% 51.3021 Butchers & Meat Cutters 5,560 5,560 N/A 0.00% 0.00% 49.9097 Signal & Track Switch Repairers 460 460 N/A 0.00% 0.00% 49.9063 Musical Instrument Repairers & Tuners 210 210 N/A 0.00% 0.00% 49.9051 Electrical Power‐Line Installers & Repairers 4,640 4,640 N/A 0.00% 0.00% 49.3091 Bicycle Repairers 380 380 N/A 0.00% 0.00% 49.2096
- Elec. Equipment Installers & Repairers, Motor Vehicles
680 680 N/A 0.00% 0.00% 49.2093
- Elec. Installers & Repairers ‐ Transportation Equipment
340 340 N/A 0.00% 0.00% 49.2021 Radio Mechanics 70 70 N/A 0.00% 0.00% 47.5099 Extraction Workers, Other 50 50 N/A 0.00% 0.00% 47.5049 Mining Machine Oprs, Other 130 130 N/A 0.00% 0.00% 47.5031 Explosives Workers, Ordnance Handling Experts & Blasters 240 240 N/A 0.00% 0.00% 47.5011 Derrick Oprs, Oil & Gas 110 110 N/A 0.00% 0.00% 47.2171 Reinforcing Iron & Rebar Workers 330 330 N/A 0.00% 0.00% 47.2161 Plasterers & Stucco Masons 630 630 N/A 0.00% 0.00% 47.2132 Insulation Workers, Mechanical 780 780 N/A 0.00% 0.00% 47.2111 Electricians 26,340 26,350 10 0.00% 0.00%
SLIDE 47
Occupation Code (SOC) Occupational Title 2008 Estimated Employment 2018 Projected Employment Total 2008‐2018 Employment Change Annual Avg. Percent Change Total Percent Change 47.2082 Tapers 950 950 N/A 0.00% 0.00% 47.2053 Terrazzo Workers & Finishers 60 60 N/A 0.00% 0.00% 45.4021 Fallers 210 210 N/A 0.00% 0.00% 45.2041 Graders & Sorters, Agricultural Products 820 820 N/A 0.00% 0.00% 43.2099 Communications Equipment Oprs, Other 160 160 N/A 0.00% 0.00% 33.3031 Fish & Game Wardens 990 990 N/A 0.00% 0.00% 31.1013 Psychiatric Aides 2,920 2,920 N/A 0.00% 0.00% 29.1081 Podiatrists 870 870 N/A 0.00% 0.00% 29.1029 Dentists, All Other Specialists 230 230 N/A 0.00% 0.00% 29.1022 Oral & Maxillofacial Surgeons 120 120 N/A 0.00% 0.00% 27.3099 Media & Communication Workers, Other 800 800 N/A 0.00% 0.00% 27.3012 Public Address System & Other Announcers 160 160 N/A 0.00% 0.00% 27.2031 Dancers 220 220 N/A 0.00% 0.00% 19.4093 Forest & Conservation Technicians 110 110 N/A 0.00% 0.00% 19.3011 Economists 380 380 N/A 0.00% 0.00% 19.2021 Atmospheric & Space Scientists 50 50 N/A 0.00% 0.00% 19.2012 Physicists 120 120 N/A 0.00% 0.00% 19.1031 Conservation Scientists 560 560 N/A 0.00% 0.00% 19.1023 Zoologists & Wildlife Biologists 170 170 N/A 0.00% 0.00% 17.3027 Mechanical Engineering Technicians 1,920 1,920 N/A 0.00% 0.00% 17.2161 Nuclear Engineers 2,200 2,200 N/A 0.00% 0.00% 17.2121 Marine Engineers & Naval Architects 140 140 N/A 0.00% 0.00% 17.2021 Agricultural Engineers 90 90 N/A 0.00% 0.00% 11.3041 Compensation & Benefits Managers 2,360 2,360 N/A 0.00% 0.00% 53.6021 Parking Lot Attendants 6,230 6,220 ‐10 0.00% ‐0.20% 51.8 Plant & System Operators 17,300 17,260 ‐40 0.00% ‐0.20% 11.3 Operations Specialties Managers 53,450 53,370 ‐80 0.00% ‐0.20% 47.3 Helpers, Construction Trades 10,470 10,440 ‐30 0.00% ‐0.30% 41.3041. Travel Agents 3,630 3,620 ‐10 0.00% ‐0.30% 27 Arts, Design, Entertainment, Sports, & Media Occupations 92,440 92,160 ‐280 0.00% ‐0.30% 47.2081 Drywall & Ceiling Tile Installers 2,630 2,620 ‐10 0.00% ‐0.40% 31.9096 Veterinary Assistants & Laboratory Animal Caretakers 2,590 2,580 ‐10 0.00% ‐0.40% 25.9 Other Education, Training, & Library Occupations 62,650 62,360 ‐290 0.00% ‐0.50% 11.3031 Financial Managers 17,090 17,000 ‐90 ‐0.10% ‐0.50% 53.3033 Truck Drivers, Light or Delivery Services 43,210 42,970 ‐240 ‐0.10% ‐0.60% 41.1 Supervisors, Sales Workers 62,890 62,510 ‐380 ‐0.10% ‐0.60% 49.3043 Rail Car Repairers 1,400 1,390 ‐10 ‐0.10% ‐0.70% 17.3022 Civil Engineering Technicians 2,940 2,920 ‐20 ‐0.10% ‐0.70% 13.2099 Financial Specialists, Other 3,090 3,070 ‐20 ‐0.10% ‐0.70% 51.8021 Stationary Engineers & Boiler Oprs 1,230 1,220 ‐10 ‐0.10% ‐0.80% 47.4021 Elevator Installers & Repairers 1,190 1,180 ‐10 ‐0.10% ‐0.80% 29.2081 Opticians, Dispensing 2,470 2,450 ‐20 ‐0.10% ‐0.80% 17.3026 Industrial Engineering Technicians 4,010 3,980 ‐30 ‐0.10% ‐0.80% 49.3041 Farm Equipment Mechanics 1,060 1,050 ‐10 ‐0.10% ‐0.90% 47.4071 Septic Tank Servicers & Sewer Pipe Cleaners 1,180 1,170 ‐10 ‐0.10% ‐0.90%
SLIDE 48
Occupation Code (SOC) Occupational Title 2008 Estimated Employment 2018 Projected Employment Total 2008‐2018 Employment Change Annual Avg. Percent Change Total Percent Change 29.1021 Dentists, General 4,700 4,660 ‐40 ‐0.10% ‐0.90% 17.2072 Electronics Engineers 6,300 6,240 ‐60 ‐0.10% ‐1.00% 13.2021 Appraisers & Assessors of Real Estate 1,970 1,950 ‐20 ‐0.10% ‐1.00% 51.9083 Ophthalmic Laboratory Technicians 1,800 1,780 ‐20 ‐0.10% ‐1.10% 49.1011 Supervisors ‐ Mechanics, Installers, & Repairers 14,920 14,760 ‐160 ‐0.10% ‐1.10% 49.1 Supervisors of Installation, Maintenance, & Repair Workers 14,920 14,760 ‐160 ‐0.10% ‐1.10% 41.9031 Sales Engineers 3,680 3,640 ‐40 ‐0.10% ‐1.10% 51.9012 Separating, Filtering, Clarifying & Precipit. Machine Oprs 1,610 1,590 ‐20 ‐0.10% ‐1.20% 19.3022 Survey Researchers 2,470 2,440 ‐30 ‐0.10% ‐1.20% 25.9041 Teacher Assistants 54,490 53,790 ‐700 ‐0.10% ‐1.30% 27.3 Media & Communication Workers 27,860 27,460 ‐400 ‐0.10% ‐1.40% 11.2022 Sales Managers 10,260 10,120 ‐140 ‐0.10% ‐1.40% 51.9123 Painting, Coating & Decorating Workers 1,360 1,340 ‐20 ‐0.10% ‐1.50% 27.1024 Graphic Designers 10,560 10,400 ‐160 ‐0.20% ‐1.50% 51.8099 Plant & System Oprs, Other 610 600 ‐10 ‐0.20% ‐1.60% 49.9031 Home Appliance Repairers 1,930 1,900 ‐30 ‐0.20% ‐1.60% 49.2011 Computer, Automated Teller & Office Machine Repairers 5,030 4,950 ‐80 ‐0.20% ‐1.60% 47.2022 Stonemasons 610 600 ‐10 ‐0.20% ‐1.60% 47.2021 Brickmasons & Blockmasons 6,710 6,600 ‐110 ‐0.20% ‐1.60% 29.1121 Audiologists 620 610 ‐10 ‐0.20% ‐1.60% 27.2 Entertainers & Performers, Sports & Related Workers 27,910 27,470 ‐440 ‐0.20% ‐1.60% 11.9141 Property, Real Estate, & Community Association Mgrs 4,310 4,240 ‐70 ‐0.20% ‐1.60% 47.3011 Helpers ‐ Brick/Block/Stonemasons & Tile/Marble Setters 1,780 1,750 ‐30 ‐0.20% ‐1.70% 15.2031 Operations Research Analysts 2,290 2,250 ‐40 ‐0.20% ‐1.80% 47.2131 Insulation Workers, Floor, Ceiling, & Wall 520 510 ‐10 ‐0.20% ‐1.90% 17.2071 Electrical Engineers 5,700 5,590 ‐110 ‐0.20% ‐1.90% 27.3043 Writers & Authors 4,000 3,920 ‐80 ‐0.20% ‐2.00% 25.4021 Librarians 7,420 7,270 ‐150 ‐0.20% ‐2.00% 25.2043 Special Education Teachers, Secondary School 6,360 6,230 ‐130 ‐0.20% ‐2.00% 11.3061 Purchasing Managers 2,450 2,400 ‐50 ‐0.20% ‐2.00% 39.3021 Motion Picture Projectionists 470 460 ‐10 ‐0.20% ‐2.10% 41.3031 Securities, Commodities & Financial Services Sales Agents 9,890 9,670 ‐220 ‐0.20% ‐2.20% 47.3013 Helpers ‐ Electricians 2,220 2,170 ‐50 ‐0.20% ‐2.30% 13.2053 Insurance Underwriters 5,220 5,100 ‐120 ‐0.20% ‐2.30% 27.4012 Broadcast Technicians 1,260 1,230 ‐30 ‐0.20% ‐2.40% 43.4181 Reservation & Transportation Ticket Agents & Travel Clerks 3,080 3,000 ‐80 ‐0.30% ‐2.60% 43 Office & Administrative Support Occupations 1,028,010 1,001,790 ‐26,220 ‐0.30% ‐2.60% 29.1125 Recreational Therapists 1,560 1,520 ‐40 ‐0.30% ‐2.60% 53 Transportation & Material Moving Occupations 452,010 439,990 ‐12,020 ‐0.30% ‐2.70% 47.2121 Glaziers 1,460 1,420 ‐40 ‐0.30% ‐2.70% 29.2054 Respiratory Therapy Technicians 690 670 ‐20 ‐0.30% ‐2.90% 27.1021 Commercial & Industrial Designers 2,420 2,350 ‐70 ‐0.30% ‐2.90% 53.4021 Railroad Brake, Signal & Switch Oprs 660 640 ‐20 ‐0.30% ‐3.00% 49.9052 Telecommunications Line Installers & Repairers 9,420 9,130 ‐290 ‐0.30% ‐3.10% 43.9081 Proofreaders & Copy Markers 640 620 ‐20 ‐0.30% ‐3.10%
SLIDE 49 Occupation Code (SOC) Occupational Title 2008 Estimated Employment 2018 Projected Employment Total 2008‐2018 Employment Change Annual Avg. Percent Change Total Percent Change 49.3021 Automotive Body & Related Repairers 7,940 7,690 ‐250 ‐0.30% ‐3.20% 43.5061 Production, Planning, & Expediting Clerks 13,330 12,910 ‐420 ‐0.30% ‐3.20% 11.9032 Education Administrators, Elementary & Secondary School 9,200 8,910 ‐290 ‐0.30% ‐3.20% 25.9021 Farm & Home Management Advisors 1,220 1,180 ‐40 ‐0.30% ‐3.30% 11.9041 Engineering Managers 5,530 5,350 ‐180 ‐0.30% ‐3.30% 49.3092 Recreational Vehicle Service Technicians 590 570 ‐20 ‐0.30% ‐3.40% 47.2221 Structural Iron & Steel Workers 2,340 2,260 ‐80 ‐0.30% ‐3.40% 43.9 Other Office & Administrative Support Workers 228,030 220,320 ‐7,710 ‐0.30% ‐3.40% 43.6 Secretaries & Administrative Assistants 171,900 166,040 ‐5,860 ‐0.30% ‐3.40% 21.2011 Clergy 7,210 6,960 ‐250 ‐0.40% ‐3.50% 47.4041 Hazardous Materials Removal Workers 830 800 ‐30 ‐0.40% ‐3.60% 47.2211 Sheet Metal Workers 5,620 5,420 ‐200 ‐0.40% ‐3.60% 17.3 Drafters, Engineering, & Mapping Technicians 33,670 32,380 ‐1,290 ‐0.40% ‐3.80% 53.6099 Transportation Workers, Other 520 500 ‐20 ‐0.40% ‐3.90% 51.9199 Production Workers, Other 4,030 3,870 ‐160 ‐0.40% ‐4.00% 41.9091 Door‐To‐Door Sales Workers & News & Street Vendors 3,980 3,820 ‐160 ‐0.40% ‐4.00% 17.3012 Electrical & Electronics Drafters 1,260 1,210 ‐50 ‐0.40% ‐4.00% 51.4011 Computer‐Controlled Machine Tool Oprs 7,980 7,650 ‐330 ‐0.40% ‐4.10% 41.2011 Cashiers 156,740 150,390 ‐6,350 ‐0.40% ‐4.10% 19.1032 Foresters 490 470 ‐20 ‐0.40% ‐4.10% 17.2131 Materials Engineers 1,470 1,410 ‐60 ‐0.40% ‐4.10% 11.2011. Advertising & Promotions Managers 1,460 1,400 ‐60 ‐0.40% ‐4.10% 51.9011 Chemical Equipment Oprs & Tenders 4,020 3,850 ‐170 ‐0.40% ‐4.20% 21.2099 Religious Workers, All Other 1,910 1,830 ‐80 ‐0.40% ‐4.20% 21.2 Religious Workers 15,990 15,310 ‐680 ‐0.40% ‐4.30% 41.1012 Supervisors ‐ Non‐Retail Sales Workers 14,630 13,980 ‐650 ‐0.50% ‐4.40% 29.1023 Orthodontists 230 220 ‐10 ‐0.40% ‐4.40% 43.1011 Supervisors ‐ Office & Administrative Support Workers 51,800 49,460 ‐2,340 ‐0.50% ‐4.50% 43.1 Supervisors, Office & Administrative Support Workers 51,800 49,460 ‐2,340 ‐0.50% ‐4.50% 25.2031 Secondary School Teachers 48,440 46,240 ‐2,200 ‐0.50% ‐4.50% 17.2141 Mechanical Engineers 9,290 8,870 ‐420 ‐0.50% ‐4.50% 51.9197 Tire Builders 440 420 ‐20 ‐0.50% ‐4.60% 51.9081 Dental Laboratory Technicians 1,970 1,880 ‐90 ‐0.50% ‐4.60% 13.2072 Loan Officers 13,020 12,410 ‐610 ‐0.50% ‐4.70% 51.6052 Tailors, Dressmakers & Custom Sewers 1,470 1,400 ‐70 ‐0.50% ‐4.80% 49.9012 Control & Valve Installers & Repairers 830 790 ‐40 ‐0.50% ‐4.80% 27.2042 Musicians & Singers 8,930 8,500 ‐430 ‐0.50% ‐4.80% 21.2021 Directors, Religious Activities & Education 6,860 6,530 ‐330 ‐0.50% ‐4.80% 13.1021 Purchasing Agents & Buyers, Farm Products 620 590 ‐30 ‐0.50% ‐4.80% 51.9122 Painters, Transportation Equipment 1,990 1,890 ‐100 ‐0.50% ‐5.00% 51.4122 Welding, Soldering & Brazing Machine Oprs 1,560 1,480 ‐80 ‐0.50% ‐5.10% 49.2097
- Elec. Home Entertainment Equipment Installers & Repairers
1,560 1,480 ‐80 ‐0.50% ‐5.10% 51.9023 Mixing & Blending Machine Oprs 6,350 6,020 ‐330 ‐0.50% ‐5.20% 53.6011 Bridge & Lock Tenders 190 180 ‐10 ‐0.50% ‐5.30% 51.5023 Printing Machine Oprs 9,410 8,910 ‐500 ‐0.50% ‐5.30%
SLIDE 50
Occupation Code (SOC) Occupational Title 2008 Estimated Employment 2018 Projected Employment Total 2008‐2018 Employment Change Annual Avg. Percent Change Total Percent Change 51.5021 Job Printers 3,490 3,300 ‐190 ‐0.60% ‐5.40% 51.3093 Food Cooking Machine Oprs 1,840 1,740 ‐100 ‐0.60% ‐5.40% 49.9043 Maintenance Workers, Machinery 2,580 2,440 ‐140 ‐0.60% ‐5.40% 43.5071 Shipping, Receiving, & Traffic Clerks 29,050 27,480 ‐1,570 ‐0.60% ‐5.40% 43.5032 Dispatchers 6,720 6,360 ‐360 ‐0.50% ‐5.40% 27.4021 Photographers 4,600 4,350 ‐250 ‐0.60% ‐5.40% 13.1023 Purchasing Agents 13,280 12,550 ‐730 ‐0.60% ‐5.50% 43.3061 Procurement Clerks 3,510 3,310 ‐200 ‐0.60% ‐5.70% 53.7021 Crane & Tower Oprs 2,060 1,940 ‐120 ‐0.60% ‐5.80% 47.3016 Helpers ‐ Roofers 510 480 ‐30 ‐0.60% ‐5.90% 43.9031 Desktop Publishers 1,190 1,120 ‐70 ‐0.60% ‐5.90% 43.3021 Billing & Posting Clerks & Machine Oprs 23,820 22,420 ‐1,400 ‐0.60% ‐5.90% 51.4041 Machinists 20,660 19,400 ‐1,260 ‐0.60% ‐6.10% 41.9022 Real Estate Sales Agents 14,850 13,950 ‐900 ‐0.60% ‐6.10% 27.1022 Fashion Designers 330 310 ‐20 ‐0.60% ‐6.10% 27.1012 Craft Artists 330 310 ‐20 ‐0.60% ‐6.10% 53.7199 Material Moving Workers, Other 1,450 1,360 ‐90 ‐0.60% ‐6.20% 53.7072 Pump Oprs 480 450 ‐30 ‐0.60% ‐6.30% 51.9032 Cutting & Slicing Machine Oprs 2,700 2,530 ‐170 ‐0.60% ‐6.30% 17.3013 Mechanical Drafters 4,110 3,850 ‐260 ‐0.70% ‐6.30% 43.3051 Payroll & Timekeeping Clerks 9,480 8,870 ‐610 ‐0.70% ‐6.40% 51.4081 Multiple Machine Tool Oprs 5,580 5,210 ‐370 ‐0.70% ‐6.60% 49.9095 Manufactured Building & Mobile Home Installers 450 420 ‐30 ‐0.70% ‐6.70% 19.4051 Nuclear Technicians 600 560 ‐40 ‐0.70% ‐6.70% 11.1031 Legislators, Including Local Elected Officials 4,460 4,160 ‐300 ‐0.70% ‐6.70% 33.9091 Crossing Guards 5,010 4,670 ‐340 ‐0.70% ‐6.80% 53.7062 Laborers & Freight, Stock & Material Movers, Hand 110,730 103,040 ‐7,690 ‐0.70% ‐6.90% 13.1022 Wholesale & Retail Buyers 7,320 6,810 ‐510 ‐0.70% ‐7.00% 35.2019 Cooks, All Other 700 650 ‐50 ‐0.70% ‐7.10% 53.3031 Driver/Sales Workers 19,320 17,920 ‐1,400 ‐0.70% ‐7.30% 17.3023 Electrical & Electronic Engineering Technicians 7,560 7,010 ‐550 ‐0.80% ‐7.30% 47.3014 Helpers ‐ Painters, Paperhangers, Plasterers, Stucco Masons 530 490 ‐40 ‐0.80% ‐7.60% 49.9064 Watch Repairers 130 120 ‐10 ‐0.80% ‐7.70% 41.9021 Real Estate Brokers 2,740 2,530 ‐210 ‐0.80% ‐7.70% 41.9 Other Sales & Related Workers 44,480 41,030 ‐3,450 ‐0.80% ‐7.80% 27.2041 Music Directors & Composers 3,340 3,080 ‐260 ‐0.80% ‐7.80% 11.1021 General & Operations Managers 40,110 36,970 ‐3,140 ‐0.80% ‐7.80% 23.2092 Law Clerks 2,520 2,320 ‐200 ‐0.80% ‐7.90% 47.2043 Floor Sanders & Finishers 250 230 ‐20 ‐0.80% ‐8.00% 11.1 Top Executives 62,110 57,160 ‐4,950 ‐0.80% ‐8.00% 53.7051 Industrial Truck & Tractor Oprs 32,880 30,210 ‐2,670 ‐0.80% ‐8.10% 17.3019 Drafters, All Other 370 340 ‐30 ‐0.80% ‐8.10% 53.7041 Hoist & Winch Oprs 120 110 ‐10 ‐0.90% ‐8.30% 51.8013 Power Plant Oprs 2,290 2,100 ‐190 ‐0.90% ‐8.30% 53.7 Material Moving Workers 221,720 202,830 ‐18,890 ‐0.90% ‐8.50%
SLIDE 51
Occupation Code (SOC) Occupational Title 2008 Estimated Employment 2018 Projected Employment Total 2008‐2018 Employment Change Annual Avg. Percent Change Total Percent Change 51.4121 Welders, Cutters, Solderers & Brazers 18,330 16,780 ‐1,550 ‐0.90% ‐8.50% 51.4051. Metal‐Refining Furnace Oprs 2,240 2,050 ‐190 ‐0.90% ‐8.50% 51.4111 Tool & Die Makers 7,010 6,410 ‐600 ‐0.90% ‐8.60% 17.3011 Architectural & Civil Drafters 5,820 5,320 ‐500 ‐0.90% ‐8.60% 11.1011. Chief Executives 17,540 16,040 ‐1,500 ‐0.90% ‐8.60% 51.9195 Molders, Shapers, & Casters 2,500 2,280 ‐220 ‐0.90% ‐8.80% 43.5021 Couriers & Messengers 5,900 5,370 ‐530 ‐0.90% ‐9.00% 53.7111 Shuttle Car Oprs 220 200 ‐20 ‐0.90% ‐9.10% 51.2091 Fiberglass Laminators & Fabricators 330 300 ‐30 ‐0.90% ‐9.10% 49.9096 Riggers 220 200 ‐20 ‐0.90% ‐9.10% 49.9061 Camera & Photographic Equipment Repairers 110 100 ‐10 ‐0.90% ‐9.10% 43.6014 Secretaries 94,060 85,480 ‐8,580 ‐1.00% ‐9.10% 51.9198 Helpers, Production Workers 28,170 25,540 ‐2,630 ‐1.00% ‐9.30% 51.9193 Cooling & Freezing Equipment Oprs 430 390 ‐40 ‐1.00% ‐9.30% 23.2093 Title Examiners, Abstractors & Searchers 2,910 2,630 ‐280 ‐1.00% ‐9.60% 51.9041 Extruding, Forming, Pressing, & Compacting Machine Oprs 3,300 2,980 ‐320 ‐1.00% ‐9.70% 51.8091 Chemical Plant & System Oprs 2,070 1,870 ‐200 ‐1.00% ‐9.70% 43.4011 Brokerage Clerks 2,470 2,230 ‐240 ‐1.00% ‐9.70% 43.5 Material Recording, Sched., Dispatch., & Distrib. Workers 165,400 149,130 ‐16,270 ‐1.00% ‐9.80% 41.2022 Parts Salespersons 10,520 9,480 ‐1,040 ‐1.00% ‐9.90% 17.3024 Electro‐Mechanical Technicians 710 640 ‐70 ‐1.00% ‐9.90% 47.4099 Construction & Related Workers, All Other 300 270 ‐30 ‐1.00% ‐10.00% 47.2041 Carpet Installers 4,220 3,800 ‐420 ‐1.00% ‐10.00% 51.9196 Paper Goods Machine Oprs 7,050 6,310 ‐740 ‐1.10% ‐10.50% 51.9111 Packaging & Filling Machine Oprs 18,970 16,970 ‐2,000 ‐1.10% ‐10.50% 51.5 Printing Workers 19,330 17,300 ‐2,030 ‐1.10% ‐10.50% 51.4021 Extruding & Drawing Machine Oprs 5,800 5,190 ‐610 ‐1.10% ‐10.50% 51.6021 Pressers: Textile, Garment & Related Materials 1,610 1,440 ‐170 ‐1.10% ‐10.60% 43.9041 Insurance Claims & Policy Processing Clerks 12,010 10,740 ‐1,270 ‐1.10% ‐10.60% 51.9194 Etchers & Engravers 280 250 ‐30 ‐1.10% ‐10.70% 51.9 Other Production Occupations 129,980 116,110 ‐13,870 ‐1.10% ‐10.70% 51.7099 Woodworkers, Other 280 250 ‐30 ‐1.10% ‐10.70% 51.2023 Electromechanical Equipment Assemblers 2,500 2,230 ‐270 ‐1.10% ‐10.80% 51.1011 Supervisors ‐ Production & Operating Workers 30,790 27,460 ‐3,330 ‐1.10% ‐10.80% 51.1 Supervisors, Production Workers 30,790 27,460 ‐3,330 ‐1.10% ‐10.80% 51 Production Occupations 460,840 411,250 ‐49,590 ‐1.10% ‐10.80% 27.3022 Reporters & Correspondents 2,950 2,630 ‐320 ‐1.10% ‐10.90% 51.4052 Pourers & Casters, Metal 1,370 1,220 ‐150 ‐1.20% ‐11.00% 51.4061 Model Makers 630 560 ‐70 ‐1.20% ‐11.10% 51.4012 Numerical Tool & Process Control Programmers 1,170 1,040 ‐130 ‐1.20% ‐11.10% 11.3051 Industrial Production Managers 6,560 5,830 ‐730 ‐1.20% ‐11.10% 43.5051 Postal Service Clerks 3,670 3,260 ‐410 ‐1.20% ‐11.20% 53.7011 Conveyor Oprs & Tenders 1,860 1,650 ‐210 ‐1.20% ‐11.30% 51.4062 Patternmakers 530 470 ‐60 ‐1.20% ‐11.30% 43.5052 Postal Service Mail Carriers 15,730 13,960 ‐1,770 ‐1.20% ‐11.30%
SLIDE 52 Occupation Code (SOC) Occupational Title 2008 Estimated Employment 2018 Projected Employment Total 2008‐2018 Employment Change Annual Avg. Percent Change Total Percent Change 13.2071 Loan Counselors 1,150 1,020 ‐130 ‐1.20% ‐11.30% 51.4023 Rolling Machine Oprs 2,590 2,290 ‐300 ‐1.20% ‐11.60% 49.2092 Electric Motor, Power Tool, & Related Repairers 1,120 990 ‐130 ‐1.20% ‐11.60% 49.3052 Motorcycle Mechanics 940 830 ‐110 ‐1.20% ‐11.70% 27.3041 Editors 4,860 4,280 ‐580 ‐1.30% ‐11.90% 51.2092 Team Assemblers 47,090 41,400 ‐5,690 ‐1.30% ‐12.10% 51.9061 Inspectors, Testers, Sorters, Samplers, & Weighers 23,270 20,430 ‐2,840 ‐1.30% ‐12.20% 51.4 Metal Workers & Plastic Workers 117,910 103,530 ‐14,380 ‐1.30% ‐12.20% 43.5081 Stock Clerks & Order Fillers 71,810 62,890 ‐8,920 ‐1.30% ‐12.40% 11.9131 Postmasters & Mail Superintendents 1,600 1,400 ‐200 ‐1.30% ‐12.50% 31.9095 Pharmacy Aides 1,750 1,530 ‐220 ‐1.30% ‐12.60% 13.2041 Credit Analysts 2,180 1,900 ‐280 ‐1.40% ‐12.80% 51.6051. Sewers, Hand 370 320 ‐50 ‐1.40% ‐13.50% 43.9071 Office Machine Oprs 3,950 3,410 ‐540 ‐1.50% ‐13.70% 51.2099 Assemblers & Fabricators, Other 5,560 4,790 ‐770 ‐1.50% ‐13.90% 51.2041 Structural Metal Fabricators & Fitters 6,570 5,630 ‐940 ‐1.50% ‐14.30% 25.2032 Vocational Education Teachers, Secondary School 4,670 4,000 ‐670 ‐1.50% ‐14.40% 53.4013 Rail Yard Engineers, Dinkey Oprs & Hostlers 410 350 ‐60 ‐1.60% ‐14.60% 51.4191 Heat Treating Equipment Oprs 1,710 1,460 ‐250 ‐1.60% ‐14.60% 51.4193 Plating & Coating Machine Oprs 2,040 1,740 ‐300 ‐1.60% ‐14.70% 51.2 Assemblers & Fabricators 74,410 63,500 ‐10,910 ‐1.60% ‐14.70% 51.9192 Cleaning, Washing, & Metal Pickling Equipment Oprs 810 690 ‐120 ‐1.60% ‐14.80% 51.9051. Furnace, Kiln, Oven, Drier, & Kettle Oprs 1,680 1,430 ‐250 ‐1.60% ‐14.90% 51.6093 Upholsterers 1,210 1,030 ‐180 ‐1.60% ‐14.90% 25.2023 Vocational Education Teachers, Middle School 870 740 ‐130 ‐1.60% ‐14.90% 51.7042 Woodworking Machine Oprs 4,550 3,870 ‐680 ‐1.60% ‐15.00% 51.9031 Cutters & Trimmers, Hand 730 620 ‐110 ‐1.60% ‐15.10% 51.9022 Grinding & Polishing Workers, Hand 1,250 1,060 ‐190 ‐1.60% ‐15.20% 51.5012 Bookbinders 330 280 ‐50 ‐1.60% ‐15.20% 51.9191 Cementing & Gluing Machine Oprs 590 500 ‐90 ‐1.60% ‐15.30% 49.9045 Refractory Materials Repairers 260 220 ‐40 ‐1.70% ‐15.40% 27.3021 Broadcast News Analysts 130 110 ‐20 ‐1.70% ‐15.40% 51.9021 Crushing, Grinding, & Polishing Machine Oprs 2,430 2,050 ‐380 ‐1.70% ‐15.60% 51.2031 Engine & Other Machine Assemblers 1,150 970 ‐180 ‐1.70% ‐15.70% 15.1021 Computer Programmers 20,200 17,030 ‐3,170 ‐1.70% ‐15.70% 43.9021 Data Entry Keyers 13,170 11,070 ‐2,100 ‐1.70% ‐16.00% 51.9141 Semiconductor Processors 490 410 ‐80 ‐1.80% ‐16.30% 51.6 Textile, Apparel, & Furnishings Workers 26,030 21,750 ‐4,280 ‐1.80% ‐16.40% 43.2011 Switchboard Oprs 6,520 5,450 ‐1,070 ‐1.80% ‐16.40% 51.7041 Sawing Machine Oprs, Wood 2,210 1,840 ‐370 ‐1.80% ‐16.70% 43.5111 Weighers, Measurers, Checkers, & Samplers, Recordkeeping 3,330 2,770 ‐560 ‐1.80% ‐16.80% 43.9051 Mail Clerks & Mail Machine Oprs 8,750 7,270 ‐1,480 ‐1.80% ‐16.90% 49.2095
- Elec. Repairers ‐ Powerhouse, Substation, & Relay
1,120 930 ‐190 ‐1.80% ‐17.00% 53.7064 Packers & Packagers, Hand 40,200 33,280 ‐6,920 ‐1.90% ‐17.20% 51.9121 Coating, Painting & Spraying Machine Oprs 5,700 4,720 ‐980 ‐1.90% ‐17.20%
SLIDE 53
Occupation Code (SOC) Occupational Title 2008 Estimated Employment 2018 Projected Employment Total 2008‐2018 Employment Change Annual Avg. Percent Change Total Percent Change 47.2142 Paperhangers 810 670 ‐140 ‐1.90% ‐17.30% 43.9022 Word Processors & Typists 13,960 11,540 ‐2,420 ‐1.90% ‐17.30% 51.4072 Molding & Casting Machine Oprs 8,010 6,620 ‐1,390 ‐1.90% ‐17.40% 43.4199 Information & Record Clerks, All Other 5,220 4,310 ‐910 ‐1.90% ‐17.40% 53.7063 Machine Feeders & Offbearers 8,550 7,040 ‐1,510 ‐1.90% ‐17.70% 43.9199 Office & Administrative Support Workers, All Other 4,960 4,080 ‐880 ‐1.90% ‐17.70% 53.4099 Rail Transportation Workers, Other 280 230 ‐50 ‐1.90% ‐17.90% 51.7 Woodworkers 14,010 11,490 ‐2,520 ‐2.00% ‐18.00% 43.5041 Meter Readers, Utilities 1,220 1,000 ‐220 ‐2.00% ‐18.00% 25.9011 Audio‐Visual Collections Specialists 220 180 ‐40 ‐2.00% ‐18.20% 51.4033 Grinding, Lapping, Polishing & Buffing Machine Tool Oprs 5,730 4,680 ‐1,050 ‐2.00% ‐18.30% 51.8012 Power Distributors & Dispatchers 430 350 ‐80 ‐2.00% ‐18.60% 51.7021 Furniture Finishers 1,020 830 ‐190 ‐2.00% ‐18.60% 51.2093 Timing Device Assemblers, Adjusters, & Calibrators 160 130 ‐30 ‐2.10% ‐18.80% 47.2042 Floor Layers 670 540 ‐130 ‐2.10% ‐19.40% 43.5053 Postal Service Mail Sorters & Processors 8,860 7,130 ‐1,730 ‐2.10% ‐19.50% 43.4131 Loan Interviewers & Clerks 6,230 5,010 ‐1,220 ‐2.20% ‐19.60% 51.7011 Cabinetmakers & Bench Carpenters 5,720 4,590 ‐1,130 ‐2.20% ‐19.80% 43.2 Communications Equipment Operators 8,200 6,570 ‐1,630 ‐2.20% ‐19.90% 43.4041 Credit Authorizers, Checkers, & Clerks 1,590 1,270 ‐320 ‐2.20% ‐20.10% 41.9041 Telemarketers 13,040 10,410 ‐2,630 ‐2.20% ‐20.20% 51.5022 Prepress Technicians & Workers 3,220 2,560 ‐660 ‐2.30% ‐20.50% 51.4035 Milling & Planing Machine Oprs 1,680 1,330 ‐350 ‐2.30% ‐20.80% 51.4031 Cutting, Punching & Press Machine Oprs 13,290 10,530 ‐2,760 ‐2.30% ‐20.80% 51.5011 Bindery Workers 2,880 2,260 ‐620 ‐2.40% ‐21.50% 51.6091 Extruding & Forming Machine Oprs, Synthetic & Glass Fibers 1,160 910 ‐250 ‐2.40% ‐21.60% 51.4194 Tool Grinders, Filers & Sharpeners 960 750 ‐210 ‐2.40% ‐21.90% 13.2082 Tax Preparers 3,470 2,710 ‐760 ‐2.40% ‐21.90% 27.3011 Radio & Television Announcers 2,400 1,860 ‐540 ‐2.50% ‐22.50% 27.2032 Choreographers 660 510 ‐150 ‐2.50% ‐22.70% 51.4034 Lathe & Turning Machine Tool Oprs 3,710 2,860 ‐850 ‐2.60% ‐22.90% 51.4032 Drilling & Boring Machine Tool Oprs 1,500 1,150 ‐350 ‐2.60% ‐23.30% 45.4023 Log Graders & Scalers 200 150 ‐50 ‐2.80% ‐25.00% 51.4071 Foundry Mold & Coremakers 700 520 ‐180 ‐2.90% ‐25.70% 43.4141 New Accounts Clerks 2,230 1,650 ‐580 ‐3.00% ‐26.00% 43.4151 Order Clerks 12,710 9,320 ‐3,390 ‐3.10% ‐26.70% 51.2021 Coil Winders, Tapers, & Finishers 1,130 820 ‐310 ‐3.20% ‐27.40% 51.6062 Textile Cutting Machine Oprs 820 590 ‐230 ‐3.20% ‐28.10% 51.6042 Shoe Machine Oprs/Tenders 70 50 ‐20 ‐3.30% ‐28.60% 27.4013 Radio Oprs 70 50 ‐20 ‐3.30% ‐28.60% 51.4192 Lay‐Out Workers 380 270 ‐110 ‐3.40% ‐29.00% 51.2022 Electrical & Electronic Equipment Assemblers 9,270 6,510 ‐2,760 ‐3.50% ‐29.80% 51.4022 Forging Machine Oprs 2,230 1,540 ‐690 ‐3.60% ‐30.90% 51.4199 Metal Workers & Plastic Workers, Other 510 350 ‐160 ‐3.70% ‐31.40% 43.9011 Computer Oprs 4,680 3,170 ‐1,510 ‐3.80% ‐32.30%
SLIDE 54
Occupation Code (SOC) Occupational Title 2008 Estimated Employment 2018 Projected Employment Total 2008‐2018 Employment Change Annual Avg. Percent Change Total Percent Change 51.6099 Textile, Apparel, & Furnishings Workers, Other 380 250 ‐130 ‐4.10% ‐34.20% 51.6031 Sewing Machine Oprs 7,600 4,990 ‐2,610 ‐4.10% ‐34.30% 43.2021 Telephone Oprs 1,520 970 ‐550 ‐4.40% ‐36.20% 51.6061 Textile Bleaching & Dyeing Machine Oprs 320 200 ‐120 ‐4.60% ‐37.50% 51.6092 Fabric & Apparel Patternmakers 310 180 ‐130 ‐5.30% ‐41.90% 51.6064 Textile Winding, Twisting, & Drawing Out Machine Oprs 680 380 ‐300 ‐5.70% ‐44.10% 51.9131 Photographic Process Workers 430 240 ‐190 ‐5.70% ‐44.20% 51.7032 Patternmakers, Wood 200 110 ‐90 ‐5.80% ‐45.00% 43.4071 File Clerks 10,710 5,730 ‐4,980 ‐6.10% ‐46.50% 51.6063 Textile Knitting & Weaving Machine Oprs 1,340 660 ‐680 ‐6.80% ‐50.80% 51.9132 Photographic Processing Machine Oprs 2,990 1,380 ‐1,610 ‐7.40% ‐53.90%