
SLIDE 1
PROPOSED FY 20 CAPITAL IMPROVEMENT PLAN
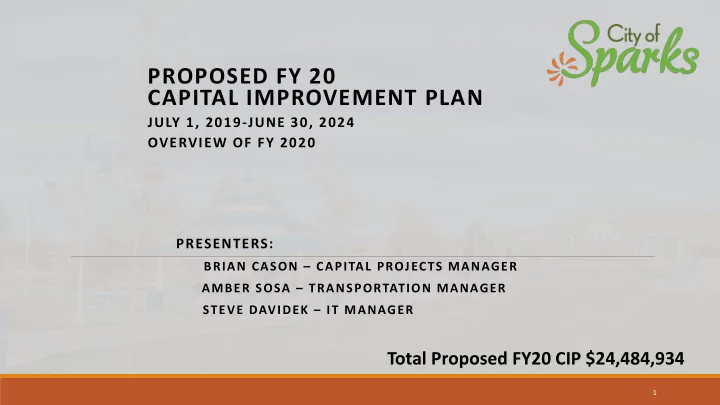
JULY 1, 2019-JUNE 30, 2024 OVERVIEW OF FY 2020 PRESENTERS:
BRIAN CASON – CAPITAL PROJECTS MANAGER AMBER SOSA – TRANSPORTATION MANAGER STEVE DAVIDEK – IT MANAGER
1
CAPITAL IMPROVEMENT PLAN JULY 1, 2019-JUNE 30, 2024 OVERVIEW OF FY - - PowerPoint PPT Presentation
PROPOSED FY 20 CAPITAL IMPROVEMENT PLAN JULY 1, 2019-JUNE 30, 2024 OVERVIEW OF FY 2020 PRESENTERS: BRIAN CASON CAPITAL PROJECTS MANAGER AMBER SOSA TRANSPORTATION MANAGER STEVE DAVIDEK IT MANAGER Total Proposed FY20 CIP $24,484,934
JULY 1, 2019-JUNE 30, 2024 OVERVIEW OF FY 2020 PRESENTERS:
BRIAN CASON – CAPITAL PROJECTS MANAGER AMBER SOSA – TRANSPORTATION MANAGER STEVE DAVIDEK – IT MANAGER
1
2
bike and pedestrian pathways”
3
“An integrated connectivity with a maintained road network which includes bike and pedestrian pathways”
bike and pedestrian pathways”
3
“A regional system of parks, natural areas and open space”
bike and pedestrian pathways”
restaurants and commercial”
3
“Victorian Square functions as a vibrant downtown with living, shopping, restaurants and commercial”
bike and pedestrian pathways”
restaurants and commercial”
infrastructure while maximizing their utilization
3
Maintain or, as necessary, upgrade the condition of City-owned facilities and infrastructure while maximizing their utilization
bike and pedestrian pathways”
restaurants and commercial”
infrastructure while maximizing their utilization
3
4
68 72 76 77 79 82 86 83 84 84 83 84 82 82 65 70 75 80 85 90 2004 2006 2008 2010 2012 2014 2016 2018 2020 PCI Year
City of Sparks PCI
Average City PCI
Funding Sources: Fuel Tax and Franchise Fees Total Cost of Transportation Projects in FY20: $3,710,818
5 86 83 84 84 83 84 82 82
65 70 75 80 85 90 2011 2013 2015 2017 2019 PCI
Year
City of Sparks PCI
Average City PCI
77 71 75 75 71 75 72 77 82 77 79 81 79 82 80 81 89 88 90 90 90 90 92 89 89 89 86 86 84 83 94 92 93 93 93 91 90 87
70 75 80 85 90 95 2011 2012 2013 2014 2015 2016 2017 2018
City of Sparks: PCI by Area
Area 1 Area 2 Area 3 Area 4 Area 5
City Wide Pavement Condition Index Trends (PCI)
5 77 71 75 75 71 75 72 77 82 77 79 81 79 82
80 81 89 88 90 90 90 90 92 89 89 89 86 86 84 83 94 92 93 93 93 91 90 87
70 75 80 85 90 95 2011 2012 2013 2014 2015 2016 2017 2018
City of Sparks: PCI by Area
Area 1 Area 2 Area 3 Area 4 Area 5
City Wide Pavement Condition Index Trends (PCI)
Total Cost - $2,080,000
6
UNIT IT 2 UN UNIT IT 3 UN UNIT IT 1
PCI = 35
Total Cost - $2,080,000
6
UNIT IT 2 UN UNIT IT 3 UN UNIT IT 1
PCI = 35 PCI = 39
Total Cost - $2,080,000
6
UNIT IT 2 UN UNIT IT 3 UN UNIT IT 1
PCI = 35 PCI = 39 PCI = 24
Total Cost - $375,000
7
PR PROJ OJEC ECT T AREA EA
(Fund 1404)
Projects/Capital Expenditures: Fund 1404A - Facilities:
Fund 1404B - IT Hardware
Fund 1404C - IT Software
Total Cost for Fund 1404A, 1404B, and 1404C in FY20: $2,976,800
8
(Fund 1404A) Funding Source: 2.5 Percent General Fund Transfer
Projects/Capital Expenditures: Facilities:
Total Cost for Fund 1404A in FY20: $2,005,000
9
Funding Sources – Fund 1404B & 1404C Per City Council Financial Policy # 3 - Annual
General Fund Transfer & contributions from
License Fees
Project Identification Hardware replacement Plan (on next slide) Major Systems Plan for replacement and
upgrades
Input from all departments and divisions Total Cost of IT Projects FY20 Fund 1404B Hardware – $471,800 Fun 1404C Major Systems - $500,000
Created as part of IT “WIG” in 2013 Standard PC – every 4 years Thin Clients for Virtual PC Users – every 6 years Engineering PC – every 3 years Monitors – every 6 years Notebooks – every 3 years Tablets – every 2 to 3 years Printers – every 6 to 7 years Servers – every 3 years Private Storage Cloud – 3 + years for drives,
System 7 to 10 years
Network Equipment – 5 years
Proposed IT CIP Budget FY20
$471,800
Refresh 1/4 of our 300 PC’s and
Notebooks
Refresh 1/3 of Police & Fire
Vehicle Computers
Refresh 1/4 of our 75 Printers Upgrade private storage cloud Add additional storage Replace PD blade Chassis & six
Blade Servers
IT Major Systems Fund 1404C Proposed Budget FY20 = $500,000
Continue Traffic Management Systems Technology
Refresh
Upgrades to Financial Systems - Time Keeping Upgrades to Employee Intranet Portal/SharePoint Accela updates (Licensing, Permits, Sewer Billing,
Inspections)
Additional enhancements to City Website Upgrade and add additional features to City data
backup system
Add Wi-Fi at Major City Buildings such as Fire HQ and
Recreation Admin Office and gym
Add fiber network to TMWRF
vendor.
are cloud based (SaaS – Software as a Service).
and Larry Johnson Community Centers and increased the speed at the Recreation Admin Office.
Fiber Optic Cable replacements City Hall to Municipal Court and Fire Headquarters
(fall 2018)
City Hall to Police Department (emergency
replacement spring 2018)
These upgrades increased data communication
speeds for data and storage
Accela Fire Prevention Inspections added February 2018 Environmental Control added April 2018 Code Enforcement Summer 2019
Microsoft 365
All city email is hosted in the “cloud” All full-time city employees have ability to use Office Products on up to 5
devices (PC, Tablets, Smartphones)
Hybrid Security System using Microsoft Azure and Local Active Directory
Windows Desktop
Moving to Windows 10 as new PC’s purchased and upgrading so that all
PC’s are on Windows 10 by January 2020.
A New Contract with Microsoft was approved by City Council this
past August.
IT worked with Microsoft, CDWG and the State to get better pricing that
saved over $30,000 annually over the next three years.
Microsoft 365
Office 365
up to 5 devices per user
Network Access License Microsoft Management Suite Microsoft Desktop Software (as we upgrade)
Currently Window 10
Microsoft 365 online only
Office 365 Online Only Access For users not assigned a PC
This does NOT include annual licensing for Server Software, nor does it
include the cost of the PC, Notebook or other Hardware
THANK YOU FOR YOUR CONTINUED SUPPORT
Funding Source: Franchise Fees & GERP Rental/Lease Fees Total Cost of Parks Projects in FY 20: $1,632,500
21
Funding Source: Franchise Fees & GERP Rental/Lease Fees Total Cost of Parks Projects in FY 20: $1,632,500
21
1 2 3 4 5 6 7 8 9 10 10 11 11 12 12 13 13 14 14 15 15
FY 20 Softball Infields 10 – 15 ($700,000)
Funding Source: Franchise Fees & GERP Rental/Lease Fees Total Cost of Parks Projects in FY 20: $1,632,500
21
1 2 3 4 5 6 7 8 9 10 10 11 11 12 12 13 13 14 14 15 15
FY 18 Field 7 & 8 - Completed FY 21 Field 9 FY 22 Fields 5 & 6 (Infields) FY 20 Softball Infields 10 – 15 ($700,000) FY 23 Fields 10, 13 & 14 (Outfields) FY 24 Fields 5 & 6 (Outfields) FY 25 Fields 11, 12 & 15 (Outfields) FY 26 Fields 1 & 4 (Complete) FY 27 Fields 2 & 3 (Complete)
(Fund 1406, 1407, 1408) Funding Source: Per NRS 278 – Residential Construction Tax
22
Burgess Tennis Court Surface
Pah Rah Dog Park $35,000 and Pah Rah Playground Turf Replac. with Tiles $275,000 Poulakidas Play Structure Replac. $135,000 Black Hills Park $450,000
(Fund 1415)
23
Section 4 Section 3 Section 6 Section 1 (Complete) FY 20 Section 2 Section 7 Section 5
Section 2 Estimated Cost - $800,000
FY 19 Section 2a
(Fund 1415)
23
Section 4 Section 3 Section 6 Section 1 (Complete) FY 20 Section 2 Section 7 Section 5
Section 2 Estimated Cost - $800,000
FY 19 Section 2a
(Fund 1203) – Low to Moderate Income ≥ 51%
24
(Fund 1600’s) Funding Source: Sewer/Storm user fees & Connection fees
(City of Sparks Share)
25
(Fund 1600’s) Funding Source: Sewer/Storm user fees & Connection fees
(City of Sparks Share)
25
(Fund 1600’s) Funding Source: Sewer/Storm user fees & Connection fees
(City of Sparks Share)
25
(Fund 1702) Funding Source: All Departments & Funds Pay Cost Recovery on Vehicles and Equipment
26
27