
SLIDE 1
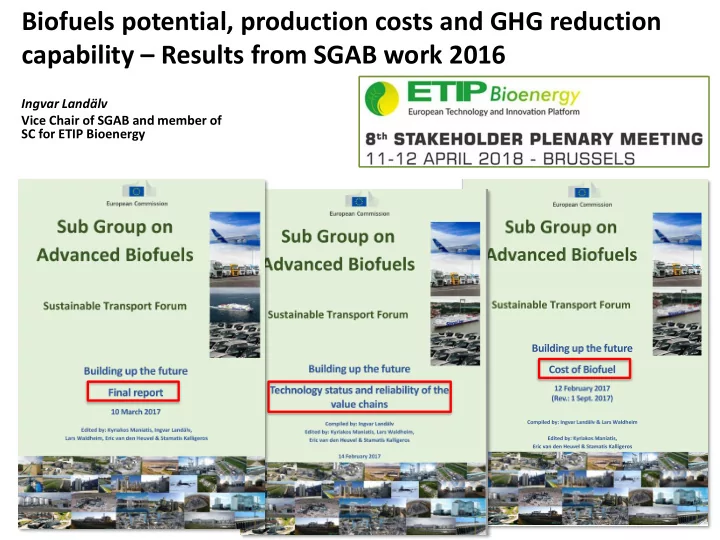
Biofuels potential, production costs and GHG reduction capability – Results from SGAB work 2016
Ingvar Landälv Vice Chair of SGAB and member of SC for ETIP Bioenergy
capability Results from SGAB work 2016 Ingvar Landlv Vice Chair of - - PowerPoint PPT Presentation
Biofuels potential, production costs and GHG reduction capability Results from SGAB work 2016 Ingvar Landlv Vice Chair of SGAB and member of SC for ETIP Bioenergy Agenda Background: Infrastructure Directive 2014/94/EU ==> STF,
Ingvar Landälv Vice Chair of SGAB and member of SC for ETIP Bioenergy
12 April 2018 - SPM#8 Ingvar Landälv 2
Presentation by V. Bulc: Note the emphasis on “Decarbonisation”
12 April 2018 - SPM#8 Ingvar Landälv 3
12 April 2018 - SPM#8 Ingvar Landälv 4
SET Plan (RTD/ENER) SET plan Update EBTP (RTD) => ETIP Bioenergy (RTD)
RED II Sustainable Trspt Forum
(MOVE/ENER/KLIMA/RTD)
ART Fuels Forum (ENER)
(Also: Directive 2014/94/EU => STF => SGAB)
12 April 2018 - SPM#8 Ingvar Landälv 5
Directorate General (DG) RTD: Research & Innovation MOVE: Mobility and Transport ENER: Energy CLIMA: Climate Action
Infrastructure Directive 2014/94/EU
1 Aho Mika ST1 2 Bauen Ausilio E4Tech 3 Brown Adam IEA 4 Cavigliasso Piero Mossi & Ghisolfi 5 Dekker Eelco Methanol Institute 6 Gameson Tom ABENGOA 7 Gaupmann Gloria Clariant 8 Girio Francisco LNEG 9 Greening Paul ACEA 10 Hamje Heather Concawe 11 Harrison Pete EU Climate Foundation 12 Holmgren Jennifer Lanzatech 13 Hudson Leigh British Airways 14 Hull Angelica Swedish Biofuels 15 Janhunen Marko UPM 16 Judd Robert GERG 17 Klintbom Patrik VOLVO 18 Labrie Marie- Helene ENERKEM 19 Landälv Ingvar Lulea University of Technology 20 Lastikka Ilmari NESTE oil 21 Malins Chris The International Council on Clean Transportation 22 Marchand Philippe Total 23 Mirabella Walter European Fuel Oxygenates Association 24 Murfin Andrew Shell 25 Schapers Eline SkyNRG 26 Sipila Kai VTT 27 Stefenson Per Stena Lines 28 Stępień Adam Copa-Cogeca 29 Strömberg Jonas SCANIA 30 van Campen Jeroen DuPont 31 Venendaal René BTG 32 Vink Tim Honeywell/UOP 33 Wellinger Arthur EBA 34 Zschocke Alexander Lufthansa
SGAB Core Team
Chair: Kyriakos Maniatis, DG ENER Rapporteurs: Lars Waldheim Co-Chair: Ingvar Landälv, Luleå Univ. Eric van den Heuvel Stamatis Kalligeros
12 April 2018 - SPM#8 Ingvar Landälv 6
Interest Group Numbers Technology providers 12 Oil companies 3 Airlines 2 Industry associates 7 Heavy duty transports 2 Maritime transport 1 Consultants 4 IEA 1 Think tanks 2 TOTAL 34
12 April 2018 - SPM#8 Ingvar Landälv 7
1 Bach Heinz Austria 2 Bernodusson Jón The Icelandic Transport Authority Iceland 3 Buffet Laura Transport & Environment NGO 4 Cluyts Ivo Ministry of Environment Belgium 5 Desplechin Emmanuel ePure European Association 6 Florea Leonard Regulatory Authority for Energy Romania 7 Garofalo Raffaello EBB European Association 8 Gruson Jean- François IFP Energies nouvelles France 9 Hameau Thierry SNCF France 10 Leahy Patrick Department of Transport UK 11 Neeft John Netherlands Enetrprise Agency The Netherlands 12 Nicolau Alexandra General Directorate for Energy & Geology Portugal 13 Pezzaglia Marco Consultant, Italian Ministry of Economic Development Italy 14 Pinheiro Sérgio Manso General Directorate for Energy & Geology Portugal 15 Stausbøll Yvonne UPEI Association 16 Weber Thomas Federal Ministry for the Environment Germany
12 April 2018 - SPM#8 Ingvar Landälv 8
12 April 2018 - SPM#8 Ingvar Landälv 9
(see: http://www.etipbioenergy.eu/value-chains/conversion- technologies/advanced-technologies )
12 April 2018 - SPM#8 Ingvar Landälv 10
WC 1 WC 2 WC 5 & 6
(not covered by ETIP Bioenergy’s 7 Value Chains)
12 April 2018 - SPM#8 Ingvar Landälv 11
ELECTROFUELS BIO-METHANE VIA FERMENTATION HYDROTREATED VEGETABLE OILS (HVO)
A short description with name, location and background and list of key technologies utilized in the plant. The information provider was asked also to classify the plant as a Pilot plant (P), a Demonstration plant (D) or a Commercial plant (C). Finally, the following additional points were also addressed: 1. Start-up year – plus current status 2. Plant size expressed as feedstock consumption e.g. as ton dry biomass/day or MW Lower Heating Value (LHV) including other important feeds/utilities such as electric power. 3. Plant product capacity expressed as ton/day, m3/day, Nm3/h of product
4. Efficiency number, e.g. tons of product per ton of dry biomass or MWout/MWin. should be able to be calculated from item 2 and 3 - status 5. Number of hours of operation since start-up (comment length of continuous operation or similar) – reliability description 6. Next step (e.g. first full sized plant planned for start-up in year 20xx) – status 7. Comment potential technology barriers or potential show-stoppers
12 April 2018 - SPM#8 Ingvar Landälv 12
12 April 2018 - SPM#8 Ingvar Landälv 13
12 April 2018 - SPM#8 Ingvar Landälv 14
12 April 2018 - SPM#8 Ingvar Landälv 15
Source: Figure 1 in BIOFRONTIERS, Responsible innovation for tomorrow’s liquid fuels, 2016
(NOTE: 2SBiom report not referred to in SGAB report)
12 April 2018 - SPM#8 Ingvar Landälv 16
1422 567 855
Source: Figure 2 in Vision for 1 billion dry tons lignocellulosic biomass as a contribution to bio-based economy by 2030 in Europe. Nov 2016 * Other reports with similar potentail referred to in SGAB report
12 April 2018 - SPM#8 Ingvar Landälv 17
Variable Unit BIOFRONTIERS 2016 S2Biom 2016 Biomass Million dry tons/year 140 775
Million toe/year 20 113
Million toe/year 29 161
Million toe/year 35 194
in the order of 15-50% of currently used fossil fuels in the transport sector and still have resources available for other sectors.
reviewing the matter over and over the interests and initiatives among developers vanish.
Construction and operation of plants will lead to new innovative schemes and process combinations which will lead to smarter use of feedstock.
in course. A parallel food for though: Should society wait to start along the electromobility pathway because 100% market penetration cannot be reached with today’s battery solutions?
12 April 2018 - SPM#8 Ingvar Landälv 18
12 April 2018 - SPM#8 Ingvar Landälv 19
From: A Roadmap for moving to a competitive low carbon economy in 2050, COM(2011) 112 final.
12 April 2018 - SPM#8 Ingvar Landälv 20
(EU target vs current trend)
12 April 2018 - SPM#8 Ingvar Landälv 21
12 April 2018 - SPM#8 Ingvar Landälv 22
12 April 2018 - SPM#8 Ingvar Landälv 23
(relate to previous figure)
There are some lower data points but to initiate construction of First of kind plants (FOAKs) the quoted interval is realistic.
higher than their crude oil based alternatives (70-90 EUR/MWh compared to about 45 EUR/MWh).
lowered due to increased experience. This however implies that construction
cost reduction of about 15%.
increase in gasoline and diesel process are also indicated.
cost of biofuels and the (assumed) price of fossil fuels.
12 April 2018 - SPM#8 Ingvar Landälv 24
12 April 2018 - SPM#8 Ingvar Landälv 25
(From PennEnergy Feb 24, 2016)
Source: http://www.pennenergy.com/marketwired-power/2016/02/24/ raizen-has-lowest-price-as-cellulosic-ethanol-hinges-on-feedstock-cost.html 2 USD/gal 4 USD/gal 80 EUR/MWh 160 EUR/MWh 30 November 2017 Ingvar Landälv 26
~8EUR/ MWh ~16 EUR/ MWh
Feedstock price
(Source: Blomberg’s Cellulosic ethanol costs: Surveying an industry, March 2013)
USD/lit
150 EUR /MWh 75 EUR /MWh
Capital: 10% WACC Feedstock: 75 USD/mt (dry) ~ 13 EUR/MWh
30 November 2017 Ingvar Landälv 27
30 November 2017 Ingvar Landälv 28
World production 2017
12 April 2018 - SPM#8 Ingvar Landälv 29
2Anaerobe Digestion
(large span due to very different feedstock costs)
40 50 60 70 80 90 100 110 120 130 10 20 30
EUR/ MWh1
FT MeOH/ DME Biomethane via gasification
~ Historic crude oil price
Crude at 50 USD/bbl Gasoline/diesel ~ 0.4 €/liter
1(EUR / MWh)/3.6 = €/GJ
Typical Lignocellulosic Biomass price Cellulosic EtOH Fuels for aviation HVO Biomethane via A.D.2
140 150 160 170
Original data Chapter 2 Adjusted by SGAB
HVO base Sugar And FT base Co-processing Stand alone Via Pyrolysis
HC fuels UCOME
100 EUR/MWh approx. 3.75 USD/gal g.e. Biomass: 50-100 EUR/dry metric ton Capital: 10% / 15 years
O&M: % of total investment per year. Varies
12 April 2018 - SPM#8 Ingvar Landälv 30
2Anaerobe Digestion
(large span due to very different feedstock costs)
40 50 60 70 80 90 100 110 120 130 10 20 30
EUR/ MWh1
FT MeOH/ DME Biomethane via gasification
~ Historic crude oil price
Crude at 50 USD/bbl Gasoline/diesel ~ 0.4 €/liter
1(EUR / MWh)/3.6 = €/GJ
Typical Lignocellulosic Biomass price Cellulosic EtOH Fuels for aviation HVO Biomethane via A.D.2
140 150 160 170
Original data Chapter 2 Adjusted by SGAB
HVO base Sugar And FT base Co-processing Stand alone Via Pyrolysis
HC fuels UCOME
100 EUR/MWh approx. 3.75 USD/gal g.e. Biomass: 50-100 EUR/dry metric ton Capital: 10% / 15 years
O&M: % of total investment per year. Varies
Feedstock cost reduction from 20 to 13 EUR/MWh Lower return on capital (9.5% instead of 13.3%)
Gasoline/diesel April 2018
Biofuel type production costs Feedstock price EUR/MWh Production cost range EUR/MWh Production cost range EUR/GJ Aviation HEFA 40-60 80-90 22-25 Aviation: Sugar fermentation FT synthesis Sugar: 65-85 FT: 10-20 110-140 31-39 HVO liquids (and approx. UCO) 40 50-70 14-19 60 70-90 19-25 Biomethane from biogas 0-80 40-120 11-34 Cellulosic ethanol 13 103 29 10 85 24 Biomethane & ethanol from waste (1) 67-87 19-24 FT liquids from wood 20 105-139 29-35 10-15 90-105 25-29 Biomethane, methanol or DME (Dimethyl Ether) from wood 20 71-91 20-25 10-15 56-75 16-21 Pyrolysis bio-oil co-processing 10-20 58-104 14-27 Pyrolysis bio-oil stand alone 10-20 83-118 23-33
([1]) Base: Net tipping fee of 55 EUR/ton, energy content of 4.4 MWh/ton, Conversion efficiency of 50%
12 April 2018 - SPM#8 Ingvar Landälv 31
1000 EUR/kW 67 000 USD/bbl gasoline equiv.
12 April 2018 - SPM#8 Ingvar Landälv 32
VIA FERMENTATION & ANAEROB DIGESTION
100 200 60-80 200
MW(LHV) of product
200 65
Domsjö, BLG Six plants in
Bloomberg 2016 2013
00 1000 2000 3000 4000
EUR / kW of product
5000
HVO
Stand alone Integrated
120- 1200 300
Methanol/DME (BLG) Average BLG
1-20
Biomethane from biogas Biomethane & Methanol/DME FT products Cellulosic Ethanol
VIA GASIFICATION Co-processing Stand alone Via Pyrolysis Oil to Hydrocarbons
30-60 270
UCOME
Greenfield Revamp
70- 250
Biofuels will remain more expensive than fossil fuels unless the costs of mitigating climate change are going to be factored in the cost of fossil fuels. Some few conversion routes can compete today and some others are getting close if cost of capital and feedstock costs are decreased.
(feedstock) and cost of capital (the investment) and only value chains based on waste streams with zero or negative cost offer possibilities for competitive cost production at present. Commercially available biofuels
digestion) has at present the lowest cost at about 40-50 €/MWh. In certain niche markets it can be competitive to fossil fuels.
50-90 €/MWh subject to the cost of the feedstock.
Cellulosic ethanol at the stage of early commercialisation
110 €/MWh (subject to low feedstock costs). Biofuels in the stage of first of a kind (FOAK)
gasification have a production cost of 60-80 €MWh.
12 April 2018 - SPM#8 Ingvar Landälv 33
12 April 2018 - SPM#8 Ingvar Landälv 34
*All reports will be possible to downloaded from the EU website within short
12 April 2018 - SPM#8 Ingvar Landälv 35
Ingvar Landälv 35
SET Plan (RTD/ENER) SET plan Update EBTP (RTD) => ETIP Bioenergy (RTD)
RED II Sustainable Trspt Forum
(MOVE/ENER/KLIMA/RTD)
ART Fuels Forum (ENER)
Co-author Lars Waldheim, Waldheim Consulting
Financial support to my work by