Calculation of the Effect of Temperature and Xenon Gas on the Defect - - PDF document

calculation of the effect of temperature and xenon gas on
SMART_READER_LITE
LIVE PREVIEW

Calculation of the Effect of Temperature and Xenon Gas on the Defect - - PDF document

Transactions of the Korean Nuclear Society Virtual Spring Meeting July 9-10, 2020 Calculation of the Effect of Temperature and Xenon Gas on the Defect Formation in Irradiated UO 2 Using Molecular Dynamics Simulation Hakjun Lee a , Ho Jin Ryu a* a


slide-1
SLIDE 1

Calculation of the Effect of Temperature and Xenon Gas on the Defect Formation in Irradiated UO2 Using Molecular Dynamics Simulation

Hakjun Leea, Ho Jin Ryua*

a Department of Nuclear and Quantum Engineering, KAIST, Yuseong-gu, Daejeon 34141, Republic of Korea

*corresponding author: hojinryu@kaist.ac.kr

  • 1. Introduction

Nowadays, Uranium Dioxide (UO2) is widely used as a main fuel material for Light Water Reactors (LWR). Along with nuclear fission, fission products are accumulated in the UO2 matrix. The amount of fission product elements varies with the irradiation conditions, but the cumulative fission yield data suggest that Cesium (Cs), Iodine(I), Xenon (Xe), Molybdenum (Mo), Strontium (Sr) and Niobium (Nb) are the main fission product elements.[1] Among them, Xe is the richest gas element that is associated with the fuel swelling and degradation by forming bubbles inside the UO2 microstructure.[2] While the swelling behavior and Xe bubble nucleation have been studied,[3- 7] computational studies on the defect formation and radiation resistance behavior of UO2 focused on the pure UO2 system.[5][6] The Threshold Displacement Energy (TDE, Ed) is an essential quantity for assessing the radiation resistance of a given material. Basically, Ed is a minimum kinetic energy given for an atom in the lattice to escape its

  • riginal position and form a stable point defect.[8-10]

Therefore, it is well known that the number of stable point defects formed is proportional to the initial kinetic energy given to Primary Knock-on Atom (PKA) and inversely proportional to the Ed, as described by Norgett et al.[8] Several methods were applied to investigate the Ed. Bauer and Sosin [7] experimentally measured the Ed of metals by shooting electrons directly into metals. However, this TEM method was unsuccessful due to the uncontrollable factors such as sample inhomogeneity, lattice imperfections and sensitivities, resulting in a large deviation of the detected values. For UO2, Soullard [9] reported the approximated Ed value of Uranium PKA of about 40eV by the TEM method. However, the methodology of investigating microscopic energy values faced a new era with the development of computer and computational material science. Computational methods such as Molecular Dynamics (MD) or Density Functional Theory (DFT) emerged, and several researchers have already studied about irradiation simulation with UO2 system. [5][6] However, those studies focused on pure UO2 microstructure regardless

  • f impurities.

In this work, a repetitive PKA simulation is applied to the fluorite UO2 microstructure to investigate the influence of Xe atoms inserted in the UO2 supercell by using MD simulation. The Ed of UO2 system with different conditions (Temperature or existence of Xenon) is calculated, while the formation and annihilation of point defects under different conditions are investigated.

  • 2. Methods

MD simulations were performed via Large-scale Atomic/Molecular Massively Parallel Simulator (LAMMPS) developed by Sandia National Laboratory. Details and methodologies are described in this section. 2.1 Interatomic Potential In this simulation, an EAM interatomic potential function made by Cooper et al. [10] was used as a base function because it successfully describes the interaction between ceramic oxides including UO2 and fission gases (Xe, Kr), validated by trapping energy calculation. Together with the Cooper potential, Ziegler-Biersack- Littmark (ZBL) functional was used to as a spline due to its suitability on collision-related interactions at a short

  • range. The ZBL spline range of each interaction (U-U,

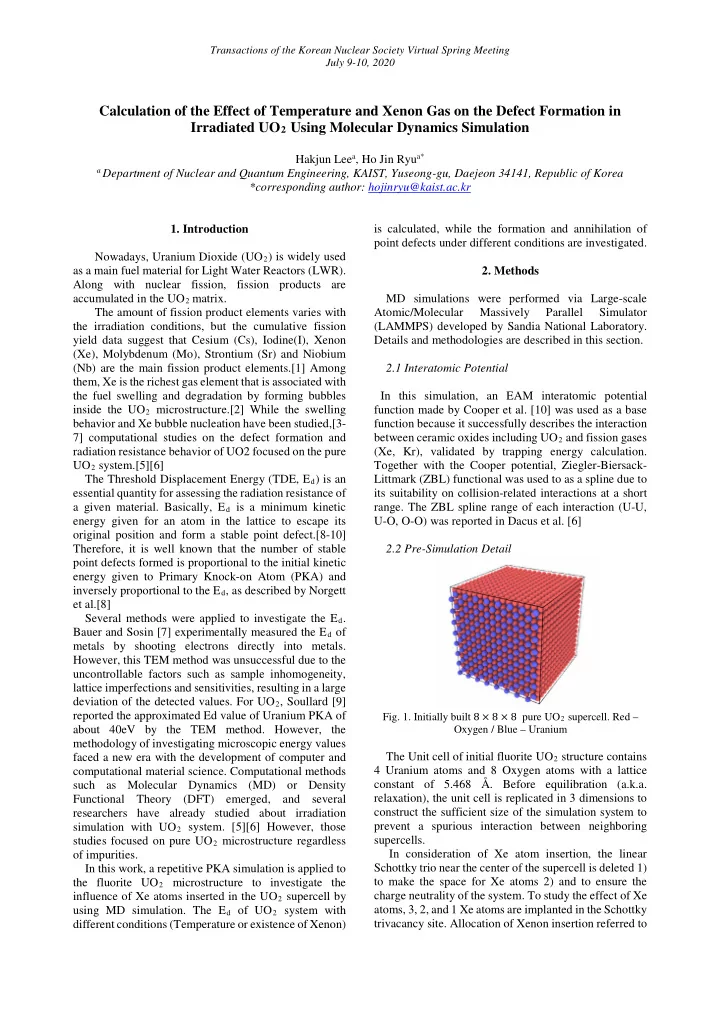
U-O, O-O) was reported in Dacus et al. [6] 2.2 Pre-Simulation Detail

  • Fig. 1. Initially built 8 × 8 × 8 pure UO2 supercell. Red –

Oxygen / Blue – Uranium

The Unit cell of initial fluorite UO2 structure contains 4 Uranium atoms and 8 Oxygen atoms with a lattice constant of 5.468 Å. Before equilibration (a.k.a. relaxation), the unit cell is replicated in 3 dimensions to construct the sufficient size of the simulation system to prevent a spurious interaction between neighboring supercells. In consideration of Xe atom insertion, the linear Schottky trio near the center of the supercell is deleted 1) to make the space for Xe atoms 2) and to ensure the charge neutrality of the system. To study the effect of Xe atoms, 3, 2, and 1 Xe atoms are implanted in the Schottky trivacancy site. Allocation of Xenon insertion referred to

Transactions of the Korean Nuclear Society Virtual Spring Meeting July 9-10, 2020

slide-2
SLIDE 2

previous research. Matzke et al. [11] introduced that the diffusion of Xe atoms normally occurs in Schottky trivacancy in the UO2 system. Geng et al. [12] investigated that Xe insertion in (111) direction is the most stable form for Xe implant in UO2 trivacancy.

  • Fig. 2. Initial 8×8×8 3-Xe-inserted UO2 Supercell

Xenon expressed by Yellow Atoms Supercell is sliced to show the central part (left)

The initialized supercell is placed under Nose-Hoover style isothermal-isobaric ensemble (NPT ensemble) and equilibrated at a target temperature for 50 picoseconds(ps), with a single timestep

  • f

2 femtoseconds(fs). The target equilibration temperature for pure UO2 supercell is 300K, 600K and 1200K, and

  • nly 1200K for Xe-inserted UO2 supercell.

2.3 Selection of PKA Direction Vectors Chen et al. [13] suggested that some of the crystallographic directions reveal local minima of Ed and identifies the directions to defect channeling directions. Due to the dependency between the PKA direction and defect formation behavior, the PKA direction must be taken into account. PKA directions that target the actual radiation events in the UO2 fuel grid must have an even distribution on a unit sphere. However, a perfectly even distribution of the direction vectors is practically impossible due to the limited computing power. Alternatively, Robinson et al. [8] suggested Thompson’s Problem solution vectors with large N can successfully represent the uniform directional

  • distribution. In this study, N=40 solution vectors for the

pseudo-uniform PKA direction selection were adopted. For each direction, 20 times of repeats are tried by varying the random seed of the velocity generation algorithm in LAMMPS. 2.4 PKA Simulation

  • Fig. 3. PKA Simulation Slice Snapshot at

(a) The Beginning (b) Right After the Beginning (c) The Secondary Collision

After the system is equilibrated at the target temperature, PKA energy is given to the Uranium PKA in the form of velocity vector that is a multiple of norm and unit direction vector chosen in 2.3. For the collisional condition, the system is set in the microcanonical (NVE)

  • ensemble. A single timestep is 1fs, which is small enough

to avoid atomic overlap. The formation of a point defect is assessed using a Voronoi Tessellation algorithm (a.k.a. Wigner-Seitz Analysis) in the LAMMPS system. Point defects that are still alive after 5000 timestep (5ps) are considered “stable Frenkel pair”. Hence, with regard to the individual temperature, PKA Uranium and PKA Energy, 800 repetitive simulations (40 directions and 20 repetitions per direction) are carried out and the formation of the stable Frenkel pair is checked.

  • 3. Results and Discussion

3.1 Stoichiometric UO2 supercell As discussed in 2.4, the existence of a Frenkel pair is assessed at 5ps after the PKA event. As a result, Stable Frenkel Pair Formation Probability (Pform) is calculated using the result from 800 repetitive calculations.

  • Fig. 4. PKA Energy - Pform graph of Uranium PKA in

stoichiometric UO2 supercell

According to the linear interpolation based on Fig. 5, Ed of Uranium PKA at 300K, 600K and 1200K pure UO2 supercell is approximated in Table 1.

Transactions of the Korean Nuclear Society Virtual Spring Meeting July 9-10, 2020

slide-3
SLIDE 3

Table 1: TDE of Uranium and Oxygen in UO2, Reference and this work

From the calculation operated in this study, it appears that Pform has a strong positive correlation with temperature. There are previous studies which mentioned temperature as a parameter for stable Frenkel pair formation. E. Chen. [13] stated that an increase in temperature leads to a weakening of the lattice bond with a high probability of defect formation in alpha and gamma uranium systems. In contrast, Beeler et al. [14] explained about the temperature-induced negative correlation with Pform of the bcc iron system due to the acceleration of diffusion and recombination of point defects. From the references above, the temperature effect seems that a stable defect formation mechanism contains 2-steps of ‘PKA penetrating lattice and forming Frenkel pairs’ and ‘Delaying of Frenkel pair recombination’. 3.2 Xe-inserted UO2 supercell In the pure UO2 system, the selection of PKA Uranium is not important because the surrounding lattice geometry of each uranium atom is identical. However, the Uranium atoms in the Xe-inserted UO2 supercell do not have the identical relative geometry. Therefore, Pform curve and Ed of each PKA are individually different.

Table 2: Calculated Uranium PKA Ed of triplet-Xe inserted UO2 system (1200K)

14 PKAs were selected. The fact that there were 2,047 U atoms in this system made it difficult and time- consuming to calculate the average Ed of Uranium in the UO2 system. Thus, this study applied a linear interpolation scheme in MATLABTM to interpolate the Ed of every U atom in the system.

  • Fig. 5. 3D Scatter Plot of Uranium Ed in triplet-Xe inserted

UO2 system

The identical procedure was operated to calculate the duplet-Xe inserted and single-Xe inserted UO2 system. As shown in Fig. 5, Ed of Uranium atoms are reduced in the Xe-inserted UO2 systems. This tendency increased with an increasing number of Xe atoms in Schottky

  • trivacancy. In order to analyze this tendency, temporal

number of Frenkel pairs in two systems with identical temperature (1200K) and PKA energy (50eV) is plotted in Fig. 6.

  • Fig. 6. Time - Average Number of Frenkel Pair Graph for

Pure & Triplet-Xe inserted cell (PKA 5)

The comparison in Fig 3.14 show that the presence

  • f Xe in the UO2 has only a minor influence on the initial

stage of defect formation. However, Xe atoms seem to interfere with the recombination of the Frenkel pairs after 1 ps. The mechanism of the recombination disturbance is currently unclear. However, regarding the Frenkel pair recombination process as a stochastic and thermal micro process, it is natural to assume that the energetic pathway from the Frenkel pair to the recombined perfect lattice state is disturbed. In other words, the level of the

Source Evaluation Method System Temperature (K) Ed (eV) Dacus et al. [9] MD, PKA Simulation 1500 60~65 Meis et al. [8] DFT, Sudden Approximation Calculation Very Low T 50 Soullard et al. [13] TEM (Electron Beam Experiment) 300 40~50 This work MD, PKA Simulation 300 65~70 (69) 600 65~70 (67) 1200 60~65 (62)

Distance in Å dist(Xe1) dist(Xe2) dist(Xe3) Ed(eV) PKA 1 4.947 3.913 4.895 25.8 PKA 2 2.683 4.400 7.079 12.1 PKA 3 4.144 6.787 9.778 36.4 PKA 4 6.879 8.685 11.116 51.7 PKA in Pure UO2 ∞ ∞ ∞ 62.0 PKA 5 10.237 12.232 14.838 54.5 PKA 6 4.915 4.060 5.263 26.0 PKA 7 8.492 6.642 6.154 31.1 PKA 8 10.241 8.880 8.342 50.5 PKA 9 6.680 4.096 2.778 12.1 PKA 10 13.209 11.321 9.670 52.9 PKA 11 18.554 16.715 14.939 58.3 PKA 12 10.452 7.843 5.713 44.0 PKA 13 32.461 29.651 26.652 59.9 PKA 14 37.295 37.973 39.296 60.5

1000 2000 3000 4000 5000 1 2 3 4

Average Number of Frenkel Pairs Time (fs) Triplet-Xe inserted, PKA5 Pure

Transactions of the Korean Nuclear Society Virtual Spring Meeting July 9-10, 2020

slide-4
SLIDE 4

Minimum Energy Path (MEP) may have changed due to the presence of the Xe atoms.

  • 4. Conclusions

Ed is one of the most important key parameters for understanding the radiation resistance and point defect formation of an irradiated material. The formation of point defects and Ed of the pure and Xe-inserted UO2 system was investigated by PKA simulation calculations using LAMMPS. From the analysis of the result of temporal defect formation, the point defect formation was divided into two processes: 1) Initial displacement

  • f PKA making Frenkel pairs and 2) Frenkel Pair

recombination by movement of the atoms. The temperature rise strongly activates both processes, and depends on the material and temperature range, dominating process can be different. If the effect of 1) dominates, the Pform increases and Ed decreases as shown in this study and E. Chen [7]. It is simulated that the presence of Xe atoms retard Frenkel pair by increasing the energy barrier of the Frenkel pair recombination path. ACKNOWLEDGMENTS This study was supported by the National Research Foundation of Korea (NRF-2018M2A8A1083889). REFERENCES [1]

  • H. Of and D. Extensions, “INDC International

Nuclear Data Committee HANDBOOK OF NUCLEAR DATA FOR SAFEGUARDS :,” Database, no. August, 2008. [2]

  • G. Rossiter and M. Mignanelli, “The

characteristics of LWR fuel at high burnup and their relevance to AGR spent fuel,” Natl. Nucl. Lab., vol. (10) 10930, no. 1, pp. 1–60, 2010. [3]

  • S. T. Murphy, P. Fossati, and R. W. Grimes,

“Xe diffusion and bubble nucleation around edge dislocations in UO2,” J. Nucl. Mater., vol. 466, pp. 634–637, 2015. [4]

  • E. Moore, L. René Corrales, T. Desai, and R.

Devanathan, “Molecular dynamics simulation

  • f Xe bubble nucleation in nanocrystalline UO2

nuclear fuel,” J. Nucl. Mater., vol. 419, no. 1–3,

  • pp. 140–144, 2011.

[5]

  • C. Meis and A. Chartier, “Calculation of the

threshold displacement energies in UO2 using ionic potentials,” J. Nucl. Mater., vol. 341, no. 1, pp. 25–30, 2005. [6]

  • B. Dacus, B. Beeler, and D. Schwen,

“Calculation of threshold displacement energies in UO 2,” J. Nucl. Mater., vol. 520, pp. 152– 164, 2019. [7]

  • W. Bauer and A. Sosin, “Evaluation and

interpretation of threshold displacement energy measurements,” J. Appl. Phys., vol. 37, no. 4,

  • pp. 1780–1787, 1966.

[8]

  • M. I. Norgett and M. T. Robinson, “Nuclear

engineering and design 33 (1975j 50-34. o north-holland publishing company a proposed method of calculating displacement dose rates m.i. norgett,” Nucl. Eng. Des., vol. 33, pp. 50– 54, 1975. [9]

  • J. Soullard, “High voltage electron microscope
  • bservations of UO 2,” J. Nucl. Mater., vol.

135, no. 2–3, pp. 190–196, 1985. [10]

  • M. W. D. Cooper et al., “Development of Xe

and Kr empirical potentials for CeO2, ThO2, UO2 and PuO2, combining DFT with high temperature MD,” J. Phys. Condens. Matter,

  • vol. 28, no. 40, 2016.

[11]

  • H. Matzke, “ Diffusion in Doped UO 2 ,” Nucl.

Appl., 1966. [12]

  • H. Y. Geng, Y. Chen, Y. Kaneta, and M.

Kinoshita, “Molecular dynamics study on planar clustering of xenon in UO2,” J. Alloys Compd., vol. 457, no. 1–2, pp. 465–471, 2008. [13]

  • E. Y. Chen, C. Deo, and R. Dingreville,

“Atomistic simulations of temperature and direction dependent threshold displacement energies in α- and γ-uranium,” Comput. Mater. Sci., vol. 157, no. May 2018, pp. 75–86, 2019. [14]

  • B. Beeler, M. Asta, P. Hosemann, and N.

Grønbech-Jensen, “Effect of strain and temperature on the threshold displacement energy in body-centered cubic iron,” J. Nucl. Mater., vol. 474, pp. 113–119, 2016.

Transactions of the Korean Nuclear Society Virtual Spring Meeting July 9-10, 2020