
SLIDE 1
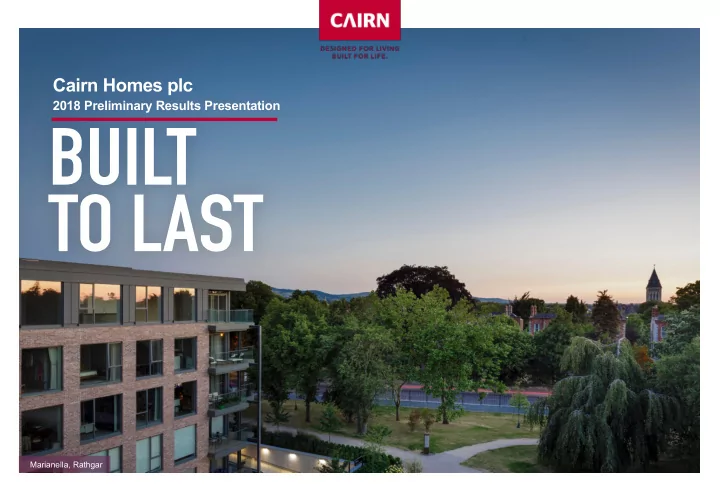
Cairn Homes plc
2018 Preliminary Results Presentation
Marianella, Rathgar
Cairn Homes plc 2018 Preliminary Results Presentation Marianella, - - PowerPoint PPT Presentation
Cairn Homes plc 2018 Preliminary Results Presentation Marianella, Rathgar 2018 Preliminary Results Presentation Table of Contents Page Michael Stanley Chief Executive Officer & Co-Founder 01 Highlights 02 02 Financial 09 Tim Kenny
2018 Preliminary Results Presentation
Marianella, Rathgar
1
Michael Stanley
Chief Executive Officer & Co-Founder
Tim Kenny
Group Finance Director
Declan Murray
Head of Investor Relations
Highlights
02
Financial
09
Land Bank
13
Operations
18
Outlook
25
Appendices
27 Page
Parkside, Dublin
3
Sales Units
ASPs
Revenue
Houses Apartments Overall
2018 804 €323k €505k €366k €294.2m 2017 418 €286k €552k €315k €131.5m 2019 – closed and forward sales 471 €322k €714k €428k €201.4m
Note: All ASPs are exclusive of VAT
Intention to announce a first interim ordinary dividend of 2.5 cent per share in September 2019
Revenue
(2017: €149.5m)
Net Debt
(2017: €159.4m)
Inventories
(2017: €911.5m)
Operating Cash Flow
(2017: cash outflow €128.6m)
Adjusted EPS
(2017: 0.7 cent)
Operating profit
(2017: €14.5m)
Gross profit / Gross margin
(2017: €27.1m / 18.2%)
4
Enhancing Inherent Land Value
2,106 units – granted planning in 2018 Total planning gains – 3,000 units 15,100 unit land bank
Mature Business
Active on 13 sites - c. 4,750 homes 5 upcoming site commencements, including 4 large-scale multifamily PRS sites Talented and experienced homebuilding team
Quality and Location Driving Sales Demand
Selling on 9 sites - 5 sales launches planned Strong sales rates - 2.8 units per active site per week House price inflation c. 4.5%
Cash Generation
Significant free cash flow and €550m share premium conversion underpinning capital returns First dividend in September 2019 Land bank to normalise to c. 6-7 year supply
Operational Efficiencies
Procurement advantage through scale Established subcontractor base Off-site manufacturing 2.75% build cost inflation
Land Acquisition Strategy
No large sites acquired Focused on more strategic
5
Source: CSO, ESRI, Goodbody, Revenue.ie, Savills, Company estimate * Inclusive of VAT
Position: Opportunity:
Fastest Growing Economy in the EU Average 5 year GDP +10.7% Employment growth +418k since 2012 Undersupply
Supply – 13,373 Demand – 35,000 Attractive PRS Market
seeking PRS
in the GDA Demographics +350k couples can afford to buy homes priced between €275k and €375k * Best Located, Low Cost Land Bank 15,100 units Average unit cost €49k: Housing - €37k Apartments - €76k Competitive Priced Starter Homes
starter homes can be priced between €275k and €375k Pipeline and Planning Maturity 32 sites - 70% of our sites are active or “ready to go” which underpins medium term guidance Multifamily / PRS
could satisfy more than €1bn of multifamily PRS demand
6
Be the most trusted, respected and safest homebuilder in Ireland
Our vision Our mission
Building in great locations to create places and homes where people love to live
Collaborative Commercially minded Honest & Straightforward Agile & Innovative Committed & Engaged
Our values Strategic pillars:
People
Attract and retain the best talent and trusted partners
Operational excellence
Leverage a high performing commercial
platform
Places
Create places for communities to prosper
Customers
Deliver the best customer experience
Homes
Design and build high quality homes
7
Citywest Multifamily PRS Forward Sale Backdrop
market in 2018 - forecast to grow to c. €1.5bn in 2019
was 8.8%
sale of 4 large multifamily PRS sites
(incl. vat)
direct access into Dublin City Centre
200 400 600 800 1000 2015 2016 2017 2018
€’m
€930m €884m
Source: Savills, Hooke & MacDonald, CBRE, Daft.ie
8
100 200 300 400 500 600 2019 2020 2021
WIP, Land Purchases & Other Costs Revenue Cumulative Cash
S T R O N G C A S H G E N E R A T I O N
Assumptions behind the Cash Generation Illustration to 2021
to FY 2021
€’m
Significant Free Cash Generation 2019 to 2021
Progressive Capital Returns
At our interim results announcement in September 2019, the Company:
and/or share buybacks
Elsmore, Naas
10
Commentary
the sale of 804 units (€294.2m) and site sales (€41.7m)
and a gross profit of €69.1m, up from 18.2% and €27.1m in 2017 (+ 230bps)
(2017: €14.5m) (+ 267%)
cent (2017: 0.7 cent) (+ 529%)
* The term “adjusted” means before the impact of exceptional items (net of related tax) of €3.44m (2017: €0.5m) 2018 Unaudited 2017 Audited Before Exceptional Items Exceptional Total Before Exceptional Items Exceptional Total Items Items €m €m €m €m €m €m
Revenue 337.0
149.5
Cost of sales (267.9)
(122.4)
Gross profit 69.1
27.1
% margin 20.50% 18.20% Administrative expenses (15.9)
(12.1) (0.5) (12.6) Operating profit 53.2
15.0 (0.5) 14.5 Net finance costs (11.7) (3.9) (15.6) (8.5)
Profit before tax 41.5 (3.9) 37.6 6.5 (0.5) 6.0 Tax charge (6.2) (1.0) Profit for the year 31.4 5.0
Basic earnings per share 4.0 cent 0.6 cent Adjusted basic earnings per share* 4.4 cent 0.7 cent
11
(2017: €1,005m)
(2017: €721.7m)
All owned sites, including construction work in progress (€180.8m)
€159.4m) includes €62.2m cash. Net debt to inventories of 14.4% as at 31 December 2018
31 December 2018 of €199m
Commentary
2018 Unaudited 2017 Audited €m €m PP&E and intangibles 2.2 2.2 Restricted cash
Non-current assets 2.2 19.2 Inventories 933.4 911.5 Other receivables 8.0 5.5 Cash 62.2 68.8 Current assets 1,003.6 985.8 Total assets 1,005.8 1,005.0 Share capital and share premium 750.4 750.4 Share-based payment reserve 7.8 14.2 Retained earnings (6.1) (44.7) Non-controlling interest 4.4 1.8 Total equity 756.5 721.7 Loans and borrowings 147.3 226.8 Deferred taxation 5.9 5.6 Non-current liabilities 153.2 232.4 Loans and borrowings 49.3 18.4 Trade and other payables 46.8 32.5 Current liabilities 96.1 50.9 Total equity and liabilities 1,005.8 1,005.0
12
(2017: €15.6m)
€40.1m (2017: outflow €128.6m)
inventories represents 2018 site acquisitions plus spend
sales releases and site sales. Total spend on construction work in progress €241.9m (2017: €95.2m)
€62.2m at 31 December 2018
Commentary
2018 Unaudited 2017 Audited €m €m EBITDA 54.7 15.6 (Increase) in inventories (21.4) (184.3) Decrease in loan assets
Other working capital movements 6.8 24.1 Net cash from / (used in) operating activities 40.1 (128.6) Purchases of PP&E and intangibles (0.6) (1.2) Transfer from restricted cash 17.0 10.0 Net cash from investing activities 16.4 8.8 Proceeds from issue of share capital, net of issue costs paid
Proceed from borrowings, net of debt issue costs 94.2 96.9 Repayment of loans (145.6)
(1.3) 1.3 Interest and other finance costs paid (10.4) (5.6) Net cash (used in) / from financing activities (63.1) 143.0 Net (decrease) / increase in cash and cash equivalents (6.6) 23.2 Cash and cash equivalents at the beginning of the year 68.8 45.6 Cash and cash equivalents at the end of the year 62.2 68.8
Donnybrook Gardens, Dublin 4
14
Key Metrics and Characteristics Housing Apartments * Total Land Bank
Capital Allocation 54% 46% 100% Total Units 10,700 4,400 15,100 Average Cost per Unit €37k €76k €49k Average Selling Price (estimated) (ex. VAT) (no HPI) €309k €541k €377k NDV €3.3bn €2.4bn €5.7bn Land (at historical cost) as a % of NDV 12.0% 14.1% 12.9% Average Site Size (units) 475 260 Typical Purchaser Income
(single or joint) €150k + Purchaser Profile Mortgage Backed (incl. Help to Buy) Mortgage Backed, Cash Purchasers, Institutional / Multifamily PRS Investors
* Includes apartments which will be built for homeowners, private investors and institutional buyers of multifamily PRS
15
71% 29%
Unit Type
Buyer Profile
FTB (from €275k – €375k) Trade Up / Mover (from €375k – €550k) Premium (from €550k) Social Houses Apartments
Targeted Capital Allocation
capital allocation
developments
Units Investment Allocation Dublin - within M50 3,850 25.5% Dublin - outside M50 5,950 39.4% Rest of GDA 3,880 25.7% Regional 1,420 9.4% Total 15,100 100.0%
Balance Sheet
16
2015 / 2016 2017 2018 Land acquisitions €693m* €150m €34m Land (at cost) at year end €690m* €789m €751m Construction work in progress (at cost) €37m €104m €181m
Land Bank in Numbers
units
in 2015
2015 and 2016
including c. 1,100 units in 2018
11,900 15,100 1,570 3,000 1,222 148
Acquired 15/16 Acquired since 17 Planning Gains Sales Disposals Mar-19
Significant ongoing enhancement of the value
* Cumulative 2015 and 2016 land acquisitions, land (at cost) at the end of 2016
17
Efficient Planning Processes Land Bank Planning Status
SHD Process SDZ Process
One step planning process Eight week fast track planning process (no appeals)
5 applications granted planning (1,620 units) 5 applications in process (c. 1,800 units) 4 applications granted planning (894 units) 3 applications at design stage (c. 1,000 units)
Average duration – 30 weeks Average duration – 8 weeks
33% 24% 13% 28% 2%
Planning Status
100% success rate delivering 4,931 units
Strategic Development Zones (SDZ) processes covers our entire residentially zoned land bank:
Full Planning Permission SDZ (effective FPP) In Planning (SHD process) Residentially Zoned Subject to Zoning
Gandon Park, Lucan
19
Product Mix Units ASP Revenue Housing – Starter Homes 262 €300k €78.6m Housing – Trade Up / Down 82 €392k €32.2m Apartments * 127 €714k €90.6m Total 471 €428k €201.4m
2019 Closed and Forward Sales (as at 6 March 2019):
Note: All ASPs are exclusive of VAT | * Apartments include 120 units at Six Hanover Quay
Product Mix Units ASP Revenue Housing – Starter Homes 532 €307k €163.5m Housing – Trade Up / Down 80 €421k €33.7m Apartments 192 €505k €97.0m Total 804 €366k €294.2m
Starter Homes: 532 sold in 2018 and 262 closed / forward sales in 2019 - ASP of €305k on 794 units
20
Spring selling season
Park (Lucan)
Gandon Park (Lucan) and Oak Park (Naas)
Sales
sales outlet (2017: 2.4 units)
Site
Average Weekly Sales since Formal Sales Launch
Parkside 2.7 Churchfields 2.7 Shackleton Park 4.2 Glenheron 3.5 Marianella 2.1 Elsmore 1.9 Mariavilla 4.0
21
300 350 400 450 500 550 600 200 400 600 800 1,000 1,200 1,400 1,600 2018 2019 2020 2021 Houses Apartments Range Revenue Revenue €’m Unit Sales Closings
On track to deliver medium term target of
Note - Excluding HPI, including site sales
22
Procurement – current committed order book on active sites €250m Top 15 subcontractors 60% Average total contact value awarded to Top 15 subcontractors €18m Average number of sites of Top 15 subcontractors 5
Fixed price agreements in place on active developments providing certainty on costs 2.75% annual build cost inflation €242m procurement in 2018 Central procurement and site management leverages our scale and established subcontractor base
Fixed Construction Costs 2019 2020 % of Build Costs Fixed 81% 71%
Continuing to closely manage build cost inflation including the cost of new building regulations (NZEB) and wage inflation
23
Source: Savills, Hooke & MacDonald, CBRE, Independent.ie
Key Suppliers Procurement Advantages
Strong Irish supplier base (>90%) with limited exposure to UK materials
24
25
Mariavilla, Maynooth
26
Continue to leverage significant demand for competitively priced starter homes, build to sell apartments and multifamily PRS units Approach to capital returns in the form of
dividends and/or share buybacks to be outlined in September 2019 Intention to announce a first interim ordinary dividend of 2.5 cent per share in September 2019 Strong cash generation –
end of 2021
5 new site commencements this year
and strong forward sales pipeline underpins medium term target of c.
1,400 – 1,500 units by 2021
28
Competitive Mortgage Market
Competition intensifying on headline mortgage rates Drawdowns (value) +19.2% in 2018
Owning versus Renting
+40% more expensive to rent than own a 3-bed home in Dublin
Employment & Wage Inflation
Employment +418k since 2012 Wage inflation +3.4% in 2018
Population
+1.3% (+ 64,500) in the year to April 2018 (3x EU average)
Supply
18.1k new homes in 2018 – only 13.4k in multi unit developments of which 9.4k are in the GDA GDA annual demand – c. 20k
Dublin Rents and House Prices
Rents 31% higher than previous peak House prices 21.4% below previous peak
Annual Housing demand
ESRI Estimate 35,000
Shortfall in New Homes
June 2015 IPO
Government Initiatives
Rebuilding Ireland Project Ireland 2040 LIHAF Fast-track Planning Help to Buy Apartment Design Guidelines Building Height Guidelines
Source: CSO, ESRI, Banking Payments Federation of Ireland, Daft.ie, Goodbody, Company estimates
29
(c. 10,700 units) with excellent public transport links and no planning risk
Active Units
1 Parkside, Malahide Road 395 2 Churchfields, Ashbourne, Co. Meath 397 3 Elsmore, Naas, Co. Kildare 500 4 Shackleton Park, Lucan 768 5 Glenheron, Greystones, Co. Wicklow 393 6 Mariavilla, Maynooth, Co. Kildare 462 7 Albany, Killiney 20 8 Oak Park, Naas, Co. Kildare 251 9 Gandon Park, Lucan 237 10 Citywest, Dublin 24 165
2019 / 20 Commencements
11 Clonburris, Dublin 22 12 Cherrywood, South Co. Dublin 13 Swords, Co. Dublin 14 Newcastle, Co. Dublin 15 Farrankelly, Delgany, Co. Wicklow 16 Parkside, Malahide Road (NAMA JV)
Future
17 Douglas, Cork 18 Blessington, Co. Wicklow 19 Coolagad, Greystones, Co. Wicklow 20 Enniskerry, Co. Wicklow 21 Callan Road, Kilkenny 22 Rahoon, Galway 23 Ballymoneen Road, Galway
1 1 2 1 1 1 3 1 6 2 3 8 5 4 7 9 11 14 12 15 18 20 19 17 21 23 22 10 13 16
Cost per Housing Site Average Estimated Selling Price per Unit *
€37k €309k
* Exclusive of VAT and HPI
30
1 km SCALE
(c. 4,400 units) in and near Dublin City
1
3 2 6 5 12 13 15 14 4 7 10 11 16 8 9
Cost per Apartment Site Average Estimated Selling Price per Unit *
€76k €541k
Active PRS Opportunity Units
1 Marianella, Rathgar, Dublin 6W 208 2 Hanover Quay, Dublin 2 120 3 Greenfields, Donnybrook, Dublin 4 86 4 Shackleton Park, Lucan 60
Planned 2019 / 20
5 Montrose, Dublin 4 6 Griffith Avenue, Dublin 9 7 Cross Avenue, Blackrock, Co. Dublin 1 Marianella, Rathgar, Dublin 6W (new phase) 8 Citywest, Dublin 24 9 Parkside, Malahide Road
Future
10 Stillorgan, Co. Dublin (incl. PBSA) 11 Mariavilla, Maynooth, Co. Kildare (PBSA) 12 Swords, Co. Dublin 13 Glenheron, Greystones, Co. Wicklow 14 Barrington Tower, Carrickmines, Dublin 18 15 Glenamuck Road, Carrickmines, Dublin 18 16 Parkside, Malahide Road (NAMA JV)
* Exclusive of VAT and HPI
31
The First Time Buyer
(or combined for couples) with a preference for 3 bedroom houses (60% of Cairn FTB’s)
The Up-sizer
accommodate expanded families
levels of equity vary with those who bought pre-2000 carrying significantly more equity into their new homes
specific and new homes at their price points are not being built
who bought their first home before 2005 and after 2010 (have equity), while challenged for those who bought between 2005 and 2008 (in negative equity)
The Down-sizer
houses purchased in the 1970’s - 1990’s containing significant equity
seeking smaller houses or apartments
60% of apartment purchasers in Marianella are Down-sizers
Outlook: Profile:
32
The Young Professional
centre location focused - want to live near where they work in 1 and 2 bedroom apartments
sensitive than FTB’s
limited number of new apartments being built near where they work
number of higher paid jobs in Dublin’s CBD, with numerous tech firms continuing to expand and Brexit relocations
Individual Investors
bedroom apartments for onward rental
working overseas buying a residential property in Dublin as a potential future home
generally discouraged from a tax perspective, albeit full interest relief is now available in Ireland
purchasers in Marianella were investors
Institutional Investors
multifamily PRS operators and Irish REIT’s seeking entire apartment blocks to build multifamily PRS portfolios of scale
and attractive yields)
multifamily PRS opportunities
will continue to be constrained
Outlook: Profile:
5,000 7,000 9,000 11,000 13,000 15,000 17,000 19,000 21,000 2018 (A) 2019 2020 2021 2022 2023 Supply - GDA (Cairn Estimate) Demand - GDA
33
Source: Company estimates, Goodbody, CSO
2018 National Cairn GDA Supply Forecast
We estimate that output will increase by c. 1,500 units per annum into the medium term
GDA Demand – 20,000 Units Estimated undersupply 2018 – 2023: c. 53,000 units
2018 GDA Scale of undersupply of new homes in Ireland since Cairn IPO in June 2015: 75,827 18,072 completions include 4,699 (26%) one off houses GDA supply is c. 50% below demand levels 10,245 completions include 830 (8%) one off houses Only 1,833 apartments built 70% of national multi-unit supply
34
schemes that are through planning or in planning, and benefitting from density and height changes, we estimate that less than 4,000 apartments will be delivered by the end of 2021 in Dublin’s CBD
at the pace of Dublin and attracting continued FDI and Brexit displacement jobs
which is the maximum number of apartments that can be delivered by the end of 2020 due to the known construction timeline of an apartment development:
In Dublin’s Central Business District (CBD) there is a critical undersupply of apartments
Status Dublin 1 Dublin 2 Dublin 4 Dublin 8 CBD Total
Under Construction 756 382 370 246 1,754 FPP (construction not commenced) 828 178 379 216 1,601 Planning Application Lodged 560 202 93 855 Pre-Planning 810 600 1,410 Total 2,954 560 1,551 555 5,620
Data Sources 1. Cairn’s proprietary land and planning management information system; 2. An Bord Pleanála weekly lists and monitoring updates (SHD process schedules etc); 3. Commencement notices through Building Control Management System; 4. www.buildinginfo.ie; 5. Broader media publications
35
Source: Daft.ie, Eurostat, CSO
Dublin Properties to Rent Percentage of Population Living in Apartments
1,000 2,000 3,000 4,000 5,000 6,000 7,000 8,000 9,000 Q4 2006 Q2 2007 Q4 2007 Q2 2008 Q4 2008 Q2 2009 Q4 2009 Q2 2010 Q4 2010 Q2 2011 Q4 2011 Q2 2012 Q4 2012 Q2 2013 Q4 2013 Q2 2014 Q4 2014 Q2 2015 Q4 2015 Q2 2016 Q4 2016 Q2 2017 Q4 2017 Q2 2018 Q4 2018
highlighted with only 1,350 properties to rent in Dublin as at 31 December 2018
at less than 0.3% of the total Dublin housing stock
apartments in Ireland which has the lowest percentage
EU–28 Ireland
36
Property Buyer
Reported Price
Neptune Building, Dun Laoghaire International institutional investor 197 €72.5m Leona & Charlotte Buildings, Dun Laoghaire International institutional investor 319 €132m Hampton Wood, Finglas, Dublin 11 REIT 128 €40m Fernbank, Churchtown, Dublin 16 Domestic institutional investor 262 €138.5m Elmfield, Leopardstown, Dublin 18 International institutional investor 185 €68.5m Six Hanover Quay, Dublin 2 Irish asset manager 120 €101m The Grange, Stillorgan, Co. Dublin Domestic institutional investor 274 €126m Bridgefield, Northwood Demesne, Santry, Dublin 9 International institutional investor 216 €84m Dublin Landings, Dublin 1 Under negotiation - international institutional investor 268 €170m Herbert Hill, Dundrum Preferred bidder - international institutional investor 90 €50m Belgrave Collection, Dublin 2, 4, 6 & 8 International institutional investor 265 €68m Marrsfield Avenue, Clongriffin, Dublin 13 International institutional investor 372 €112m Fairways, Dun Laoghaire Preferred bidder - international institutional investor 214 €95m
Total €1.26bn
Source: Savills, Hooke & MacDonald, CBRE, Independent.ie
37
Notes: The table highlights house price affordability based on Revenue.ie 2016 individualised gross income distributions. Individuals then grouped as couples. Wage inflation is added for both 2017 (2%) and 2018 (3.4%). Maximum mortgage calculated as 3.5 times 2018 gross income. Full house price assumes maximum mortgage equates to 90% LTV. These are current affordability levels and not forecasts.
What would an individual have to earn to afford a new home: What would a couple have to earn to afford a new home: Irish Revenue statistics indicate that there are: 484k couples who can afford to buy a house priced between €282k and €525k 166k individuals who can afford to buy a house priced between €303k and €486k.
% of Cairn FTBs that are couples
Average 2017 and 2018 Wage Inflation
Joint Income (€) Number of Couples Maximum Mortgage Can Afford a House (3.5x Income) (€) at this Price (€)
72,500 221,000 253,750 282,000 93,000 133,000 325,500 362,000 114,000 83,000 399,000 443,000 135,000 47,000 472,500 525,000
Income (€) Number of Individuals Maximum Mortgage (3.5x Income) (€) Can Afford a House at this Price (€)
78,000 57,000 273,000 303,000 88,500 36,000 309,750 344,000 99,000 23,000 346,500 385,000 125,000 50,000 437,500 486,000
38
If we assume that 25% of these couples and individuals own their own homes (less than 15% of all people aged under 49 own their own home), our addressable market (those who can afford to buy a new Cairn home, subject to having a deposit and mortgage approval) is:
Purchaser House Price Bands (€’000) Cairn Land Bank Units FTB 275 – 300 4,100 300 – 325 1,700 325 – 350 1,400 Trade up/Mover 350 – 375 1,200 375 – 400 500 400 – 425 1,000 425 – 450 300 Employment Growth 2017 and 2018
Number of Cairn FTB homes (sub €350k)
For our 3,000 Trade-Up / Down Homes = 98k couples and 55k individuals (28k couples / 38k individuals in the GDA) For our 7,200 Starter Homes = 265k couples and 69k individuals (100k couples / 45k individuals in the GDA)
39
Expansionary budgets Mortgage rates falling slowly Strong labour market Wage inflation outstripping Consumer Price Index
Source: CSO, Goodbody, BPFI, CBI, Taxcalc.ie, Department of Finance
0.0% 1.0% 2.0% 3.0% 4.0% 2013 2014 2015 2016 2017 2018 2019f 2020f
Wage Inflation CPI
4.0% 8.0% 12.0% 16.0% 1600 1800 2000 2200 2400
2007Q1 2007Q3 2008Q1 2008Q3 2009Q1 2009Q3 2010Q1 2010Q3 2011Q1 2011Q3 2012Q1 2012Q3 2013Q1 2013Q3 2014Q1 2014Q3 2015Q1 2015Q3 2016Q1 2016Q3 2017Q1 2017Q3 2018Q1 2018Q3
Employment Unemployment
418k new jobs created in Ireland since 2012 2.50% 3.00% 3.50% 4.00% 4.50%
Jun-15 Aug-15 Oct-15 Dec-15 Feb-16 Apr-16 Jun-16 Aug-16 Oct-16 Dec-16 Feb-17 Apr-17 Jun-17 Aug-17 Oct-17 Dec-17 Feb-18 Apr-18 Jun-18 Aug-18 Oct-18 Dec-18
Standard Variable Rates 1-3 Year Fixed Rate
0.0% 1.0% 2.0% 3.0% 2013 2014 2015 2016 2017 2018 2019
EU Average Mortgage Rate: 1.77%
Fixed Rates – down 0.87% Variable Rates – down 0.85%
Impact on a couple earning €80k
40
Source: Goodbody, BPFI, CBI
Key facts Size of mortgage market expected to grow significantly Mortgage drawdown growth is driven by FTB’s New entrants making the market more competitive
6,000 9,000 12,000 15,000 300 600 900 1,200 1,500
Q1 Q2 Q3 Q4 Q1 Q2 Q3 Q4 Q1 Q2 Q3 Q4 Q1 Q2 Q3 Q4 Q1 Q2 Q3 Q4 2014 2015 2016 2017 2018
FTB Purchase Mover Purchase Other €’m # Loans
FTB’s = 60% of mortgage drawdowns and approvals in 2018 30,000 40,000 50,000 60,000 4,000 6,000 8,000 10,000 12,000 14,000 2017 2018 2019 (F) 2020 (F) 2021 (F)
Value of mortgages (€bn) Number of mortgages €’m # Loans
€8.7bn
In 2018:
21,919 mortgages approved for FTB’s 6,237 mortgage drawdowns for FTB’s for new homes Average FTB age is 34 and LTV is 80% Competition amongst mortgage providers is targeted at fixed rate customers – fixed rates as low as 2.3% available compared to standard variable rates at c. 3.27% Since the introduction of Help to Buy in July 2016, 71% of FTB mortgage drawdowns have been for secondhand homes
? ?
41
This presentation document (hereinafter “this document”) has been prepared by Cairn Homes plc (“Cairn” or the “Company”). This document has been prepared in good faith, but the information contained in it has not been subject to a verification
given by or on behalf of the Company, its group companies or any
their respective shareholders, directors,
advisers, agents of other persons as to the accuracy, fairness
data in this document has been sourced from third parties. Save in the context of fraud, no liability is accepted for any errors, omissions or inaccuracies in any of the information or
Certain information contained herein constitutes “forward- looking statements”, which can be identified by the use of terms such as “may”, “will”, “should”, “expect”, “anticipate”, “project”, “intend”, “continue”, “target” or “believe” (or the negatives thereof) or other variations thereon or comparable
events or results of actual performance of the Company may differ materially from those reflected or contemplated in such forward-looking statements. No representation or warranty is made as to the achievement or reasonableness of and no reliance should be placed on such forward-looking statements. There is no guarantee that the Company will generate a particular rate of return, operating profit margin or that it will achieve its targeted number of homes (per annum or over a development period).
42
+353 1 696 4600 investors@cairnhomes.com 7 Grand Canal Grand Canal Street Lower Dublin 2 Ireland D02 KW81
Glenheron, Greystones