SLIDE 1
CAD Geometry
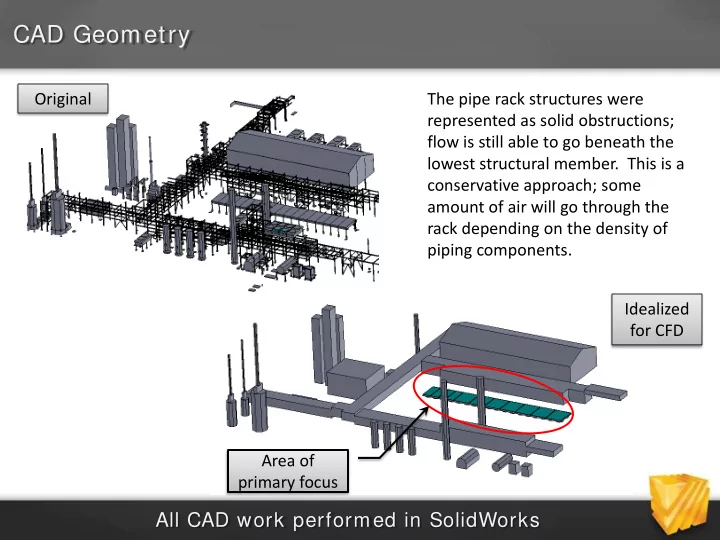
All CAD work performed in SolidWorks
Idealized for CFD Original The pipe rack structures were represented as solid obstructions; flow is still able to go beneath the lowest structural member. This is a conservative approach; some amount of air will go through the rack depending on the density of piping components. Area of primary focus
SLIDE 2
Simulation Flow Domain and Conditions
10 mph P=0 psi Slip Slip
Air is at STP conditions
Coolers are at 45° angle to flow
SLIDE 3
Cooler Unit Dimensions (typical, unit 3040 shown)
Some units have a 2’ shroud
Air is at STP conditions
SLIDE 4
Cooler Unit Flows and Velocities
Unit ACFM/Fan # Fans Vinlet (fpm) Voutlet(fpm) 3037 80,874 2 1030 480 3038 126,473 2 1610 772 3039 115,919 2 1476 725 3040 124,629 2 1587 746 3021 110,863 4 1412 657 3020 110,833 4 1411 703 3019 62,233 4 792 357 3307 130,689 4 1664 732 3306 140,054 4 1783 737 3916 126,628 4 1612 743 3917 129,685 4 1651 715
Inlet velocities are calculated at the fan inlet.
SLIDE 5 Simulation Assumptions
- Incompressible, homogenous air used as the fluid
medium.
- Air is at standard temperature and pressure (STP)
with constant density and viscosity.
- Adiabatic conditions; heat transfer not considered.
- Steady-state flow results; no transient effects.
- Constant velocity conditions across the cooler inlets
and outlets.
- Ambient wind speed of 10 mph from SW.
– Typical speed for site confirmed from the National Climatic Data Center www.ncdc.noaa.gov/ oa/ ncdc.html
SLIDE 6
Overall Particle Traces
Note recirculation
Traces are seeded from cooler outlets.
SLIDE 7 Why are some units showing slight recirculation?
- Strong suction at the inlet is
in close proximity to the leading edge of the outlet.
- A short circuit path exists
between the inlets and outlets between the catwalk.
- The ambient horizontal air is
colliding with the strong vertical air column from the fan exhaust.
factors provides the
percentage of recirculation to
Strong suction Flow collision
SLIDE 8
Unit Recirculation Details: 1 of 3
Traces are seeded from the fan inlets.
3037 3038 3039 3040 No recirc Recirc Note short-circuit path between cooler and catwalk. No recirc
SLIDE 9
Unit Recirculation Details: 2 of 3
Traces are seeded from the fan inlets.
3020 3021 3019 3307
SLIDE 10
Unit Recirculation Details: 3 of 3
Traces are seeded from the fan inlets.
3306 3916 3917 Note that since the units are at a 45 degree angle to the ambient flow, the recirculation into a unit mostly comes from the units upstream
SLIDE 11 Cooler Unit Recirculation Estimates
Unit % Recirculation 3037 3038 3039 1 3040 5 3021 5 3020 2.5 3019 2.5 3307 2.5 3306 7 3916 8 3917 3.5
- Estimates made by seeding
100 traces from each fan inlet and then counting number of traces with come from the fan
SLIDE 12 Summary
- Some amount of recirculation observed at leading
edge of units due to interaction between ambient and exhaust air streams.
- A short-circuit path exists between the cooler and
the catwalk; eliminating or extending this path could prevent any recirculation
– Adding a kick plate from the catwalk to the cooler to eliminate the short-circuit path. – Adding a skirt above the cooler unit which extends to short-circuit path
Results may vary for other wind speeds and directions.
SLIDE 13 Appendix – Validation Overview
- Used to prove that this application is
dominated by forced convection and that buoyancy (air density change due to temperature variation) has little to no impact on results.
- Test isolated to unit 3040
- Temperatures:
– Ambient: 110 °F – Discharge: 128.2 °F
- External air flow: 10mph
- An 18°F rise in air temperature only
results in a 3% reduction in air density.
Results reveal minimal difference between constant and buoyant air.
SLIDE 14
Appendix – Validation Particle Traces
Constant Buoyant Note hot air recirculation
SLIDE 15
Appendix – Validation Flow Vectors
Constant Buoyant
SLIDE 16
Appendix – Validation Temperature Profile
Constant Buoyant Note hot air recirculation Some impact on downstream temps