SLIDE 1 13/04/11 ¡ 1 ¡ ¡ ¡ ¡ ¡ ¡ ¡
Changing ¡Trade ¡Structure ¡and ¡the ¡Composi9on ¡of ¡ the ¡O<oman ¡Import ¡from ¡England ¡in ¡the ¡nineteenth ¡ century ¡ ¡ ¡ ¡
¡ ¡ ¡
By ¡Mehmet ¡Bulut ¡ Professor ¡of ¡Economics ¡and ¡Economic ¡History ¡ ¡ ¡ Dean ¡of ¡Faculty ¡of ¡Poli9cal ¡Sciences ¡at ¡Yıldırım ¡Beyazıt ¡University,Ankara. ¡ e-‑mail:mehmetbulut05@gmail.com ¡ ¡Presenta9on ¡at ¡ ¡ENIUGH, ¡The ¡Third ¡European ¡ ¡Congress ¡on ¡ ¡World ¡and ¡Global ¡ History, ¡London ¡School ¡of ¡Economics, ¡14-‑17 ¡April ¡2011 ¡ ¡ ¡ ¡ ¡
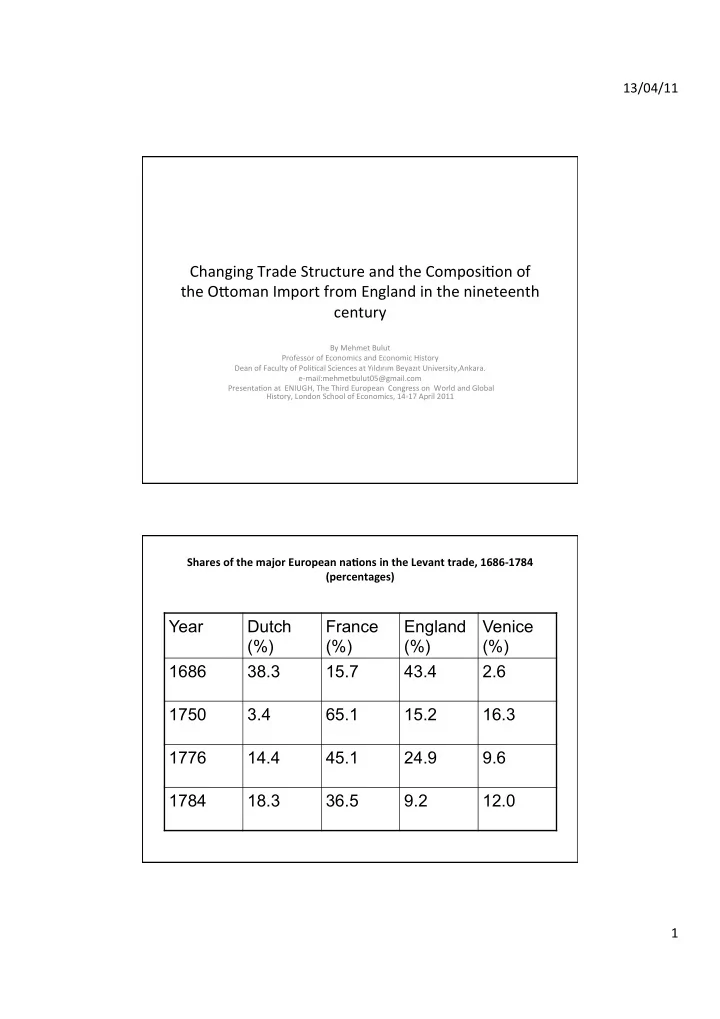
Shares ¡of ¡the ¡major ¡European ¡na1ons ¡in ¡the ¡Levant ¡trade, ¡1686-‑1784 ¡ (percentages) ¡ ¡
Year Dutch (%) France (%) England (%) Venice (%) 1686 38.3 15.7 43.4 2.6 1750 3.4 65.1 15.2 16.3 1776 14.4 45.1 24.9 9.6 1784 18.3 36.5 9.2 12.0
SLIDE 2
13/04/11 ¡ 2 ¡
¡ Increase ¡the ¡share ¡of ¡Austria ¡and ¡Russia ¡in ¡towards ¡ the ¡end ¡of ¡the ¡18th ¡century ¡ ¡ ¡ In ¡1784 ¡ share ¡of ¡Ausria ¡reached ¡to ¡24 ¡%. ¡ ¡ ¡ ¡ ¡ ¡ ¡
¡
Exports ¡and ¡Imports ¡in ¡three ¡O<oman ¡ports ¡
¡ ¡
Port ¡ Year ¡ ¡ Import ¡ ¡ Export ¡ Alexandria ¡ 1782 ¡ 5,008,000 ¡ 6,678,000 ¡ Salonica ¡ 1788 ¡ 4,573,000 ¡ 6,764,000 ¡ Izmir ¡ 1788 ¡ 20,938,000 ¡ 32,402,000 ¡
SLIDE 3 13/04/11 ¡ 3 ¡
¡ ¡ Ships ¡stopped ¡at ¡Rhodes, ¡1776-‑1779 ¡
¡
Total ¡Ships: ¡776 ¡
174 ¡-‑O<oman ¡(%24,4) ¡ 411-‑ ¡French ¡(% ¡53) ¡ 95-‑ ¡Vene9an ¡ 59 ¡-‑Ragusan ¡ 35-‑ ¡English ¡ ¡
¡ The ¡new ¡era:nineteenth ¡century, 1820-‑1913 ¡
- Changing ¡
- ¡trade ¡towards ¡the ¡middle ¡of ¡the ¡century ¡
- the ¡composi9on ¡of ¡trading ¡goods ¡
¡ ¡ ¡ ¡
SLIDE 4
13/04/11 ¡ 4 ¡ Growth ¡in ¡Volume ¡of ¡World ¡Trade ¡and ¡GDP, ¡1500-‑1913 ¡ (Annual ¡average ¡compound ¡growth ¡rates) ¡ ¡
Period ¡ World ¡ Trade ¡ World ¡GDP ¡ Col ¡1/2 ¡ 1500-‑1820 ¡ 0.96 ¡ 0.32 ¡ 3.0 ¡ 1820-‑1870 ¡ 4.18 ¡ 0.94 ¡ 4.4 ¡ 1870-‑1913 ¡ 3.40 ¡ 2.12 ¡ 1.6 ¡
SLIDE 5
13/04/11 ¡ 5 ¡
SLIDE 6
13/04/11 ¡ 6 ¡
SLIDE 7
13/04/11 ¡ 7 ¡
SLIDE 8
13/04/11 ¡ 8 ¡
SLIDE 9
13/04/11 ¡ 9 ¡