Built Environments & Travel Behavior Transportation street - - PowerPoint PPT Presentation

built environments travel behavior transportation street
SMART_READER_LITE
LIVE PREVIEW

Built Environments & Travel Behavior Transportation street - - PowerPoint PPT Presentation

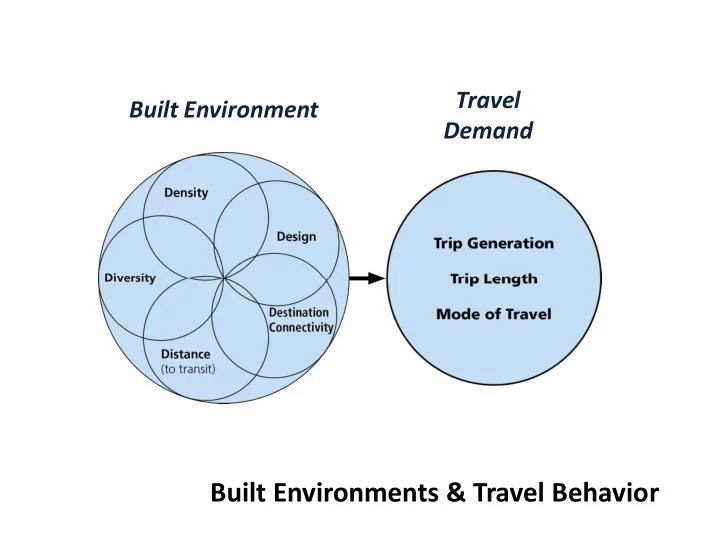
Travel Built Environment Demand Built Environments & Travel Behavior Transportation street networks have a huge influence on urban form and travel. Downtown Bellevue Downtown Seattle Downtown Portland (21% used for right-of-way) ( 38 %


slide-1
SLIDE 1

Built Environment Travel Demand

Built Environments & Travel Behavior

slide-2
SLIDE 2

Transportation street networks have a huge influence on urban form and travel.

2

Downtown Bellevue (21% used for right-of-way) 600-foot blocks Downtown Seattle (38% used for right-of-way) 300-foot blocks Downtown Portland (42% used for right-of-way) 250-foot blocks

slide-3
SLIDE 3
slide-4
SLIDE 4

“Street as Plaza” – Bellevue Way to 106th

4

slide-5
SLIDE 5

Neighborhood Retail

slide-6
SLIDE 6

Seattle Pedestrian Master Plan

Vision: Make Seattle the Most Walkable City in the Nation

  • Safety: Reduce the number and severity of crashes

involving pedestrians

  • Equity: Make Seattle a more walkable city for all

through equity in public engagement, service delivery, and capital investments

  • Vibrancy: Develop a pedestrian environment that

sustains healthy communities and supports a vibrant economy

  • Health: Raise awareness of the important role of

walking in promoting health and preventing disease

Identify actions, projects, and programs to achieve the following goals:

slide-7
SLIDE 7

Pedestrian Master Plan: Objectives

  • Complete and maintain the

pedestrian system

  • Improve walkability
  • Increase safety
  • Plan, design, and build complete

streets

  • Create vibrant public spaces
  • Get more people walking
slide-8
SLIDE 8

Improvement Opportunities

Along the Roadway Across the Roadway

slide-9
SLIDE 9

Pedestrian Potential

Demand Generators

  • High generator

– University or college – Major destination – Light rail – Major bus stop

  • Medium generator

– School – Major retail / grocery – Hospital – Community center – Park

  • Low generator

– Minor retail – Minor bus stop

slide-10
SLIDE 10

10

2011 PMP Infrastructure Deliverables

  • 50 crossing improvements
  • 25 pedestrian countdown signals
  • 300 crosswalks remarked
  • 10 school zone improvements
  • 5 school walking route

improvements

  • 10 blocks of new sidewalk
  • 22 blocks of sidewalk repair
  • 280 curb ramps
slide-11
SLIDE 11

11

  • Many cannot

Many cannot drive. drive. Other modes depend Other modes depend

  • n walking & biking.
  • n walking & biking.

Makes roads safer for all Makes roads safer for all road users road users Good for Good for business. business. Improves the quality of Improves the quality of life. life. Encourages active & Encourages active & healthy living. healthy living. Good for the Good for the environment. environment.

slide-12
SLIDE 12

Summary: Walkable Communities

  • Land Use: A major part of “proximity”. Land use

proximity influences ability to walk

  • Facilities along corridors: Sidewalks, adequate

sidewalk widths, buffers from cars, opportunities for place-making

  • Safe crossings: Pay attention to conflict points at

intersections

  • “Orange Juice” test

Kevin O’Neill, AICP (kevin.oneill2@seattle.gov )

Important to Consider Several Aspects: