SLIDE 1
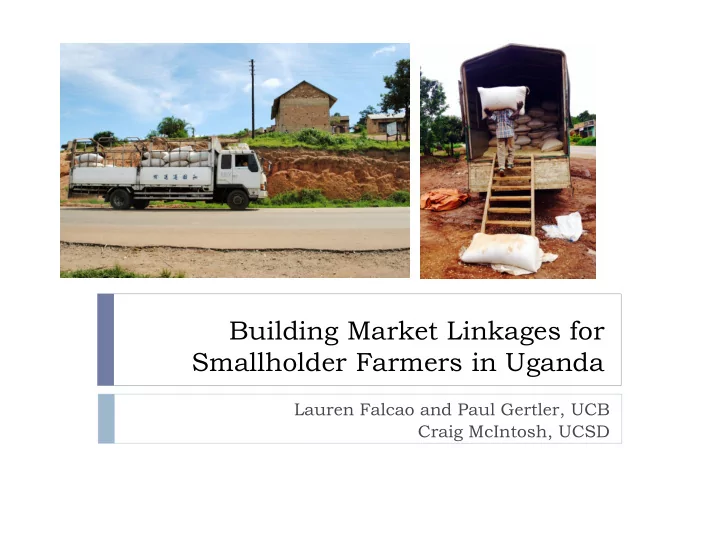
Building Market Linkages for Smallholder Farmers in Uganda
Lauren Falcao and Paul Gertler, UCB Craig McIntosh, UCSD
SLIDE 2 Poor Integration in African Markets:
Lack of market integration is a major issue.
Leads to highly variable prices across time, so farmers tend to
sell low (harvest) and buy high (hungry season) (Burke 2013).
Leads to high search costs (Allen 2013) and poor co-
integration across space (Minten, Stifel, and Tamru 2012).
Improving intermediation allows for the possibility of large
returns in the gains from trade (Antras & Costinot, 2011).
Major implications for farmer welfare, food security (Badiane
and Shively, 1998, Ravallion 1986).
Downward-sloping demand curves dampen incentives to
invest in productivity enhancement, may also have major long-run effects on agricultural productivity in shallow markets.
SLIDE 3 Poor Integration in African Markets:
Some very expensive ways to solve this problem:
Infrastructure investment:
roads (Minten 2011, Casaburi et al. 2013) storage capacity (Deaton & Laroque 1996)
Information Technology appears to be a cost-effective
alternative, but:
Simply providing price information to farmers isn’t sufficient in
most contexts (Fafchamps & Minten 2012, Mitra et al. 2013), despite Jensen (2007) and Aker & Fafchamps (2010).
Necessary to fundamentally shift intermediary power/actors in
- rder to change prices (Goyal 2011, Aker 2010, Svensson &
Yanagizawa 2009).
SLIDE 4 Poor Integration in African Markets:
Hypotheses: what is required to change intermediary
market power, improve farm-gate prices:
1.
Farmers must be informed at the time they make sales decisions.
2.
Farmers must have multiple, competing buyers.
3.
Buyers must overcome search cost, obstacles related to price and quality uncertainty in order to be willing to trade deep in rural areas.
4.
Long output sales chains need to be shortened. Need to cut
- ut multiple intermediaries all of whom can extract
information rents.
SLIDE 5 Our solution:
Multipronged intervention providing:
Creation of new private-sector intermediaries with direct links to
large buyers, including forward contracts for specific cash crops.
Implementation of Kudu, new digital trading platform for agricultural
crops, allows farmers or agents to post lots, reservation prices.
Use of quality/bulking certification by agents and randomized
transport cost guarantees to promote digital platform.
Creation of large-scale SMS-based Market Survey in 260 markets,
collecting price data every two weeks.
Creation of ‘SMS Blast’ system that broadcasts price data from Kudu
+ Market Survey out to traders and farmers in treatment markets.
Large-scale RCT covering 12% of Uganda.
SLIDE 6
Our Team:
Policy Design &
Evaluation Lab at UCSD.
AgriNet: largest private-
sector ag intermediary.
Kudu: new software
platform from Makerere
IPA Uganda
SLIDE 7
Building Blocks of the Project:
AgriNet
Largest private-sector agricultural intermediary in
Uganda.
Recruit and train ‘Commission Agents’, who:
bulk and sell output using AN and own capital, receive ‘trader alerts’ about district & national prices
and post on community whiteboard.
engage in forward contracting, provision of inputs for
specific crops (sorghum) for specific buyers (Uganda Breweries).
SLIDE 8
Building Blocks of the Project:
Kudu.
Designed by the College of Computing and
Informatics T echnology at Makerere University.
Registered sellers post lots for sale, state
reservation prices, system knows seller location.
Buyers post bids and a ceiling price, matching
algorithm finds distance/price pareto frontier and displays 3 best lots to each seller.
Price-setting mechanism gives buyer lowest price
possible.
Kudu advertises by radio in sales markets.
SLIDE 9
Building Blocks of the Project:
Kudu
registration rising rapidly:
SLIDE 10
Building Blocks of the Project:
AgriNet-enhanced Kudu.
CAs will ‘certify’ the quality and bulking of lots
posted on Kudu.
Creation of an enhanced Kudu interface that allows
for posting of quality, AN certifications, guarantees.
Project will provide transport cost guarantees to
randomly selected lots to understand how contractual risk may prevent this market from working.
SLIDE 11
Building Blocks of the Project:
SMS Market Survey System.
Recruit traders to serve as enumerators; every two
weeks they are pushed out a survey and they respond by SMS.
Open-source software being designed at UCSD. Training, spot-checking to be conducted by IPA. New way of providing high-granularity market data,
system designed to be scaled rapidly within SSA if successful.
Provides data capture for study as well as price
inputs for interventions in treatment markets.
SLIDE 12 Market Linkages:
Basic Schematic: Farmers sell to traders in local market trading centers. Local traders sell
middlemen who transport to large national, international markets.
SLIDE 13 Market Linkages:
Kudu: Provides direct linkage between farmers and national buyers. Our project trains & licences AgriNet CAs to certify the quality
Kudu. AN to provide liquidity for bulking. Randomized guarantees of transport costs for buyers.
SLIDE 14
Market Linkages:
Market survey captures prices in T & C markets biweekly. Price data from Market Survey, Kudu fed into Blast SMS system. Farmers and Traders sign up to receive Blast SMS, system free for first year of project.
SLIDE 15
Market Linkages:
AgriNet’sTrader Alerts system sends out tenders from large buyers, prices in all regional markets. Permits CAs to sign forward contracts for specific cash crops.
SLIDE 16 Research Design & Statistical Power:
Randomization conducted at sub-county level. Pick 2-3 largest trading centers in each subcounty; become PSUs. Statistical power is an issue despite very large geographic coverage.
Treatment Control Unit of randomization: Subcounties: 55 55 Trading Centers: Hub Markets 15 15 Spoke Markets 115 115 Traders: All 550 550 AgriNet Cas 220 Farming Households: 1500 1500
SLIDE 17
Our Team:
SLIDE 18 Study districts:
are:
- maize surplus
- relatively remote
- deemed by
Agrinet to be attractive commercial candidates for expansion.
SLIDE 19 Project Timeline:
- Market identification study currently underway.
- Trader and Household Baselines Jan-Mar 2015.
- Market Survey starts in Mar 2015.
- Interventions begin with harvests in June 2015.
- Endlines in Spring 2017.
Years
Months
July Aug Sept Oct Nov Dec Jan Feb Mar Apr May Jun Jul Aug Sept Oct Nov Dec Jan Feb Mar Apr May Jun Jul Aug Sept
Vizualization maps sub‐counties Compiling list of sub‐counties Randomization Design Survey Instruments Recruitment Interns Market Identification Market Selection Pre‐test Survey Instruments Programming surveys on tablets + testing Recruitment of Enumerators Preparation training & field work Training baseline survey Household Survey team + recruitment farmers for KUDU Trader Survey team + recruitment traders for KUDU Trader recruitment for SMS market survey + training team CA Recruitment CA/Kudu Training Pilot SMS survey Intervention Farmer data collection Market data collection Impact Evaluation Workshop for East African PIs Clean and analyse data Roadshow (outreach) to USAID missions Draft report and academic papers
2015 2016 2017 Oct May Jun Apr Feb Mar Nov Dec Jan 2014
SLIDE 20
Primary outcomes:
Market level:
price levels, price dispersion, buying/selling margins. intertemporal price variation. responsiveness of prices to weather-driven output shocks.
Trader level:
profits & degree of market competition. trading volumes, trading locations, crops. what info held, where acquired.
Farmer level:
farmgate prices. marketed surplus, crop choice, inputs, who sold to. what info held, where acquired.
SLIDE 21 Analysis of market outcomes:
Dyadic analysis, ignoring ‘hub and spoke’: This will recover the following parameters: : Impact of having one dyad treated but not both, at
zero distance.
: Impact of having both in dyad treated, zero distance.
: Effect of distance on price dispersion in control, +underlying spatial correlation.
: Partially a TE from one pair being treated, also contains a spillover coming from traders being able to forecast prices better even in control markets.
: impact of improved information between dyads
1 2 1 2
1 2 *1 *2 .
ij ij ij ij ij ij ij ij ij
d d d
1
2
1
2
SLIDE 22 Analysis of market outcomes:
Using ‘hub and spoke’ to parameterize spillovers: This will recover the following parameters:
give the impact of having a spoke market treated.
give the spillover effect of having a hub treated conditional on the spoke not being treated.
give the additional treatment + spillover effect of treating a spoke if the hub is also treated.
1 1
,
1 2 3 1 2 3
* * * * *
ih ih h h ih ih h ih ih h h h ih ih ih
T T T T d d T d T d T T d
2 2
,
3 3
,
SLIDE 23 Handling Spillovers:
Would like to have ‘pure control’ districts, don’t have the
power for this.
Might also like to use ‘randomized saturation’ design (Crepon
et al. 2013, Baird et al. 2014) to look at spillovers directly, don’t have power.
How to balance desire for balance across districts (blocking)
with the need to measure spillovers?
‘Hub and spoke’ designation as a way of pre-committing to spillover structure: for each spoke market we identify the 1 or 2 major hubs and consider the treatment status of the hub as well as of the spoke.
Block by hub & spoke, stratify by baseline prices, but don’t block by district so as to create accidental variation in treatment at district, spatial level.
Identify 20 markets that are outside of the study area to serve as pure controls (non-experimental) and track them through the whole study using the Market Survey.
Other ideas?
SLIDE 24 Wrap-up:
Multipronged intervention that seeks to:
improve knowledge of prices and potential buyers for farmers. deepen resources available for commercial intermediaries in
local markets.
develop new high-tech platforms for agricultural trade.
Additional issues we hope to explore:
experiment with guarantees & use of liquidity in the AgriNet
bulking process; is capital a barrier to arbitrage?
provide randomized fuel subsidies for truckers moving over
specific routes to T & C markets: how do information and transport costs intersect to create Law of One Price?
secure support from USAID mission to help AN take over
management of storage facilities in selected markets
SLIDE 25
Thank you!