
SLIDE 1
Building a National Network for the Transportation Workforce
Building a National Network for the Transportation Workforce FHWA - - PowerPoint PPT Presentation
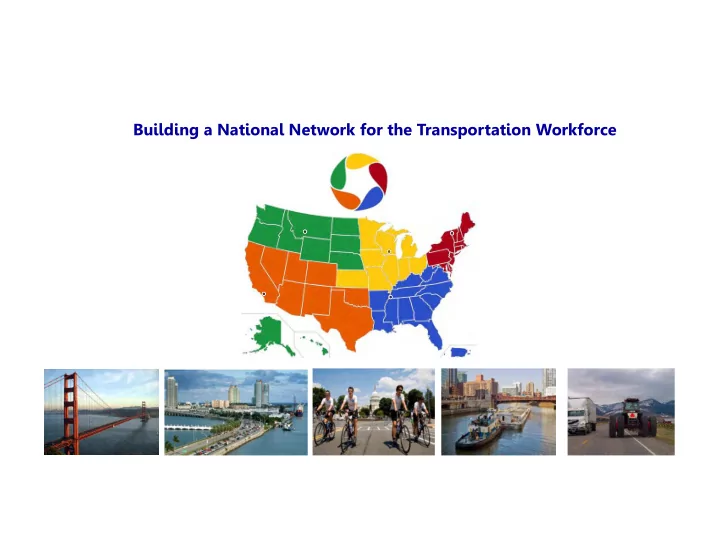
Building a National Network for the Transportation Workforce FHWA supported National Network for the Transportation Workforce NNTW formed to provide a more strategic and efficient approach to transportation workforce development. WEST
Building a National Network for the Transportation Workforce
strategic and efficient approach to transportation workforce development.
facilitate national partnerships with key public and private
transportation, education, labor, and workforce investment communities
transportation workforce activities, programs, and resources
WEST Steve Albert
Montana State University
stevea@coe.montana.edu (406) 994-6114 wrtwc.org
SOUTHWEST Tom O’Brien
California State University, Long Beach
Thomas.OBrien@csulb.edu (562) 985-2875 swtwc.org
MIDWEST Teresa M. Adams
University of Wisconsin- Madison
teresa.adams@wisc.edu (608) 263-3175 mtwc.org
SOUTHEAST Stephanie S. Ivey
The University of Memphis
ssalyers@memphis.edu (901) 678-3286 memphis.edu/setwc
NORTHEAST Glenn McRae
University of Vermont
glenn.mcrae@uvm.edu (802) 656-1317 netwc.net
at the University of Vermont Transportation Research Center with the Center for Advanced Infrastructure & Transportation at Rutgers University
www.netwc.net Strategic Framework for Action Creating resources to keep workforce professionals and educators engaged, build partnerships, and provide a one‐stop‐ shop for links to tools, ideas, and strategies.
http://netwc.net/
Comprehensive Literature Review Identify and analyze information from Federal, State, and private‐sector research, technical & conference reports and institutional documents Assess the transportation industry in each region as well as employment trends Results increased the team’s overall understanding of each Region’s transportation industry trends and workforce issues. Engage Transportation Workforce Stakeholders Engage industry stakeholders throughout the regions—both public and private partners—positions within state DOLs, DOTs, universities, associations, and private employers Input covered the broad work environment of personnel, critical job functions, anticipated workforce trends over the next 5 to 10 years, recruitment and retention challenges, workforce success strategies Results of this subtask help define the workforce at the region‐level and provide a preliminary list of critical workforce occupations and functions to focus on. Estimating regional workforce demand for occupations Generate and analyze historic, current, and future occupational estimates for all priority transportation
Results allowed for a more accurate assessment of workforce trends across disciplines
Transportation expenditures of $19 billion/year
~355,000 workers employed in Transportation & Warehousing Occupations
Multimodal (maritime (AK, HI, WA), rail (NE), pipeline (WY, ND)
Highways dominate regional transportation expenditures (72%)
84% of regional highways are rural
36% of land mass; 6% of U.S. population
Rural and Small Urban (low population densities)
Training access challenges in rural communities
Tight Labor Markets (low unemployment rates)
Energy sector development
Tribal and federal lands
warehousing employees
states include:
and 31% of functionally
miles
tonnage
102,330 (22.4% change) 103,600 (23.9% change) 15,060 14.1% change) 13,540 (16.8% change) 20,270 (21% change) 112,720 (22.6% change) 75,060 (16.8% change) 53,320 (14.7% change) 496,580 (19.5% change) 1,280 (11.3% change) 34,200 (15.5% change) 47,230 (33.7% change) 704,130 (20.1% change) 83,630 83,630 13,200 11,590 16,750 91,940 64,290 46,500 415,400 1,150 29,610 35,330 586,480 100,000 200,000 300,000 400,000 500,000 600,000 700,000 800,000 Computer and Information Systems Managers Civil Engineers Surveyors Urban and Regional Planners Surveying and Mapping Technicians Operating Engineers and Other Construction Equipment Operators Bus and Truck Mechanics and Diesel Engine Specialists Bus Drivers, Transit and Intercity Heavy and Tractor‐Trailer Drivers Traffic Technicians Transportation, Storage, and Distribution Managers Logisticians Laborers and Freight, Stock, and Material Movers, Hand
EMPLOYMENT FORECAST FOR PRIORITY OCCUPATIONS IN THE SOUTHWEST
# of Employees, 2012
11
+82,026 +63,590 +36,510 +31,796 +15,611 +10,913 +8,770 +6,068 +5,212 +4,627 +182
Heavy & tractor-trailer drivers General laborers Storage & distribution managers Construction laborers Customs brokers Light truck or delivery drivers Software developers Civil engineers Logisticians Bus & truck mechanics Vessel operators & mates
Baccalaureate ++ Technical Education
Industry forecasts based
Projected growth Projected retirements Existing
Industry game changers new
Organizational trends/new mandates New technologies Streamlined
Right- sized, skilled workforce
Lack of skill Lack of job applicants Poor retention New job requirements
Shift from “problem/issue” focus to “possibilities” and potential solutions
Use networks to gather resources on great programs that already exist
Build action-oriented partnerships
Use networks to share, scale, replicate or leverage
STRATEGIC ACTION PLANS
career awareness programs
events, opportunities, webinars, and Center activities
newsletters and other network communications
Priorities Reports, Phase 1
Job Needs and Priorities, Phase 2 Strategic Action Plans and Report
webinar series
WEST Steve Albert
Montana State University
stevea@coe.montana.edu (406) 994-6114 wrtwc.org
SOUTHWEST Tom O’Brien
California State University, Long Beach
swtwc.org
MIDWEST Teresa M. Adams
University of Wisconsin- Madison
mtwc.org
SOUTHEAST Stephanie S. Ivey
The University of Memphis
memphis.edu/setwc
NORTHEAST Glenn McRae
University of Vermont
netwc.net
Challenges include differing expectations between current ways
career models.
change
that frustrate enthusiastic workers
desk” approach to work
Create a culture that values and engages people. Empower HR -- Promote innovation by supporting a “let’s try it” approach to recruiting, retaining, and rewarding employees. Reduce layers of decision making that give employees more say in setting priorities and defining direction. Use ongoing communication and feedback systems to ensure that employees are well informed about organizational priorities and issues affecting them.
synonyms:
Source: Google.com
2 in 3 Millennials expect to leave by 2020
Deloitte Millennial Survey http://www2.deloitte.com/global/en/pages/about-deloitte/articles/gx- millennials-one-foot-out-the-door.html
Peer Exchange
52% 48%
Survey Responses Completed Incomplete
1 2 3 4 5 Alabama Alaska Arizona Arkansas Connecticut Idaho Indiana Iowa Maine Michigan Minnesota Mississippi Nevada New Jersey North Dakota Oklahoma Rhode Island Tennessee Texas Utah Virginia Washington West Virginia Wyoming
Total Responses Per State
500 1,000 1,500 2,000 2,500 3,000 3,500 4,000
What is the total number of full‐time equivalent positions employed by your state DOT?
2000 4000 6000 8000 10000 12000 Texas Virginia Washington West Virginia
What is the total number of full‐time equivalent positions employed by your state DOT? (continued)
5 10 15 20 25 30 35
How many full‐time equivalent Human Resources positions does your DOT employ?
20 40 60 80 100 120 140 160 Texas Virginia Washington West Virginia
How many full‐time equivalent Human Resources positions does your DOT employ? (continued)
29.9 64.5 80 82.2 90.2 92 93.9 94 126.8 133.6 134.6 137.3 140.9 154.5 156.3 161.5 180 195.2 266.7
Total Employees Per HR Staff
50 100 150 200 250 300 350 400 450 500
How many hires does your HR department perform per year on average?
200 400 600 800 1000 1200 Alaska Indiana Texas Virginia Washington West Virginia
How many hires does your HR department perform per year on average? (continued)
23.1 9.8 12.2 7.6 4.4 19.2 17.0 16.7 4.4 6.1 8.0 10.0 7.8 14.7 18.0 21.0
Total Hires Per Year Per HR Staff
$566,926 $3,760 $929 $12,074
Average Breakdown of Annual Investment the DOT Spends on Recruitment
Staff Travel Marketing/Advertising Other
Other Expenses Include: Job Fairs DDI Participant Guides
States Represented: Alaska Arizona Arkansas Connecticut North Dakota Oklahoma Washington
50% 50%
Does your DOT track where applicants learned about the opening?
Yes No States Represented: Alaska Arizona Arkansas Connecticut Indiana Mississippi Nevada North Dakota Oklahoma Rhode Island Texas Utah Virginia Washington West Virginia Wyoming
44% 56%
Does your DOT track where successful hires learned about openings?
Yes No States Represented: Alaska Arizona Arkansas Connecticut Indiana Mississippi Nevada North Dakota Oklahoma Rhode Island Texas Utah Virginia Washington West Virginia Wyoming
22.9% 0.3% 4.3% 45.8% 0.5% 0.0% 12.8%
Percentage of Successful Recruits Learned About the Opening By:
Word of Mouth Social Media Job Fair On‐line Posting Job Service Newspaper, Poster or Other Print Advertising Other
States Represented: Arkansas Indiana North Dakota
53% 47%
Does your HR department have performance measures in place to evaluate the department’s operations?
Yes No States Represented: Alaska Arizona Arkansas Connecticut Indiana Iowa Mississippi Nevada New Jersey North Dakota Oklahoma Rhode Island Tennessee Texas Utah Virginia Washington West Virginia Wyoming
be more of a start point rather than a one‐stop shop.
numbers; our mobile users are increasing significantly over the past 2 years.
as a recruiting platform
extremely difficult to find and attract.
enough applicants for IT positions because we don't currently pay enough.