
SLIDE 1
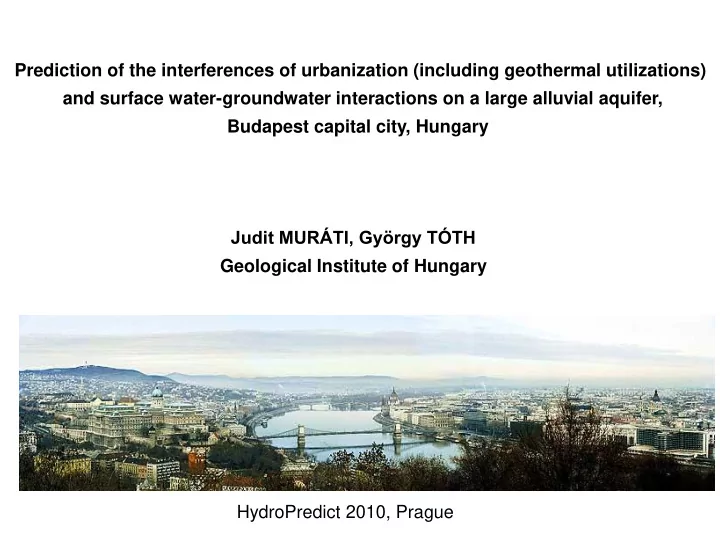
Prediction of the interferences of urbanization (including geothermal utilizations) and surface water-groundwater interactions on a large alluvial aquifer, Budapest capital city, Hungary Judit MURÁTI, György TÓTH Geological Institute of Hungary HydroPredict 2010, Prague