
SLIDE 1
prepared by Investor Relations department BTS Group Holdings PCL
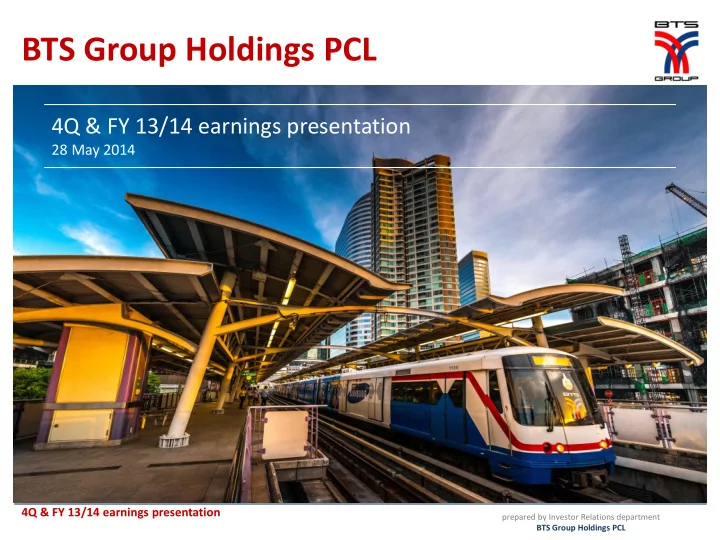
BTS Group Holdings PCL
4Q & FY 13/14 earnings presentation
28 May 2014
4Q & FY 13/14 earnings presentation
BTS Group Holdings PCL 4Q & FY 13/14 earnings presentation 28 - - PowerPoint PPT Presentation
BTS Group Holdings PCL 4Q & FY 13/14 earnings presentation 28 May 2014 4Q & FY 13/14 earnings presentation prepared by Investor Relations department BTS Group Holdings PCL Disclaimer Investment involves risk. Prospective should
prepared by Investor Relations department BTS Group Holdings PCL
28 May 2014
4Q & FY 13/14 earnings presentation
prepared by Investor Relations department BTS Group Holdings PCL
Investment involves risk. Prospective should understand the characteristics of Securities and study information about BTS Group Holdings Public Company Limited (the “Company”) before making a decision to invest in Securities. This presentation is for information purposes only and is intended only for the initial direct attendee of the presentation. It may not be reproduced or redistributed to any other person. It shall not and does not constitute either an offer to purchase or buy or a solicitation to purchase or buy or an offer to sell or exchange
inducement to enter into investment activity. No part of this presentation, nor the fact of its existence, should form the basis of, or be relied on in connection with, any contract or commitment or investment decision whatsoever. No representation, warranty or undertaking, express or implied, is made as to, and no reliance should be placed on, the fairness, accuracy, completeness or correctness of the information or the opinions contained herein. This presentation is not to be relied upon in any manner as legal, tax or any other advice and shall not be used in substitution for the exercise of independent judgment and each person made aware of the information set-forth hereof shall be responsible for conducting its own investigation and analysis of the information contained herein. Except where otherwise indicated, the information provided in this presentation is based on matters as they exist as of the date stated or, if no date is stated, as of the date of preparation and not as of any future date, and the information and opinions contained herein are subject to change without notice. None of the Company nor any of its subsidiaries accepts any obligation to update
Company or any of its subsidiaries or any of their respective directors, officers, employees or agents shall have any liability whatsoever (in negligence or otherwise) for any loss howsoever arising from any use of this presentation or its contents or otherwise arising in connection with the presentation and any and all such liability is expressly disclaimed. The information contained herein must be kept strictly confidential and may not be reproduced or redistributed in any format without the express written approval of the Company. Some statements made in this presentation are forward-looking statements, which are subject to various risks and uncertainties. These include statements with respect to the Company’s corporate plans, strategies and beliefs and other statement that are not historical facts. These statement can be identified by the use of forward-looking terminology such as “may”, “will”, “expect” , “intend”, “estimate”, “continue”, “plan” or other similar words. The statements are based on the assumptions and beliefs of the Company’s management in light of the information currently available to the Company. These assumptions involve risks and uncertainties which may cause the actual results, performance or achievements to be materially different from any future results, performance or achievements expressed or implied by such forward-looking statements. Nothing in this Presentation is, or should be relied
4Q & FY 13/14 earnings presentation 2
prepared by Investor Relations department BTS Group Holdings PCL
Section
BTSG 4Q & FY 13/14 FINANCIAL PERFORMANCE
Section
Section
BUSINESS UPDATES BTSGIF 4Q & FY 13/14 FINANCIAL PERFORMANCE (separate presentation)
APPENDICES
3 4Q & FY 13/14 earnings presentation
prepared by Investor Relations department BTS Group Holdings PCL
Cash Balance of THB 7.86bn Current Investments of THB 20.40bn Long term Investments of THB 3.07bn
IMPROVED PROFITABILITY YoY BALANCE SHEET STRENGTH
margin rose to 25.6% (9.7% in FY 12/13)
BTS DIVIDEND YIELD** 7.34%
BTS DAILY TRADED VALUE (LTM) (as of 15 May 2014) THB 539.7mn ($16.6mn) MEDIA BUSINESS RECORD PROFITABILITY Net profit +27% YoY
(against Thai adex spending decline of 0.9%)
NEW CORE RIDERSHIP & REVENUE RECORD: 214.7mn TRIPS (increased +8.9% YoY) AVERAGE FARE (increased +6.5% YoY) SET50 DIVIDEND YIELD (LTM)*** 3.29%
4 4Q & FY 13/14 earnings presentation Section 1: BTSG 4Q & FY 13/14 Financial Performance
Beijing bid submission 7 FEB 2014 Silom line extension opening 5 DEC 2013 17 APR 2013 Fare Increase BTSGIF transaction BTS-W3 issuance 1 JUN 2013 1 NOV 2013
SIGNIFICANT EVENTS IN 2013/14
** Subject to shareholders’ approval of the final dividend of THB 0.21per share. Dividend yield based on share price as of date prior to Board of Directors’ approval of relevant dividend payment *** Sum of the gross DPS that have gone ex-dividend over the past 12 months, divided by stock price as of 22 May 2014
THB 7BN IN FY 14/15 & THB 8BN IN FY 15/16
* Excludes sinking fund
prepared by Investor Relations department BTS Group Holdings PCL
MASS TRANSIT Results highly resistant to economic and political volatility All Targets/ Guidance Achieved
Target
P
P MEDIA Resilient performance in face of uncertain environment Record Revenue & Net Profit
O
*Total Thai AdSpend declined 0.9% in 13/14
PROPERTY Revenue growth driven by condominiums transferred and improved hotel performance Record Revenue
Target
SERVICES
5 4Q & FY 13/14 earnings presentation Section 1: BTSG 4Q & FY 13/14 Financial Performance
Revenue contribution to Group of 4.6% (from 1.2%) driven by Restaurants (Chef Man) and rabbit card expansion Record Revenue & Target Achieved
Target
prepared by Investor Relations department BTS Group Holdings PCL
10,375 8,767 (3,703) 327 1,489 278 2012/13 Mass transit Media Property Services 2013/14
12% 103%
(THB mn)
231%
OPERATING REVENUE COMPARISON (YoY)
Income Statement (THB mn) 4Q 13/14 4Q 12/13 % YoY 3Q 13/14 % QoQ FY 13/14 FY 12/13 % YoY Operating Revenues1 1,776 3,024 (41.3%) 2,116 (16.0%) 8,767 10,375 (15.5%) Gross operating profits 938 1,451 (35.4%) 1,179 (20.5%) 4,657 5,058 (7.9%) Operating EBITDA2 652 1,403 (53.5%) 875 (25.4%) 3,423 5,081 (32.6%) Recurring net profit – before MI 643 201 220.2% 563 14.2% 2,612 1,030 153.5% Accounting EBITDA3 906 1,437 (36.9%) 1,301 (30.3%) 18,533 6,186 199.6% Net income (loss)4 411 66 523.0% 449 (8.5%) 12,645 1,719 635.8% Gross operating profit margin (%) 52.8% 48.0% 55.7% 53.1% 48.8% EBITDA margin (%) 46.4% 46.2% 54.0% 79.5% 53.3% Recurring net profit margin (%) 29.8% 6.5% 22.5% 25.6% 9.7% Operating EBITDA margin (%) 36.9% 46.4% 41.3% 39.0% 49.0%
P&L SNAPSHOT
26% Mass Transit 36% Media 33% Property 5% Services
FY 13/14 OPERATING REVENUE BREAKDOWN
1 operating revenue of 4 BUs & share of net profit from BTSGIF 2 excluding interest income 3 including profit from discontinued operation 4 to equity holders of the parent
6 4Q & FY 13/14 earnings presentation Section 1: BTSG 4Q & FY 13/14 Financial Performance
prepared by Investor Relations department BTS Group Holdings PCL
3,513 7,863* 3,218 12,180 (11,048) Beginning cash (31/3/13) CFO CFI CFF Ending cash (31/3/14)
(THB mn)
* excluding BTSC sinking fund and THB 23.47bn liquid investments
7 4Q & FY 13/14 earnings presentation Section 1: BTSG 4Q & FY 13/14 Financial Performance
Abstracts PHY transferred, higher interest income and reduced interest expense Proceeds from sale of net fare-box revenue to BTSGIF and treasury management Debt repayment and dividend payment
prepared by Investor Relations department BTS Group Holdings PCL 316 880 1,120 1,492 3,545 4,297 4,896 5,677
FY 10/11 FY 11/12 FY 12/13 FY 13/14
O&M (THB mn) Farebox (THB mn)
8
HISTORICAL OPERATING REVENUE
HISTORICAL AVG FARE AND RIDERSHIP
KEY FACTORS OPERATING PERFORMANCE
stations of the Silom line (Bang Wa) extension and iii) new carriages into service (all 4-car trains across the network)
additional service income from the Silom line extension which
costs related to higher O&M revenue and iii) depreciation
as costs and SG&A increased less than the revenue growth
Mass transit (THB mn) 4Q 13/14 4Q 12/13 YoY 3Q 13/14 QoQ FY 13/14 FY 12/13 YoY Revenue 1,985 1,585 25% 1,811 10% 7,169 6,016 19% Fare-box revenue 1,544 1,263 22% 1,443 7% 5,677 4,896 16% Other revenue 442 322 37% 367 20% 1,492 1,120 33% Costs of revenue 1,025 800 28% 949 8% 3,743 3,115 20% Gross profit 960 785 22% 862 11% 3,426 2,901 18% Operating EBITDA 1,315 1,055 25% 1,183 11% 4,726 3,897 21% Gross margin (%) 48.4% 49.5% 47.6% 47.8% 48.2% Operating EBITDA margin (%) 66.2% 66.5% 65.4% 65.9% 64.8%
4Q & FY 13/14 earnings presentation Section 1: BTSG 4Q & FY 13/14 Financial Performance
48.0 46.4 49.4 50.3 51.1 50.3 53.5 53.9 57.1 24.5 24.5 25.1 25.0 24.7 25.3 26.5 26.8 27.0
4Q 11/12 1Q 12/13 2Q 12/13 3Q 12/13 4Q 12/13 1Q 13/14 2Q 13/14 3Q 13/14 4Q 13/14
Ridership (mn trips) Average fare (THB/trip)
* Includes 100% of fare-box revenue and O&M
prepared by Investor Relations department BTS Group Holdings PCL
5% Office Buildings & Others 42% Modern Trade 53% BTS - Related
9
Revenue increased 20.3% YoY to THB 1.7bn from i) increase in train capacity (35 C-cars), ii) introduction of new digital media, iii) increase in rent for long-term contracts of merchandising space and iv) increase in occupancy of small rental shops on the stations.
Revenue increased 3.7% YoY to THB 1.3bn from i) increase in
streaming technology in Big C branches nationwide
Revenue increased 0.2% YoY to THB 166mn, driven by i) higher sales from additional office buildings and ii) full year recognition of the rights to advertise in CU bus system
OPERATING REVENUE BREAKDOWN OPERATING PERFORMANCE
Media (THB mn) 4Q 13/14 4Q 12/13 YoY 3Q 13/14 QoQ FY 13/14 FY 12/13 YoY Revenue 632 683 (7%) 798 (21%) 3,121 2,795 12% Costs of revenue 290 288 1% 287 1% 1,231 1,142 8% Gross profit 342 396 (14%) 512 (33%) 1,890 1,653 14% Operating EBITDA 271 326 (17%) 435 (38%) 1,580 1,386 14% Gross margin (%) 54.1% 57.9% 64.1% 60.5% 59.1% Operating EBITDA margin (%) 42.8% 47.7% 54.4% 50.6% 49.6%
HISTORICAL OPERATING REVENUE (THB mn)
KEY FACTORS
FY 13/14
300 345 370 355 467 523 503 465 637 725 749 683 843 847 798 632 1Q 10/11 2Q 10/11 3Q 10/11 4Q 10/11 1Q 11/12 2Q 11/12 3Q 11/12 4Q 11/12 1Q 12/13 2Q 12/13 3Q 12/13 4Q 12/13 1Q 13/14 2Q 13/14 3Q 13/14 4Q 13/14
4Q & FY 13/14 earnings presentation Section 1: BTSG 4Q & FY 13/14 Financial Performance
prepared by Investor Relations department BTS Group Holdings PCL
90 134 185 154 154 152 111 210 155 179 401 710 950 863 685 436
1,643 1,849 554
1Q 10/11 2Q 10/11 3Q 10/11 4Q 10/11 1Q 11/12 2Q 11/12 3Q 11/12 4Q 11/12 1Q 12/13 2Q 12/13 3Q 12/13 4Q 12/13 1Q 13/14 2Q 13/14 3Q 13/14 4Q 13/14
70% Residential Commercial & Others 30%
10
OPERATING REVENUE* BREAKDOWN OPERATING PERFORMANCE
Property* (THB mn) 4Q 13/14 4Q 12/13 YoY 3Q 13/14 QoQ FY 13/14 FY 12/13 YoY Operating Revenue 436 710 (39%) 685 (36%) 2,934 1,445 103% Costs of revenue 255 441 (42%) 403 (37%) 1,756 920 91% Gross profit 181 269 (33%) 281 (36%) 1,178 524 125% Operating EBITDA 64 119 (46%) 149 (57%) 632 117 441% Gross margin (%) 41.5% 37.9% 41.1% 40.2% 36.3% Operating EBITDA margin (%) 14.7% 16.7% 21.8% 21.5% 8.1%
HISTORICAL OPERATING REVENUE* (THB mn)
KEY FACTORS
FY 13/14
4Q & FY 13/14 earnings presentation Section 1: BTSG 4Q & FY 13/14 Financial Performance
Residential and Commercial Property
mainly from 610 transferred units of Abstracts Phahonyothin Park
862mn mainly from Eastin Grand Hotel operations
THB 2.5bn from costs and expenses related to transferred units of Abstracts Phahonyothin Park and costs and expenses related to Eastin Grand Hotel
THB 1,643 Proceeds from sale of Kamala
* Transactions related to Chef Man Restaurants were reclassified from Property business to Services business in 4Q 13/14 and applied retrospectively since 2Q 12/13
THB 1,849 Proceeds from sale of Nana THB 554 Proceeds from sale of non-core land
prepared by Investor Relations department BTS Group Holdings PCL 9 25 31 35 33 33 36 1 6 24 45 45 78 104 109 108
1Q 10/11 2Q 10/11 3Q 10/11 4Q 10/11 1Q 11/12 2Q 11/12 3Q 11/12 4Q 11/12 1Q 12/13 2Q 12/13 3Q 12/13 4Q 12/13 1Q 13/14 2Q 13/14 3Q 13/14 4Q 13/14
rabbit 35% Carrot 10% 55% Chef Man HHT 0%
11
OPERATING REVENUE* BREAKDOWN OPERATING PERFORMANCE
Services* (THB mn) 4Q 13/14 4Q 12/13 YoY 3Q 13/14 QoQ FY 13/14 FY 12/13 YoY Revenue 108 45 138% 109 0% 399 121 231% Costs of revenue 64 45 43% 50 28% 207 140 48% Gross profit 44 N/A 59 (25%) 192 (20) N/A Operating EBITDA (11) (29) N/A 11 (198%) 33 (99) N/A Gross margin (%) 40.8% 0.9% 53.8% 48.0% N/A Operating EBITDA margin (%) N/A N/A 10.4% 8.3% N/A
HISTORICAL OPERATING REVENUE* (THB mn)
KEY FACTORS
FY 13/14
4Q & FY 13/14 earnings presentation Section 1: BTSG 4Q & FY 13/14 Financial Performance
Revenue increased by THB 278.5mn YoY to THB 399mn from i) revenue from Chef Man Restaurants of THB 220mn and ii) the growth in royalty fee from the co-branded Rabbit card between the Company and business partner
Costs & SGA increased by 59.6% YoY to THB 433mn (cost THB 207mn and SG&A THB 226mn). Key items were mainly from staff costs, food & beverage cost at Chef Man Restaurants and depreciation expenses for hardware, software and machines.
* Transactions related to Chef Man Restaurants were reclassified from Property business to Services business in 4Q 13/14 and applied retrospectively since 2Q 12/13
prepared by Investor Relations department BTS Group Holdings PCL
50,501.7 59,762.3 7,767.3 8,364.6 9,021.9 8,630.2 31-Mar-13 31-Mar-14 15,072.6 39,530.3 52,218.4 37,226.8 31-Mar-13 31-Mar-14
LIABILITIES AND EQUITY BREAKDOWN (THB MN) ASSET BREAKDOWN (THB MN) KEY RATIOS
Non-current assets Current assets 22% 78% 48% 52% 67,291 76,757 Non-current liabilities Current liabilities Equity 11% 78% 11% 67,291 76,757 75% 13% 12%
FY 13/14: (0.02)x FY 12/13: 0.17x
Net Debt to Equity Net Debt to Operating EBITDA
FY 13/14: (0.35)x FY 12/13: 1.66x FY 13/14: 5.43x FY 12/13: 4.07x
Interest Coverage
FY 13/14: 4.31x FY 12/13: 5.79x
Current Ratio
12 4Q & FY 13/14 earnings presentation Section 1: BTSG 4Q & FY 13/14 Financial Performance
prepared by Investor Relations department BTS Group Holdings PCL
Section
BTSG 4Q & FY 13/14 FINANCIAL PERFORMANCE
Section
Section
BUSINESS UPDATES BTSGIF 4Q & FY 13/14 FINANCIAL PERFORMANCE (separate presentation)
APPENDICES
13 4Q & FY 13/14 earnings presentation
prepared by Investor Relations department BTS Group Holdings PCL
GREEN LINE EXTENSIONS UPDATE
2 1
BEARING-SAMUT PRAKARN:
2015
1
MO CHIT-SAPHAN MAI-KU KHOT:
15 Oct 2013
MRTA)
2019 (per MRTA)
2
14 4Q & FY 13/14 earnings presentation Section 2: Business Updates
Source: Mass Rapid Transit Authority of Thailand (MRTA)
prepared by Investor Relations department BTS Group Holdings PCL
JAN 2014 Project already approved by Bangkok governor Hire consultant for EIA & feasibility study to determine Phase I route MAR 2014 Feasibility report approval process by Office of National Environment Board
(ส ำนักงำนคณะกรรมกำรสิ่งแวดล้อมแห่งชำติ)
JAN 2015 OPEN FOR BIDDING (both Civil and E&M) JULY 2015 Construction starts OCT 2015 Operation year 2018 10 months 6 months 3 months 2 years (at least) construction time
PROJECT DETAILS ESTIMATED TIMELINE
WATCHARAPHON – RAMA 9 BRIDGE
Source: Traffic and Transportation Department, BMA WATCHARAPHON RAMA 9 BRIDGE
15 4Q & FY 13/14 earnings presentation Section 2: Business Updates
prepared by Investor Relations department BTS Group Holdings PCL
JAN 2014 (Latest 2015) Awaiting project approval by Bangkok governor Hire consultant for EIA & feasibility study MID-2014 (Mid-2015) Feasibility report approval process by Office of National Environment Board
(ส ำนักงำนคณะกรรมกำรสิ่งแวดล้อมแห่งชำติ)
END OF 2014 (End of 2015) Route approval process by Cabinet MID-2015 (Mid-2016) OPEN FOR BIDDING (both Civil and E&M) EARLY 2016 (Early 2017) Operation year 2018 (2019) 8 months 6 months 6 months 2 years construction time
PROJECT DETAILS ESTIMATED TIMELINE
BANG WA – TALING CHAN
Source: Traffic and Transportation Department, BMA TALING CHAN BANG WA
16 4Q & FY 13/14 earnings presentation Section 2: Business Updates
prepared by Investor Relations department BTS Group Holdings PCL
17 4Q & FY 13/14 earnings presentation Section 2: Business Updates
MASS TRANSIT AWARDS
ENVIRONMENTAL MANAGEMENT SYSTEMS CERTIFICATE ACCREDITED BY BUREAU VERITAS CERTIFICATION (THAILAND) LTD. (BV).
ISO 14001:2004 ISO 9001:2008
QUALITY MANAGEMENT SYSTEMS CERTIFICATE ACCREDITED BY BUREAU VERITAS CERTIFICATION (THAILAND) LTD. (BV).
LLOYDS REGISTER RAIL
LLOYDS REGISTER RAIL’S BEST PRACTICE MODEL IMPLEMENTATION.
OHSAS 18001:2007
OCCUPATIONAL HEALTH AND SAFETY ZONE CERTIFICATE ACCREDITED BY BUREAU VERITAS CERTIFICATION (THAILAND) LTD. (BV).
CONSUMER PROTECTION THAILAND CALL CENTER AWARD 2014
BTS HOTLINE WAS AWARDED THE CONSUMER PROTECTION THAILAND CALL CENTER AWARD 2014 FROM THE OFFICE OF THE CONSUMER PROTECTION BOARD
prepared by Investor Relations department BTS Group Holdings PCL
635.5 732.4 724.6 98 139.5 173.8
2011 2012 2013 Operating revenue (THB mn) Net Profit (THB mn)
4Q & FY 13/14 earnings presentation Section 2: Business Updates 18
Revenue structure Proven Track Record of Revenue and Net profit 2013 Dividend Yield of 5.6% (based on share price of THB 9.00) 2013 Total operating revenue: THB 724.6mn
NEW CAPACITY IN BTS-RELATED MEDIA MACO’S FINANCIAL PERFORMANCE
Share information (as of 27 May 2014)
Stock code: MACO Market capitalisation (THB mn): 3,069.2 Outstanding shares (mn shares): 300.8
Products Location/Area
1 Billboard Bangkok & vicinity / 170 billboard / 74,635 sqm 2 Street Furniture Bangkok / 2,217 sqm 3 Transit City grip light express, BTS walkway & Mo Chit station / 419 sqm 4 Made to order & Event n/a MACO space: Billboard, Street furniture and Transit Non MACO space: Made to order and Production/Printing
Billboard, 53.5% Transit, 7.5% Production & Event, 11.5% Street furniture, 27.5%
Source: MACO
prepared by Investor Relations department BTS Group Holdings PCL
4Q & FY 13/14 earnings presentation Section 2: Business Updates 19
INVESTMENT HIGHLIGHTS BENEFITS TO VGI
at THB 9.00)
Directors
SYNERGY MAJOR SHAREHOLDERS POST TRANSACTION
bundling media packages from VGI and MACO
experienced management team
Major shareholder post transaction (% out of all shares) 1. VGI Global Media PCL 24.43% 2. Tansalarak Group 10.05% 3. Maneerattanporn Group 8.40% 4. Meeprasertsakul Group 6.51% Total major shareholders 49.93%
prepared by Investor Relations department BTS Group Holdings PCL
4Q & FY 13/14 earnings presentation Section 2: Business Updates 20
PHAR PARTNERSHIP WARRANT ISSUANCE: KEY TERMS & CONDITIONS
Partner Phar Partnership, Thailand (exclusive media sales agency of Air Asia) Rights Sales agent for Air Asia planes
Contract Length 3 years TICKER VGI-W1 TERMS 4 Years EX-RIGHTS DATE 9 July 2014 EXERCISE PERIOD Quarterly basis WARRANT PRICE Free ALLOCATION To existing shareholders at the ratio
Up to 857,993,407 Units EXERCISE RATIO 1 VGI-W1 to 1 ordinary share of VGI EXERCISE PRICE THB 14.00
* Matter is subject to shareholder approval of AGM on 3 July 2014
RATIONALE
Expected maximum proceeds THB 12,011,067,698
prepared by Investor Relations department BTS Group Holdings PCL
Others 14%
RESIDENTIAL PROPERTY
FY 13/14 Commercial Property Revenue:
THB 862mn
COMMERCIAL PROPERTY
Eastin Grand Sathorn 56% U-Hotels 9% Thana City Golf 22% Presold (as of 31 Mar 14): 89%
LOCATION: 250M FROM NEW BTS STATION SITE AREA: 33,420 SQM (20-3-55 RAI) LAND TENURE: FREEHOLD AVERAGE SALE PRICE: THB 76,400 PER SQM TDC: THB 2,527MN TRANSFERRED: 80% (as of 31 Mar 14)
ABSTRACTS PROJECT – PHAHONYOTHIN PARK
COMMERCIAL PROPERTY REVENUE BREAKDOWN
Opened: Oct 12 FY 13/14 average occupancy rate: 80%
LOCATION: SATHORN, BANGKOK SITE AREA: 16-0-81 RAI LAND TENURE: LEASEHOLD, 30 YEARS LEASE CONTRACT WITH TREASURY DEPT. SIZE: 3 FLR, 86 ROOMS CONSTRUCTION PROGRESS: 55% (as of 31 Mar 14) EXPECTED OPENING: NOV 2014 TDC: THB 690MN LOCATION: SATHORN, BANGKOK, DIRECT ACCESS TO BTS SURASAK SITE AREA: 3,828 SQM (2-1-57 RAI) LAND TENURE: FREEHOLD SIZE: 33 FLR, 396 ROOMS TYPE: Business/Leisure Grand Hotel TOTAL NLA: 17,561 SQM
EASTIN GRAND SATHORN – 4 Stars U SATHORN HOTEL – 4 Stars
21 4Q & FY 13/14 earnings presentation Section 2: Business Updates
prepared by Investor Relations department BTS Group Holdings PCL
22 4Q & FY 13/14 earnings presentation Section 2: Business Updates
PROJECT SUMMARY
LOCATION: PAK CHONG DISTRICT, NAKORNRATCHASIMA PROVINCE SITE AREA: 6,556 SQM (16-1-56 RAI) LAND TENURE: FREEHOLD TYPE: 6 CONDOMINIUMS, 1 CLUB HOUSE AND SHOP 180 UNITS/CONDOMINIUM; 60 SQM & 80 SQM/UNIT NFA: 12,000 SQM CONSTRUCTION PROGRESS: 0% (as of 31 Mar 14) EXPECTED COMPLETION: 2016 (FIRST PHASE)
PROJECT DEVELOPMENT
FINANCIALS
32% 21% 47%
Equity Loan Sales Proceeds
SOURCE OF FUNDS
prepared by Investor Relations department BTS Group Holdings PCL
23 4Q & FY 13/14 earnings presentation Section 2: Business Updates
BTSG acquired 20% of shares in Nuvo Line (project owner of Abstracts Phahonyothin Park)
PURPOSE
Harbor Advisors Pte. Ltd. (Pacific Harbor).
(internal account) is THB 387.2 million).
IMPACT TO FINANCIAL STATEMENTS
FY 14/15:
TRANSACTION
Book Value: THB 387.2mn Adjusted Book Value*: THB 408.0mn Acquisition cost: THB 227.5mn Acquisition cost / Adj BV*: 56%
*Adjusted to include profit from non-transferred units of Tower A, but excluding any adjustment to land value or profit from Tower B & C.
prepared by Investor Relations department BTS Group Holdings PCL
COMMON TICKETING SYSTEM
>1.0 >1.2 >1.5 >1.8 >2.1 >2.5 2.0 DEC 12 MAY 13 JUL 13 OCT 13 DEC 13 MAR 14 TARGET
NUMBER OF RABBIT CARDS mPAY RABBIT SIM
million cards Exceeded target
and Planning (OTP), BTS, BMCL and BSS on 11 Dec 2013 to develop common ticketing system
Link
Smart Rabbit Card to preset amount when card balance is lower than the threshold
24 4Q & FY 13/14 earnings presentation Section 2: Business Updates
AUTO TOP-UP
prepared by Investor Relations department BTS Group Holdings PCL
Section
BTSG 4Q & FY 13/14 FINANCIAL PERFORMANCE
Section
Section
BUSINESS UPDATES BTSGIF 4Q & FY 13/14 FINANCIAL PERFORMANCE (separate presentation)
APPENDICES
25 4Q & FY 13/14 earnings presentation
prepared by Investor Relations department BTS Group Holdings PCL
200 600 1,000 190 10 Mass transit Media Property* Services BTS Group
4Q & FY 13/14 earnings presentation Appendix 1: 2014/15 BTS Group Targets and CAPEX 26
BTS GROUP CAPEX (THB mn) BTS GROUP TARGETS
FY 14/15 TOTAL CAPEX*: THB 2,000MN
* excludes real estate development cost
MASS TRANSIT MEDIA
5 – 8% Ridership Growth 1% Effective Fare Increase 13 – 17% Revenue Growth
PROPERTY
THB 800mn Residential Property Revenue THB 1,000mn Commercial Property Revenue
SERVICES
3.5mn Rabbit Cards 17% O&M Revenue Growth 2014/15 BTSGIF CAPEX is expected to be approx. THB 180mn (not included in BTS Group CAPEX)
prepared by Investor Relations department BTS Group Holdings PCL
PROJECT DETAILS INVESTMENT DETAILS
subsidiary of CITIC Group Corporation)
projects: Iran Teheran Metro and Algeria East-to- West Expressway
BEIJING SUBWAY LINE 16
TENDER INFORMATION
TENDER BACKGROUND
PPP INVESTMENT SCHEME
27 4Q & FY 13/14 earnings presentation Appendix 2: Beijing Subway Line 16
prepared by Investor Relations department BTS Group Holdings PCL
Line 16
Map Source: Wikipedia
28 4Q & FY 13/14 earnings presentation Appendix 2: Beijing Subway Line 16
prepared by Investor Relations department BTS Group Holdings PCL
SECTOR: Out-of-Home media sector STAKE: Influential or controlling GEOGRAPHY: Thailand focus, selective ASEAN (overseas require strong local partner) RETURN CRITERIA: Minimum IRR or payback period RATIONALE:
segment (to be the leader in OHM)
29 4Q & FY 13/14 earnings presentation Appendix 3: VGI’s Acquisition / Investment Policy
prepared by Investor Relations department BTS Group Holdings PCL
3.09% 3.18% 2.19% 2.40%
0.00% 0.50% 1.00% 1.50% 2.00% 2.50% 3.00% 3.50% Q4 FY13/14 Q3 FY13/14 Average yield (Excluded Sinking fund) MPC Rate
90 bp 78 bp
4Q & FY 13/14 earnings presentation Appendix 4: Treasury Management 30
prepared by Investor Relations department BTS Group Holdings PCL
Address: BTS Group Holdings PCL IR Department 15th Floor, TST Tower, 21 Soi Choei Phuang, Viphavadi-Rangsit Rd., Chomphon, Chatuchak, Bangkok, Thailand 10900 Telephone: +66(0) 2273 8611-15 Email: ir@btsgroup.co.th Fax: +66(0) 2273 8610 Website: www.btsgroup.co.th
31 4Q & FY 13/14 earnings presentation