
SLIDE 1
Bonnie DeVarco - Co-Evolution of Geovisualization and Information Visualization
Bonnie DeVarco - Co-Evolution of Geovisualization and Information - - PowerPoint PPT Presentation
Bonnie DeVarco - Co-Evolution of Geovisualization and Information Visualization Visualization for Connective, Collective, Distributed Intelligence Bonnie DeVarco Media X Visualization Vanguard Collaboratory August 12-14, 2009 Who are we?
Bonnie DeVarco - Co-Evolution of Geovisualization and Information Visualization
Humans in the New Tree of Life…
BabylonianTree of Life, UR, circa 1000 BCE Since ancient times, we have represented humanity and the gods or higher powers as part of a tree of all life. More than three millenia ago in Mesopotamia, the tree of life was depticted on bas reliefs as both a symbolic and literal image capturing the force that connects all life.
1847 depiction of the Yggdrasil Tree of Life - from ancient Norse oral tradition of the Icelandic Prose Edda The tree is one of the oldest and most enduring of humanity‟s symbols. Every sacred practice and religion used tree myths to tell origin stories, from the oral tradition of the Edda to the Tree of Life in the Bible.
Darwin’s notebook sketch of Tree of Life from Darwin’s B Notebook - 1837 Fast forwarding to the nineteenth century, Charles Darwin drew what is considered to be the first “network diagram” in 1837 - his first depiction
Mylophyletic Tree of Organisms - Animalia, Protista, Plantae are dominant branches – Ernst Haeckel 1866 Biologist Ernst Haeckel later codified the “phylogenetic tree” into five branches - as a brilliant artist, he used a natural metaphor to depict the abstract organization of the “tree of life.” At the time, the notion of progress was deeply embedded into the theory of evolution.
Pedigree of Man by Ernst Haeckel – 1891 Haeckel‟s trees were largely shaped by the 19th century‟s hierarchical perception of humanity being the top of the tree of progress, hence,
Modern Tree of Life with Five Kingdoms- Plantae, Fungi, Animalia, Protista, Monera - Robert Whittaker 1969 By the 20th century the tree of life had “Five Kingdoms” - still shaping our understanding life into an anthropomorphic framework by the use of the word, “kingdoms.”
Tree of Life Dendrogram showing 3 branches (3000 genetic sequences) Bacteria, Archaea, Ekarya Based on original by Lynn Margulis circa 1970s In the late 20th century, the plant and animal “kingdoms” were seen to be part of the Eucarya family, the name “kingdoms” had been changed to “domains” and the new tree of life had only three domains, dominated by microscopic life -bacteria and archaea. Humans were now dropped
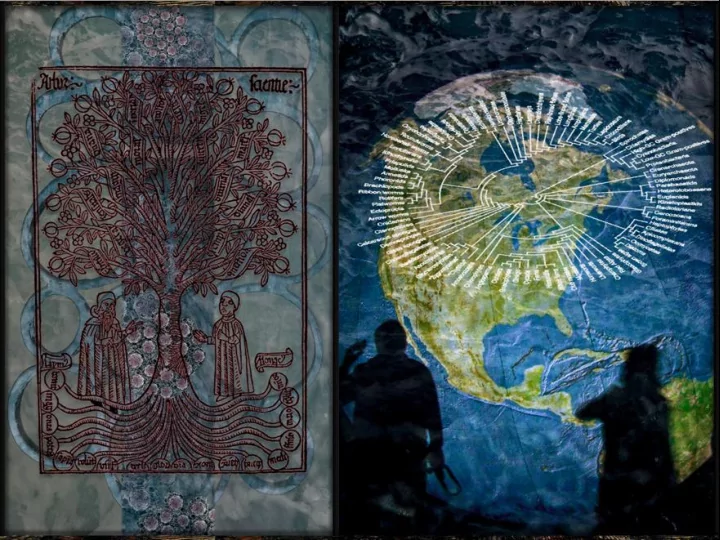
Most Accurate , InteractiveTree of Life – F.D. Ciccarelli (et al), European Molecular Biology Laboratory (EMBL) 2006 A new, interactive tree of life, launched in 2006 showed us a different picture of the relationship of humans to other forms of life and we are reframing the way we look at our place on the planet. With new research by Harvard biologist Bonnie Bassler showing that 99 percent of our bodies are bacteria that actually talk to each other in a chemical language, we are forced to further forced to rethink our place in the tree. Now humans have become a “footnote in the story of bacteria.”
Jesse Tree – Ingebord Psalter 12th Century France Depicting our family tree and our relationships to each other had a similar, hierarchical beginning. Trees showed heritage to be related to royal bloodlines and religious figures. In the Christian religion by the 12th century, emphasis on the connection between the new and the old testament were visually codified in illuminated Jesse Trees. The Jesse tree is envisaged to demonstrate the direct lineage between Jesus and the Prophets of the Old Testament to prove he was a direct descendent. Yet even in biblical Jesse Trees, a pagan female figure, the Cumaean Sybil was also included with the Prophets because she had predicted the birth of a “messiah.”
Tree of Consanguinity – Royal Bloodlines, “Decrets de Gratien” 14th Century France In the tradition of the “Jesse Tree,” royal consanguinity trees perpetuated the royal status of bloodlines by conflating royal blood with religious and royal decree. Consanguinity trees were theoretical diagrams of blood relations showing who may marry and who may inherit.
Queen Victoria’s Family Tree – Daily Telegraph, England 1901 Royal bloodline trees continue and the practice of genealogical research is now becoming more and more common.
In the 20th century, however, anthropologists studying familial relationships around the world through “kinship charts” began to find numerous non-hierarchical and patriarchal familial formations of bloodlines. Cultural practice such as matrilineal and avuncular family structures embarrassed our linear, hierarchical categories.
Social Network Gradiant Graph – Sentinel Visualizer 2005 With the rise of global communities coming out of enhanced synchronous and asynchronous communication via the Internet, our hierarchical trees of human relationship were turning ever more radial. Now we have numerous dynamic graphs of social networks, where we can see “communities” linked by affinity rather than by geography or blood.
Twitter Friend Network “Tweetwheel” 2008 As Web 2.0 applications, social networking and microblogging hubs like Twitter, FriendFeed and Facebook scale out, each and every one of us can now see our affinity “friendship networks” of our contacts in the real and virtual environments. These radial wheels also show how our networks of associations are interconnected and demonstrate how we are all linked by less than “six degrees.”
Porphyry’s Tree 3rd Century CE Humans have also used trees to structure knowledge and organize ontologies. Going back Aristotle‟s categories of logic, Neoplatonist philosopher Porphyry visually codified them into a tree structure later called “Porphyry‟s Tree.” The terms „genus‟ and „species‟ used by Darwin and Haeckel for the Tree of Life actually derived from their use by Porphyry for the relationships between abstract dichotomies (genus differentia) traced to their sources (species).
Arbor Scientiae – Ramon Llull 13th Century The tree of life and Porphyry‟s Tree further influenced medieval thinkers to use trees to identify relationships between aspects of knowledge. In the 6th century, Bishop Isidore of Seville used trees to organize his encyclopedia, “Etymologiae” and Catalan mystic and philosopher Ramon Llull followed suit by using porphyry‟s structure to depict the disciplines of knowledge as a “Tree of Knowledge.”
Tree of Life of Jesus as a moral diagram – Speculum Theologiae 13th Century (Yale University Library) The model of Porphyry‟s Tree was also used in tree diagrams for medieval Religious books. Trees of Virtues and Vices were used to Visually diagram moral stories in the life of Jesus, dichotomizing good and bad.
With his Tree of Proportions and Proportionality, Renaissance geometer and mathematician, Luca Pacioli drew from the older practice of tree diagrams to organize mathematical and geometrical categories in his treatise on the Divine Proportion in 1509. (Leonardo da Vinci illustrated the geometries of this amazing book). Tree of Proportions and Proportionality – Luca Pacioli – De Divina Proportione 1509 (drawn from Nichomachus’ Arithmetica)
Tree of Knowledge – 18th Century Encyclopedia For the next few centuries, trees continued to be used to organize categories of knowledge in encyclopedias.
Cone Tree – Information Visualizer – Xerox Parc from Cone Trees: Animated 3D Visualizations of Hierarchical Information George G. Robertson, Jock D. Mackinlay, & Stuart K. Card 1991
Tree structures continued through the 19th, 20th and 21st century as ways to organize knowledge and even our web site pages. In 1991 Stuart Card introduced dynamism to the tree structure by creating rotatable “cone trees.” These trees moved away from the top down linear structuring, but still remained hierarchical.
Hyperbolic Tree 1996 – Inxight – Ramana Rao, et.al. While at Xerox Parc, three students including Ramana Rao were inspired by the nonperiodic tilings-based artworks of artist M.C. Escher to try to create a dynamic way to visualize a tree of related information or content. Influenced by the hyperbolic math that MC Escher used (which was actually enhanced by Escher‟s discussions with geometer Donald Coxeter while he was working on them) Rao and his colleagues created a browser interface that would enable each chosen node to become the center around which all the other connected nodes would be organized. This became the first hyperbolic tree browser through Rao‟s company, Inxight Software, Inc.
Research & Node Layout: Kevin Boyack and Dick Klavans (mapofscience.com) 2007; Data: Thompson ISI; Graphics & Typography: W. Bradford Paley (didi.com/brad); Commissioned Katy Borner (scimaps.org)
As our knowledge increases on the Internet and access to larger and larger databases of information must be analyzed, classified, accessed and understood, we need new structures to envision broader swaths of knowledge, its creation and evolution. In the first decade of this century, Dr. Katy Borner, Chaomei Chen and Kevin Boyack pioneered a new direction for visualization as applied to “domains of knowledge” mapping the growing domain structure of scientific disciplines. Boyack‟s work with Richard Klavans has undergone almost a decade of refinement of visual metaphors for these structures, becoming less and less hierarchical and more natural. These new science maps are based
Science Related Wikipedian Activity Map, Bruce Herr, Todd Holloway, Katy Borner, Elisha Hardy, Kevin Boyack 2007 These new “knowledge domain” visualizations has turned into a growing genre of “Science Maps.” A new information aesthetics defines the way to show metrics across a broad range of source material. Now that more and more data is being generated collaboratively in the public domain, Using a public wikipedia dump, Borner, et.al. applied knowledge domain visualization methods to understanding how science, math and technology is represented in Wikipedia, where they cluster and where they overlap.
As we move further and further into the dynamism and non-linearity of collaborative information, visualization tools are being created to visualize knowledge “flows” over time through new kinds of visualization such as those by Moritz Stefaner‟s Well-Formed Eigenfactor. A new aesthetics of data visualization is emerging.
Visualization tools and methods enable us to see our shared constructions of knowledge Visualization is the connective part of collective intelligence. Collective intelligence requires:
1. Human stories become realtime conversations documented on the social web 2. That link humans into complex conversational and activist networks 3. That leave information trails and data tracks we can turn into maps, artworks and dynamic visualizations 4. That we can draw from to synthesize new information 5. To tell ourselves richer, more comprehensive narratives and stories 6. To gain and share a higher level of collective wisdom