Biodiversity 1. avoid direct quotations 2. support arguments with - - PDF document

biodiversity
SMART_READER_LITE
LIVE PREVIEW

Biodiversity 1. avoid direct quotations 2. support arguments with - - PDF document

Matt Schrader Comments to assignment BSC 3052 February 5, 2004 Newman, D., and D. A. Tallmon. 2001. Experimental evidence for beneficial fitness effects of gene flow in recently isolated populations. Conservation Biology. 15(4): 1054- 1063.


slide-1
SLIDE 1

Matt Schrader BSC 3052 February 5, 2004 Newman, D., and D. A. Tallmon. 2001. Experimental evidence for beneficial fitness effects of gene flow in recently isolated populations. Conservation Biology. 15(4): 1054- 1063. In small populations, extinction risk may be increased by genetic factors such as drift and inbreeding depression. Simple genetic models predict that a few migrants per generation can counteract inbreeding depression and maintain genetic variation in small populations, but there have been few empirical tests of their predictions. Newman and Tallmon (2001) experimentally manipulated migration into small plant populations in order to test (1) whether migration decreases the effects of inbreeding depression in small populations, (2) whether the amount of migration matters, and (3) how migration affects the distribution of phenotypic variation, within and among populations. The experiment consisted of three migration treatments (0-migrants per generation, 1-migrant per generation, and 2.5 migrants per generation) applied to 10 replicate lab-populations of the annual plant Brassica campestris (rapa) for 5 generations. Each of the thirty populations was founded from 5 seeds collected from a wild population, and the pool of migrants came from the same wild population. Inbreeding coefficients were calculated for each individual using pedigrees, and expected inbreeding coefficients for each treatment were calculated using Wright’s equations. Fitness traits were measure in the lab on seeds that produced the 2nd, 4th, and 6th generation (germination rate, # of seeds per capsule, and seed weight), and in the field on 6th generation plants (cotyledon width, flowering date, stem diameter,

Comments to assignment

  • 1. Goals of the study
  • 2. Method(s)
  • 3. Results or conclusions
  • 4. Strengths and Weaknesses
  • 5. Overall evaluation (do strengths outweigh weaknesses,

contribution to field)

  • 6. If you use work of others, include a Reference section
  • 7. Questions that paper raises or future work needed
  • 8. Questions for summary/discussion
  • 1. avoid direct quotations
  • 2. support arguments with DATA or LOGIC.

“The paper was convincing." “Their sampling seemed biased."

  • 3. Be specific.

“The authors looked at papers over many years."

  • 4. Your personal opinion is not informative without saying why.

"I found this paper interesting"

  • 5. Focus on CONTENT not style.

“This paper was well written”

Biodiversity

“Biodiversity is the structural and functional variety of life forms at genetic, population, community, and ecosystem levels”.

[Sandlund, Hindar, and Brown, 1992]
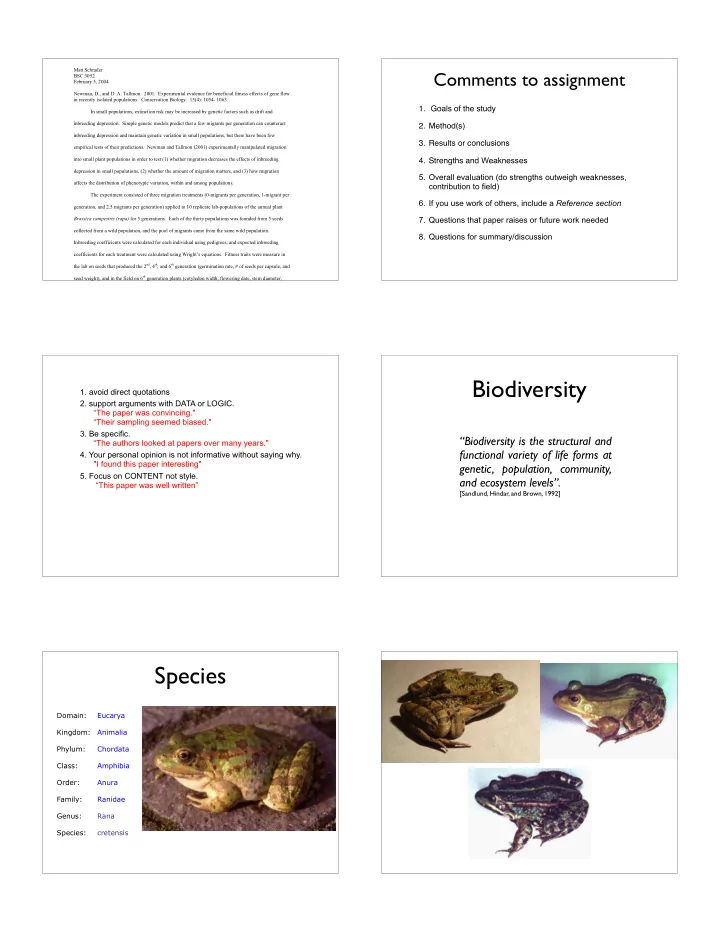
Species

Domain: Eucarya Kingdom: Animalia Phylum: Chordata Class: Amphibia Order: Anura Family: Ranidae Genus: Rana Species: cretensis

slide-2
SLIDE 2

Species concepts

Typological, morphological species concept Linné, described according to morphology Biological species concept Ernst Mayr popularized this concept: A group of individuals that is reproductively isolated from other groups. Cladistic species concept Donoghue and others: A species is a monophyletic group (a group including all descendents of an ancestor).

What is the cladistic species concept?

Every group of populations that are distinct from other groups by a common character (monophyletic group) is a species.

monophyletic group monophyletic group

? ?

Linné Bio Clad

Phylogenetic relationship

Rana cretensis Rana lessonae Rana shqiperica Rana ridibunda (Poland) Rana kurtmuelleri (Greece) Rana bedriagae (Turkey) Rana epeirotica Rana saharica Rana perezi Rana nigromaculata (Korea)

Problematic (Cladistic) species concept

mtDNA Electrophoretic marker A1 A3 A2/A4 A2 A1 A4

slide-3
SLIDE 3

Why does the species concept matter? Why does the species concept matter?

Southern Black Racer

http://www.wildherps.com/species/C.constrictor.html http://www.wildherps.com/species/C.constrictor.html#paludicola

Everglades Black Racer The category Species is natural, but sometimes difficult to specify, see other species concepts on page 83, Table 4.2 [There are more: e.g. Recognition species concept] The Biological Species Concept (BSC) is most often used for legal purposes, although the Endangered Species Act has a wider definition: subspecies and distinct population considered different units. CITES: regulates trade using species designations

www.cites.org

EVOLUTIONARY SIGNIFICANT UNITs are populations with an independent evolutionary dynamics. DEMOGRAPHIC UNIT are populations with independent demographic dynamics. These populations fluctuate in size independent of others and are often isolated. CONSERVATION UNIT definition depends on the conservation goal: often keeping variability, minimal viable population, maintaining ecological function.

Species is a difficult unit, others?

Luck, G. W. et al. 2003. Population diversity and ecosystem services. Trends in Ecology and Evolution 18: 331-336.

We could count species in an area of interest We could take into account numbers of individuals We could take into account position in phylogeny

How to measure Biodiversity? Taking into account abundance

H = −

n

  • i

pi ln(pi)

Shannon - Wiener index

means the fractional abundance (or biomass or productivity,....) pi

slide-4
SLIDE 4

Taking into account abundance

Species Site A Site B Common yellowthroat 0.46 0.04 Field sparrow 0.16 0.09 Dickcissel 0.07 0.07 Red-winged blackbird 0.02 0.03 Brown-headed cowbird 0.11 0.06 American goldfinch 0.08 0.34 Ringneck pheasant 0.03 0.05 Mourning dove 0.07 0.02 Eastern kingbird

  • 0.05

Grasshopper sparrow

  • 0.15

Northern bobwhite

  • 0.09

Shannon diversity 1.64 2.07 relative abundance

Behavior of Shannon-Wiener

Species 1 Species 2 H’ 0.1 0.9 0.325 0.5 0.5 0.693

Shannon-Wiener measures eveness

H = −

n

  • i

pi ln(pi)

Behavior of Shannon-Wiener

Species 1 Species 2 Species 3 H’ 0.5

  • 0.5

0.694 0.79 0.11 0.11 0.672

H = −

n

  • i

pi ln(pi)

Measuring Biodiversity

We could count species in an area of interest ~RICHNESS We could take into account numbers of individuals ~EVENESS Indicator species: often we are not able to to quantify biodiversity, but know that a ‘rare’ species is an indicator for species richness. Diversity in an ecological community Rate of change of species diversity among similar communities Diversity over all communities in a landscape

Different levels of biodiversity

α β γ

Alpha diversity refers to the diversity within a particular area or ecosystem, and is usually expressed by the number of species (i.e., species richness) in that ecosystem. If we examine the change in species diversity between these ecosystems then we are measuring the beta diversity. We are counting the total number of species that are unique to each of the ecosystems being compared. Gamma diversity is a measure of the overall diversity for the different ecosystems within a region.

Alpha, beta and gamma diversity for hypothetical species of birds in three different ecosystems Hypothetical species Woodland habitat Hedgerow habitat Open field habitat Alpha diversity 10 7 3 Beta diversity Woodland vs. hedgerow: 7 Hedgerow vs. open field: 8 Woodland vs. open field: 13 Gamma diversity 14 A X B X C X D X E X F X X G X X H X X I X X J X X K X L X X M X N X