
SLIDE 1
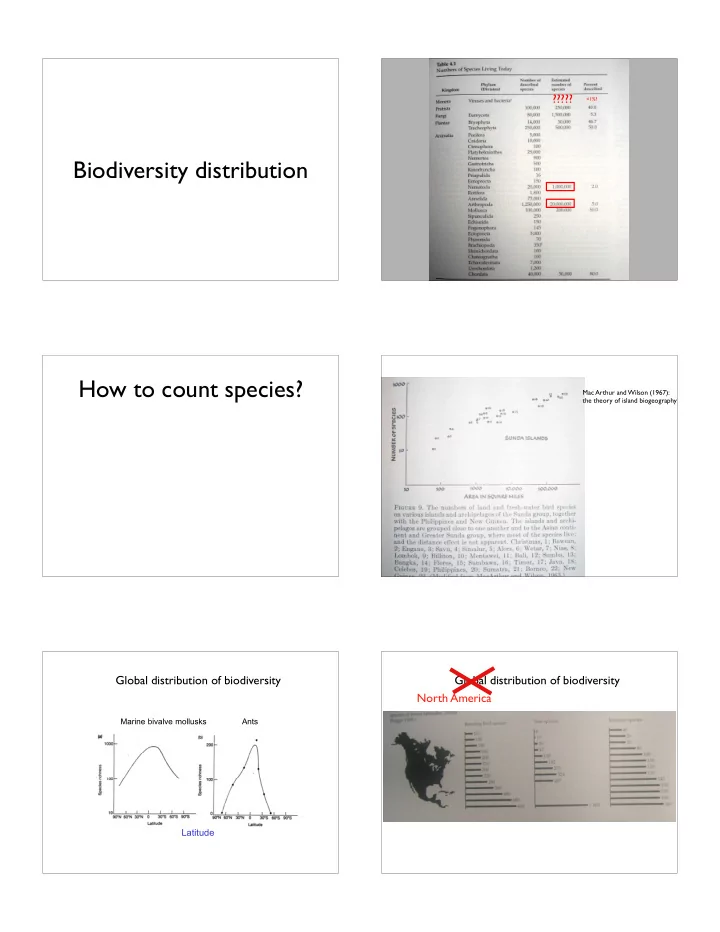
Biodiversity distribution
?????
<1%?
How to count species?
Mac Arthur and Wilson (1967): the theory of island biogeography
Marine bivalve mollusks Ants
Latitude
Biodiversity distribution How to count species? Mac Arthur and - - PDF document
????? <1%? Biodiversity distribution How to count species? Mac Arthur and Wilson (1967): the theory of island biogeography Global distribution of biodiversity Global distribution of biodiversity North America Marine bivalve mollusks
<1%?
Mac Arthur and Wilson (1967): the theory of island biogeography
Marine bivalve mollusks Ants
Latitude
Breeding bird richness in the state of New York Breeding bird richness in Florida USA Biodiversity “hotspots”
Damsel fish distribution
Phylogeny should play a role Abundance should play a role Ecological connection should play a role ...... [I don’t want to make such decisions]
Florida scrub jay
Distribution of endemic bird species Distribution of endemic fish species
Correlation of richness with endemism Taxon .77 Plusiinae (moths) .7 Papilionidae (butterflies) .85 Lasioglossum (bee) .81 Mammals
High endemism correlates with high diversity
Relative lengths of geologic periods
Precambrian Earth forms First signs of life First fossil cells First multicellular animals and plants Photosynthesis starts producing O2 in the atmosphere Mesozoic era Age of Dinosaurs Paleozoic era Fish, bugs, plants
Cenozoic M e s o z o i c e n e g
N y r a n r e t a u Q e n e g
l a P s u
c a t e r C c i s s a r u J c i s s a i r T n a i m r e P
6 . 1 3 2 5 6 2 4 1 5 2 8 4 2 9 2
t n e s e r p m
f e m i T f
n
l l i m n i ( ) s r a e y
m e t s y S a r E e m
d n a s l i s s
l a c i p y t
e l a c S e m i T l a c i g
G
r u a s
h t h c I ) e l i t p e r e n i r a m ( ) e v l a v i b ( a e a h p y r G ) e t i n m e l e b ( s i h t u e t
d n i l y C ) h t
h s i f ( s u d
a r e C ) d i
m a ( s e t i c i d a l C s u d
i h c S ) e v l a v i b ( s a r e c
r t s a G s a r e c
l y t c a D ) e t i n
m a ( s e t i l p
u E ) e t i n
m a ( ) e v l a v i b ( a n n i P s ʼ k r a h S h t
a e n u t p e N ) d
t s a g ( s i a h r r
A ) d
t s a g ( a c i t c r A ) e v l a v i b ( s u r u a s
n a r y T ) d i
i h c e ( r e t s a r c i M
P a l a e
c Protero- zoic c i s s a i r T n a i m r e P s u
e f i n
r a C n a i n
e D n a i r u l i S n a i c i v
r O n a i r b m a C n a i r b m a c e r P
8 4 2 9 2 4 5 3 7 1 4 3 4 4 5 9 4 5 4 5
e h t , n i a t i r B n i s k c
n a i r b m a c e r P t s e d l
h T e t a d , d n a l t
S W N f
c i h p r
a t e m n a i s i w e L e r e w d n a ,
a s r a e y , , , 3 t u
a m
f s ʼ h t r a E e h t r e t f a s r a e y n
l l i b 6 . 1 e m
n w
d i a l . )
a s r a e y , , 6 , 4 . x
p p a t a ( n i g i r
i g y g O ) e t i b
i r t ( s u t s
g A ) e t i b
i r t ( a l u g n i L ) d
h c a r b ( s u e l c u n i r T ) e t i b
i r t ( s u r u r i e h C ) e t i b
i r t ( s u r u n i r c n E ) e t i b
i r t ( s u t p a r g
y d i D ) e t i l
p a r g ( ) h t
h s i f ( s u d
a r e C s i r e t p
t e l A ) n r e f e e r t ( s u d
i h c S ) e v l a v i b ( ) d
h c a r b ( r e f i r i p S s a r e c
r t s a G ) e t i t a i n
( ) l a r
( a e r t s a s p i l i h P ) h s i f ( s i s p e l
t s O
red
Extinction rates vary a lot A steady rate of extinctions, it even seems that the extinction rate was larger long time ago Speciation rate > Extinction rate Species last about 1- 25 My years On average about 1-2 species go extinct each year
Table 2.1 Extinctions recorded since 1500 A.D. “Extinct in wild” indicates that individuals of the species continue to exist, but only in captivity (e.g. zoos or captive breeding programs). Data from (IUCN 2004). # Extinct # Extinct in wild Animals 697 36 Plants & algae 87 24 Total 784 60
years after being detected
hunted for fat and feathers extinct 1844
Many millions during 19th century Last died in the Cincinnati Zoo in 1914
extinct around 1935? (1918?)
Extinct 1922
Extinct 1936
1985
Table 2.2. A sample of species once thought extinct, but rediscovered. Species name Common name Date rediscovered # yrs since last sighting Dipsochelys hololissa Seychelles giant tortoise 1997 >150 Pterodroma cahow Bermuda petrel 1951 >300 Perameles bougainville Western barred bandicoot 1983 61 Trichocichla rufa Long-legged warbler 2003 109 Gastrolobium lehmannii Cranbrook pea 2001 83 Hapalopsittaca fuertesi Fuertes's parrot 2002 91 Hypsiprimnus gilbertii Gilbert’s potoroo 1994 85 Sida inflexa Virginia pine sida 1999 31 Lepidoptrix (formerly Pipra) vilaboasi Golden crowned manakin 2002 45
Direct observation are difficult Indirect observation: species - area relationship
S = c × Az
c is a taxon specific constant z is the extinction coefficient is in the range 0.1 to 0.3
S = c × Az
c is a taxon specific constant z is estimated using the slope
Mac Arthur and Wilson (1967): the theory of island biogeography
Fig 4.5 Small mammals in forest granivores all small mammals r2 = proportion of variation explained
Snow Soriginal = cAz
now
cAz
Log(Number
Log(Area A)
Log(Number
Log(Area A)
Snow Soriginal = Az
now
Az
using z=.15 (this is arbitrary) deforestation = 1.8% per year (Anow / Aoriginal = 98.2/100) 10 million species (Soriginal) Snow = 9,973,000 Difference between Snow and Soriginal = 27,000 species per year
Snow = Soriginal Az
now
Az