
SLIDE 1
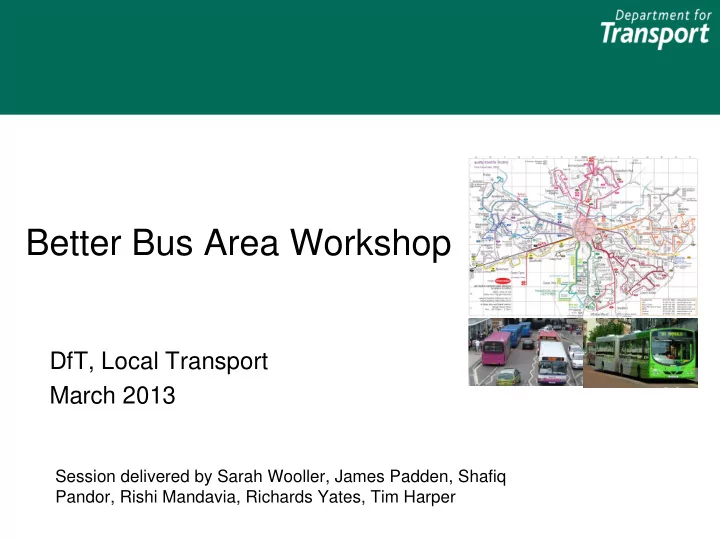
Better Bus Area Workshop
DfT, Local Transport March 2013
Session delivered by Sarah Wooller, James Padden, Shafiq Pandor, Rishi Mandavia, Richards Yates, Tim Harper
Better Bus Area Workshop DfT, Local Transport March 2013 Session - - PowerPoint PPT Presentation
Better Bus Area Workshop DfT, Local Transport March 2013 Session delivered by Sarah Wooller, James Padden, Shafiq Pandor, Rishi Mandavia, Richards Yates, Tim Harper Introductions Housekeeping Who we are Aims for today Focus
Session delivered by Sarah Wooller, James Padden, Shafiq Pandor, Rishi Mandavia, Richards Yates, Tim Harper
James Padden Better Bus Area Policy Rishi Mandavia Economic advice, BBAs Shafiq Pandor Economic support, BBAs Sarah Wooller Better Bus Area Policy Tim Harper Economic advice, Concessionary Travel Richard Yates BBA and BSOG payments
Funding What is a BBA Value for money and evidence Partnership Monitoring, governance, risk and deliverability Types of interventions, state aid and legality The Sheffield experience
0.1 0.2 0.3 0.4 0.5 0.6 0.7 0.8 Oct-13 Apr-14 Oct-14 Apr-15 Oct-15 Apr-16 Oct-16 Apr-17 Oct-17 top-up remaining BSOG rate devolved to LA
First payment is just top up (based on 20% of 1 yrs BSOG). Fully devolved by 2017
95 20 70 20 45 20 20 20yxwvutsrponmlkihgfedcbaWVTSRQPONMLKIHGFEDCBA
authorit BSOG at Oct 2013 commercial BSOG at Oct 2013 BSOG as % of National Rate prevailing
350 Total Grant as % of Commercial BSOG 120 20 Apr-17 25 Apr-16 50 Apr-15 75 Apr-14 100 Oct-13
Total Grant to local y as %
Top up as % of Remaining commercial
Table 4.1
These years go into the next spending period. The Government is committed in principle to providing sufficient funding for BBA during this time but can’t commit to specific numbers. No commitment to BSOG in this
BSOG will take place in 2014/15. 2013 and 2014 are in this spending
this period.
How? Likely to be through combination of: – Attracting new passengers (previously car users) – Reducing waiting time – Reducing travel time
– An area with higher population density – An area with a real congestion issue – An appropriate size – Built around partnership – Built around capital interventions
– Area with lower population density – Lacking a congestion issue to resolve
You provide this figure BCR must be BCR 2.0 DM (BSOG) DM (No BSOG) higher that existing BSOG DM (No BSOG) BCR 2.4 You work out this BCR 3.0 (BCR of BBA proposals) DS (BBA) DS (BBA) Enables DfT to assess overall vfm of BBA against counterfactual of No BSOG
Only 16% of the 2012 bids had a net CO2 savings
High 24% Medium 12% Low 16% Poor 48%
Has specific action been taken to bring on board SMEs? Strong Are specific actions by operators planned? Strong Are there data sharing or information sharing arrangements? Good Is a Quality Partnership in place or planned? Good Is there representation of operators in the governance arrangements? Fair Are there letters from operators? These are particularly strong if they assess the problem with losing BSOG Strong Is the BSOG breakdown agreed with all bus operators? Strong And taken action as a result……… Fair Has the LTA consulted with the bus operators? Weak Questions Strength of Evidence
– BSOG team analyse data and work with LTAs to resolve anomalies
– Final certified claim sent out to reconcile payments up to end March
– Common claim year begins
– DfT pay 2014/15 top up
Baseline – last cert claim accepted before 1 April 2013
The sum of both sides should equal cert claim
TENDERED OPERATIONS COMMERCIAL OPERATIONS
Outside BBA Within BBA Outside BBA Within BBA File Ref: 1/xxxx Service No Registration No Total KMs on last PSV311 Live KMs Dead KMs Total KMs Live KMs Dead KMs Total KMs Live KMs Dead KMs Total KMs Live KMs Dead KMs Total KMs Diff between last PSV311E and bid Comments Operator 1 Service No. (e.g.1) 2 3 4 5 6 7 8 9 10
KM
KPL:
Litres #DIV/0! #DIV/0! #DIV/0! #DIV/0! #DIV/0! #DIV/0! #DIV/0! #DIV/0! #DIV/0! #DIV/0! #DIV/0! #DIV/0!
Rate:
BSOG #DIV/0! #DIV/0! #DIV/0! #DIV/0! #DIV/0! #DIV/0! #DIV/0! #DIV/0! #DIV/0! #DIV/0! #DIV/0! #DIV/0!
.
.
BSOG Revenue Benefits