
SLIDE 1
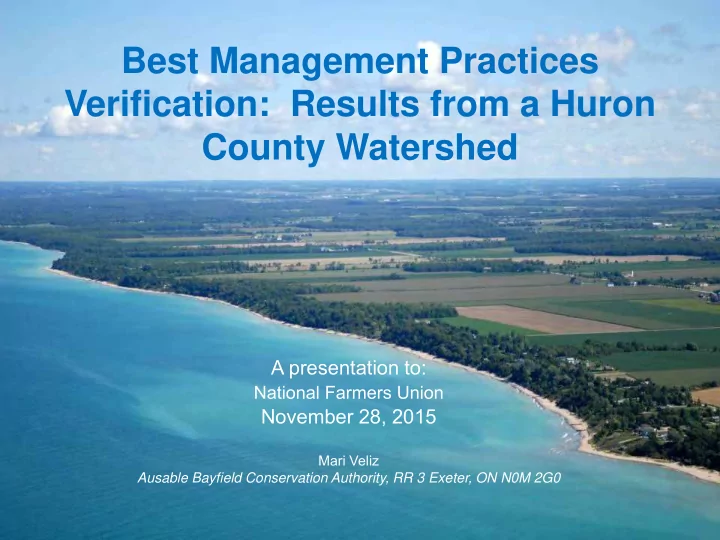
Best Management Practices Verification: Results from a Huron County Watershed
A presentation to:
National Farmers Union
November 28, 2015
Mari Veliz Ausable Bayfield Conservation Authority, RR 3 Exeter, ON N0M 2G0
Best Management Practices Verification: Results from a Huron County - - PowerPoint PPT Presentation
Best Management Practices Verification: Results from a Huron County Watershed A presentation to: National Farmers Union November 28, 2015 Mari Veliz Ausable Bayfield Conservation Authority, RR 3 Exeter, ON N0M 2G0 Communities in Action Build
National Farmers Union
Mari Veliz Ausable Bayfield Conservation Authority, RR 3 Exeter, ON N0M 2G0
Build Awareness
Take actions to protect and enhance
Measure Community Involvement
South Pine Garvey Glenn Gully Trick's Shashawandah
Total Phosphorus (mg·l
0.00 0.20 0.40 0.60 0.80 1.00
Low Flow
South Pine Garvey Glenn Gully Trick's Shashawandah
Total Phosphorus (mg·l-1)
0.00 0.20 0.40 0.60 0.80 1.00
High Flow
During an event Typical conditions
Treatment Antecedent conditions Runoff (mm) Runoff (%) Total Suspended Solids (mg/L) no cover cropA workable 0.8 6.4 406 no cover cropB wet 1.1 8.8 482 cover cropA workable cover cropB wet 0.9 7.2 130 light cultivationC very wet 3.6 28.8 2260
Treatment
that had red clover cover crop
Duration of most outflow ~9 h Duration of most inflow <1.5 h
1955 1966 1975 1978 1989 1999 2006
(at/near source)
Management
Pavement
Drainage
Waterways
Ditches
Based on Tomer et al. 2013
– Fertility – Organic matter – Erosion risk
Many of the photos by Daniel Holm Photography, courtesy of Healthy Lake Huron: Clean Water, Clean Beaches Initiative
Funding for the work presented today is from Ontario Ministry of Agriculture, Food and Rural Affairs, the Agricultural Research Institute of Ontario, the Ministry of Environment and Climate Change and Environment Canada. The views expressed are the views of the presenter and do not necessarily reflect those of the funders.
– Cannot be measured in the downstream channel or at watershed outlet or in the Lake during routine water sampling