Balanced Business Model, Stable Cash Kiel - federal capital which - - PowerPoint PPT Presentation

balanced business model stable cash
SMART_READER_LITE
LIVE PREVIEW

Balanced Business Model, Stable Cash Kiel - federal capital which - - PowerPoint PPT Presentation

Kiel - Multifamily complex Grafental - The largest residential development in Dsseldorf Balanced Business Model, Stable Cash Kiel - federal capital which is ranked in the top Flow, Growth Dsseldorf - ranked no. 6 in terms of quality of


slide-1
SLIDE 1

Balanced Business Model, Stable Cash Flow, Growth

Quality player in the German multifamily sector One of the top 10 players in the Retail Parks segment in Germany Leading condo developer in Dusseldorf November 2016 Kiel - Multifamily complex Rostock - Hanse Center Retail Park 64,000 m2 commercial use, 354,000 m2 land, 2,500 parking spaces Kiel - federal capital which is ranked in the top 5% of the fastest growing cities in Germany Rostock – a major business center in northeastern

  • Germany. The city is ranked in the top 15% of the

fastest growing cities in Germany Grafental - The largest residential development in Düsseldorf Leipzig – Multifamily complexes Leipzig - the city with the highest population growth rate in Germany Düsseldorf - ranked no. 6 in terms of quality of living

1

slide-2
SLIDE 2

Legal clarification

2

The purpose of this presentation is to provide information on Brack Capital Properties N.V. (hereinafter: the “Company”), its operations and financial performance. It does not constitute an offer to purchase or sell securities of the Company or an invitation to receive offers as stated, and is designated only for the provision of information. The information provided in the presentation is for the sake of convenience only and does not constitute a basis to make any investment decisions, nor it is an alternative to the gathering and analysis of personal information, does not constitute a recommendation or opinion and does not constitute an alternative to the personal discretion of any investor. This presentation and the information included herein were not intended to replace the need to review the reports published by the Company to the public, including the Company’s periodic reports for 2015 (published on March 20, 2016) and for the third quarter of 2016 (published on November 20, 2016). The Company is not liable for the completeness or accuracy of the information included in the presentation and will not bear any liability for any damage and/or loss that may be caused as a result of using this information. In any event of a contradiction or discrepancy between the information given in this presentation in a general and summarized manner and between the detailed information appearing in the periodic reports and/or interim reports of the Company and/or the immediate reports of the Company, the statements of these reports shall govern. The presentation includes plans for operations and/or moves and/or evaluations of the Company in relation to its assets constitutes forward- looking information, as the term is defined in the Securities Law, 5728-1968 (hereinafter: the “Securities Law”), including forecasts, business goals, evaluations and standards, and including information presented through drawings, graphs, surveys and any other information, in any manner provided, relating to the future events or matters, the realization of which is uncertain and not under the Company’s control. The realization and/or non-realization of the forward-looking information as stated will be impacted by entities that cannot be evaluated from the outset and are not under the Company’s control, including risk factors characterizing the Company’s operations and from developments in the general and financial environment in the Company’s areas of business, and external factors impacting its operations. The data detailed on pages 6, 18 and 22 regarding projects in residential development in Dusseldorf regarding data of expected profits, sales, income and expected rate of entrepreneurial profit, as detailed in these slides is forward-looking information that is not under the Company’s full control and the fulfillment of which is not certain. The information based on the current information existing in the Company, regarding: the demand for residential areas in the city, market prices of the residential areas in the city, accumulated knowledge and experience of the Company’s management and forecasts and estimates of the Company regarding the construction, development, marketing costs, etc. A change in circumstances may change the Company’s detailed evaluations, and may materially impact the expectations of income from the projects and their

  • verall profitability. Similarly, there is not any certainty that the processes of the zoning change of the real estate sites will take place and/or will be

completed, if at all, since their completion is subject to the planning and construction proceedings required according to the German law, the completion of which is not under the Company’s control. The information included in the presentation may be considered to be presented differently than the manner it is presented in the Company’s reports, but is available for calculation from the data included in the said reports. It shall be emphasized that the pictures attached to this presentation, as well as the statements on slides 3, 5 – 10 , 12, 13, 16, 18, 19, 21 and 22 of the presentation were not included in the past reports of the Company and are provided for the first time in this presentation, are presented in a manner that is different than that which was presented in the Company’s reports, or were updated in accordance with the statements of the Company’s periodic reports for 2015 and for the third quarter of 2016.

slide-3
SLIDE 3
  • Credit rating – ilAA- from S&P Maalot.
  • LTV2 - 54.8%
  • ICR3 - 3.5x.

BCP at Glance

  • Multifamily portfolio (10,414 units, 52% of GAV1) - in large and growing cities (about 50% of the portfolio in cities ranked at the top two deciles in terms of

population growth rate), high-quality, high cash flow (6.8%~rental yield), a difference of 27% between new rentals and actual rental, outperformance (rental growth

  • f 5.1% and an increase in new rentals of 10.3%).
  • Retail parks portfolio (334,000 sq m, 33% of GAV1) - dominant centers in cities that are growing (about 2/3 of the portfolio in cities situated at the top two deciles in

terms of population growth rate), long lease duration, high cash flow (6.2%~NOI yield ), a significant improvement potential (rezoning and development).

  • Residential Development (15% of GAV1) - large projects (1,411 units) and well positioned, mainly in Dusseldorf, with a significant contribution to NAV in the

upcoming years.

1. Company’s share. 2. Net debt to total real estate portfolio. 3. EBITDA (including annualized contribution from development activity) to interest expenses .

  • NAV - 16% CAGR over the last 5 years.
  • FFO - 22% CAGR over the last 5 years.
  • Share price - 19% CAGR over the last 5 years.
  • BCP staff has over EUR 10 billion of collective German investment, development and asset management track record.
  • Management and operations are highly scalable.
  • Traded on the Tel Aviv Stock Exchange since December 2010.
  • Constituent of the TA 100 and in the real estate index 15.
  • 46% public and institutional holdings.

Attractive business mix Strong operating and management platform

BCP I.D.

Dutch N.V Active in Germany since 2004 Over 1.25 million sq m of income producing and development properties (~ EUR 1.3 billion) 160 employees Market value (Tel Aviv Stock Exchange, November 17, 2016) of approximately EUR 524 million EPRA NAV: EUR 464.3 million FFO I: EUR 30.1 million FFO II: EUR 39.3 million

Track record of value creation Robust & flexible balance sheet Capital markets

3

slide-4
SLIDE 4

Results for the third quarter of 2016

Major Developments in 2016 (January – November 2016)

  • Continued Expansion of the Income-producingPortfolio:

Multifamily – purchase of 833 residential units generating an annual rent of EUR 4.53 million by leveraging operating synergies. In addition, an income producing retail property was purchased for EUR 9.1 million, let to Toom (one of Germany’s leading DIY chains) for 14 years generating an annual rental income of EUR 667,000. Purchase of a land plot in Aachen planned for rezoning – a potential future rezoning to residential will allow the construction of 180 – 220 residential units* (combination of town houses and garden/penthouse apartments) after demolishing the existing building. Sell of 4 Hypermarket anchored commercial centers in eastern Germany in cities that are not in the core operations of the Company for EUR 66.5 million. The assets, generating annual rental income of EUR 4.5 million, were purchased in 2011 as part of the Matrix transaction for EUR 37 million and their book value is EUR 61.5 million.

  • The Company’s growth drivers Continue to Accelerate:

Growth in multifamily reached all time high: 5.1% increase in like-for-like rental income; in the commercial portfolio a 2.8% increase in like-for-like NOI was registered; and in the Grafental project a price increase of 10% was recorded in the new stage.

  • Refinancing: In September 2016, the Company refinanced 3 loans from three different banks. The new loans are for a period of five years amounting approximately to EUR 126 million plus a credit line of

EUR 20 million (for financing the acquisition of other income producing assets) and loans amounting approximately to EUR 113 million were paid. The new loans bear a fixed weighted average interest of 1.25% per annum compared to a weighted average interest rate of 2.27% per annum of the loans that were repaid.

Change Q3/2015 Q3/2016 10% 16, 771 18,473 Rental income (EUR thousands) 17% 20,380 23,856 Net income attributed to shareholders (EUR thousands) 18% 25,516 30,052 FFO I (in annual basis, EUR thousands) 21% 32,467 39,276 FFO II (in annual basis, EUR thousands) 21% 325,540 392,758 Equity (EUR thousands) 19% 391,700 464,300 EPRA NAV (EUR thousands)

4

* The Company’s share (50%); for the avoidance of doubt it should be clarified that the Company has not yet made its final decision regarding the project development and its dates.

slide-5
SLIDE 5

Results for the third quarter of 2016 - by operating segment

5

Multifamily Discount

Q3/2016 Q3/2015 Occupancy rate 96% 96% Average rental per m2 €5.66 €5.28 Average rental per m2 in new leases €6.95 €6.20 Rental growth – like for like1 5.1% 4.0% Rental growth in new leases – like for like1 10.3% 10.5% Upside to marketrent2 27% 21%

Residential development

Q3/2016 Q3/2015 Sale of Apartments (#) 30 20 Average sales price per m2 €4,571 €4,152

  • 1. Compared to the corresponding period last year excl. new assets.
  • 2. Fully occupied.

Retail Parks

Q3/2016 Q3/2015 Occupancy Rate 95% 96% Rental growth- like for like1 2.8% 0% New rentals and contract renewals N/a N/a Increase in rental income per m2 in new contracts N/a N/a Acceleration in the like-for-like rental growth rate. Accelerated increase of selling prices in Grafental project. Acceleration in rental growth rate derived from like for like assets as well as from new lettings.

slide-6
SLIDE 6

Quality and Dominance in Three Real Estate Sectors

6

About 932,000 m2 of income producing assets and about 256,000 m2 in development

  • 1. Including 3 projects in rezoning stages (prior to passing a final resolution regarding the development and dates).
  • 2. Income from current sales and from future sales based on current sale prices. Excluding the Aachen project which is conditional on the resolution to fully develop the said projects and currentlu

under rezoning.

About 1,411 residential units under constructionand planning

The Leader of Dusseldorf’s Residential Development Market

4 projects with about 1,411 residential units in different stages of rezoning, planning1 and execution with a volume of about EUR 694 million2. 28 properties with 334,000 m2

Dominant Player in Retail Parks

Quality and dominant properties High WALT-11 years with anchor tenants. Significant upside potential through change of urban plan and/or using construction rights Track record – approximately 574 residential units were sold in the last 4 years at a total monetary scope of EUR 258 million. The average price per unit increased by 27% over the period.

About 160 employees

Full vertical management - senior management with a combined years’ experience of decades in management, development and

value-enhancing of real estate properties in Germany. Operating and management activity allowing an additional significant growth of the property portfolio About 10,400 residential units in 16cities

Quality player in the Multifamily Sector

High performance – annual rental growth of 5.1% from like-for-like assets and 10.3% in rental in new leases. Attractive macro locations - operating regions (Leipzig, Hannover, Kiel, NRW, Dortmund, Bremen) with double rental growth rate compared to the German average.

slide-7
SLIDE 7

7

Multifamily Residential -Inexpensive and GrowingMarket

Expectation for continued solid growth in rental and sale prices as a result ofthe immigration wave Residential market among the cheapest in the western world Rental rate appreciation lags behind the disposable income growth

Source: Credit Suisse Research, July 2016

High households savings rate Low house prices relative to income

In the Company’s portfolio

*according to a research of Prognos from 2016, which encompasses 402 cities and counties in Germany. The population growth forecast is based on weighing the following parameters: birth rate, rate of the young adults in the total population and the total immigrants per city and population development in the last decade.

About half of BCP assets are in cities ranked in the top two deciles in terms of population growth rate

The remaining assets are in cities that grow above average

Ranking of the Company's portfolio locations by population growth forecast index* (according to book value, the Company's share)

Eighth decile 20% Other cities in the top deciles 28%

One third of the locations around the median 32%

Leipzig – ranked first in Germany 20%

slide-8
SLIDE 8

Multifamily Portfolio – Quality Before Quantity

Key parameters Attractive geographic spread*

Bremen 10% - 1,044 units Hannover 9% - 904 units Leipzig General data Total area 609,000 m2 Occupancy 96% Annual rental income EUR 40 million Average rent per m2 EUR 5.66 Current yield Rental yield 6.8% NOI yield 5.8% Potential yield ERV yield* 8.6% Adjusted NOI yield** 7.6%

* ERV - rental income based on avg. new lettings. ** Adjusted NOI – under the assumption that all properties are let at ERV.

Rest of NRW

(Duisburg, Essen…)

31% - 3,296 units Kiel 10%- 1,015 units

* By no. of units, including transactions post the balance sheet date.

Leipzig 31% - 3,204 units Dortmund 9% - 951 units

 Macro-location in cities where rent is growing twice faster than the average in Germany.  Locations in strong neighborhoods and quality properties - rental is growing at a rate of 3% above the market.

Outperforming the market

4.0% 6.3% 9.5% 8.1% 9.1% 6.5% 7.6%

Germany NRW Dortmund Hannover Leipzig Bremen Kiel

Average : 7.6%

Market Rent Growth (Q3/2016 vs. Q3/2015)

10.3% 9.8% 15.1% 10.5% 9.2% 14.7% 8.6%

BCP portfolio NRW Dortmund Hannover Leipzig Bremen Kiel

Like for like New Lettings (Q3/2016 vs. Q3/2015)

Source: Jll 2016 8

slide-9
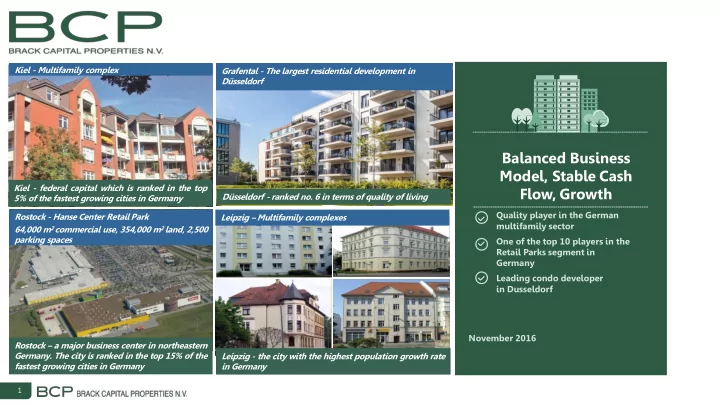
SLIDE 9

Multifamily Portfolio – Quality Before Quantity

10,414 residential units in 16 cities were purchased over the last 12 years in 18 different transactions and are managed by the Company for a long time

1. Based on actual new lettings in properties. The most influential parameter on future rental growth rates from like-for-like assets. 2. Public companies operating in the residential market in Germany. Data are from Credit Suisse reports data and the companies' publications. 3. Average apartment size in BCP portfolio is 58 square meters compared to 61-64 square meters among the competitors.

Consistently Outperforming the Market

Performance Strategy /policy Parameter

  • Rentals in cities where the Company operates is

growing at a rate twice the national average.

  • Rental

in the Company's assets is growing significantly faster than the rental growth in cities where the Company operates (10.3% vs. 7.6%).

  • 100% of the portfolio is in large cities/population centers
  • Focusing on cities that are among the top three deciles

in terms of population growth rate that enjoy strong rental growth.

  • Focusing
  • n

well established neighborhoods with employment, transportation, and educational institutions. Strong locations

  • Macro
  • Micro
  • The trend of accelerated growth in the number of

"small" households represents a long-term growth factor.

  • An attractive product for quality tenants
  • Strategy implemented very successfully for many

years that contribute to high collection rates of 98% - 99%.

  • High proportion of studio and 2 room apartments3, the

fastest growing market segment in major cities.

  • Properly maintained by the company staff.
  • Strict policy of approving new tenants and handling

existing senior tenants by the Company staff. Asset features

  • Size of

apartments

  • Good physical

condition

  • Tenant mix
  • Critical parameter in environment that undergoes a

structural change in the rent level where differences between supply and demand will not be bridged in the coming years.

  • Regulatory legislation for the benefit of tenants is at

the level of each federal state

  • Only about 4% of apartments are under rent control

compared to 9% - 29% among the competitors.

  • Diversification over 16 different cities in 6 different

federal states reduces exposure to the impact of local regulatory initiatives. Regulation BCP location Competitors average2 BCP Nov - 2016 1 2.9% 10.3% Rental growth in new lettings1 1 3.0% 5.1% Rental growth in like- for-like assets High rise 1,740 residential units Town houses 1,185 residential units

Low rise modern construction 6,878 residential units

Buildings for conservation 611 residential units

Well maintained portfolio with a range of building types 100% in largecities

250 to 500 thousand residents, 30% More than 500 thousand residents, 51% 100 to 250 thousand residents, 19% * Based on the book value

9

slide-10
SLIDE 10

Multifamily Portfolio – Quality Before Quantity

Total Leipzig Hannover Bremen Kiel Dortmund NRW 10,414 3,204 904 1,044 1,015 951 3,296 Number of residential units 96% 95% 95% 97% 99% 98% 97% Occupancy rate €960 €916 €1,363 € 850 €1,292 € 963 €831 Value per square meter €5.66 €5.72 €6.96 €5.47 €5.98 €5.75 €5.19 Average rental per square meter €6.95 €7.20 €9.83 €6.68 €7.97 €7.75 €5.46 Average rental per square meter in new lettings

Comfortable pricing 6.8% Rental yield EUR 960 Book value of sq m High performance 5.1% Rental growth – like-for-like properties 10.3% Rental growth in new contracts – like-for-like properties 27% Upside to rental according to market prices 10

slide-11
SLIDE 11

Source: Gfk, Deutsche Euroshop, Hammerson, Melisron, Big

9%-11% 10%-13% 6.5%-12% 4.5%-9.5%

France Great Britain Israel Germany

Retail Centers – Rent Burden as % of turnover

Source: Gfk, OECD

23% 32% 32% 28% 36% 35% 38% 29%

0% 10% 20% 30% 40% Great Britain Sweden Germany Austria Finland France Denmark Norway

Average – 32%

Retail Sales per capita - as % ofdisposable income per capita among the richest countries in Europe

Retail Parks- Long-Term Potential for RentAppreciation

  • 1. Average rent per m2 per month in the Company’s assets.

Long-Term potential for increase in rents and property prices Rent Burden as precentage of turnover is

  • approx. 25% lower than Israel

Retail sales per capita as a percentage of disposable income is among the lowest in Europe Low interest rate environment combined with the immigration are expected to support a significant private consumption increase

Low rent - EUR 7.91 per m2 per month compared to an average of approx. EUR 22 in Israel. Restriction on construction of new large retail centers The local planning authorities restrict new development in order to protect the commerce in the cities centers

11

slide-12
SLIDE 12

A Leading player in the German Retail Parks sector

DiversifiedPortfolioGeneratingaStableCashFlow

* Net of 4 assets from the Matrix portfolio that were sold (the transaction completion date is the end of December 2016) **Contracts with anchor tenants *** ERV - rent according to market price ****Adjusted NOI - NOI under the assumption that the properties are leased according to ERV

Key parameters* General information Number of tenants ~ 310 Total area 334,000 m2 Occupancy 95% Annual rental income EUR 31 million Average WALT** ~ 11years Current yield Rental yield 6.7% NOI yield 6.2% Potential yield ERV yield*** 7.4% Adjusted NOI yield**** 6.9%

Geographicdiversification with a significantpresence in urban and establishedareas 2/3 of BCP's assets are located in cities the top two deciles in terms of population growth rate

Top decile 17% Ninth Decile 47%

Eighth decile 12%

Seventh decile 16%

8% of the locations are around the median

Rating of the Company’s operating cities are according to population growth forecast index* (according to the book value, the Company’s share excluding the non-core portfolio

*according to a research of Prognos from 2016 which encompasses 402 cities and counties in Germany. The population growth forecast is based on weighing the following parameters: birth rate, rate of the young adults from total population and the total immigrants per city and population development in the last decade.

12

Other properties are located in cities with population growth rate above average

slide-13
SLIDE 13

A LeadingplayerintheGermanRetailParkssector Breakdown of the retail assets1

  • 1. Excluding the non-core portfolio (9% of the retail portfolio and 3% of the total RE portfolio) consisting of long held assets, the rezoning potential of which was exhausted and are

designated for sale in the next 2 years.

Strengths Description of the assets % of the total portfolio % of the retail portfolio Asset features Category

  • Rostock is ranked in the upper 15% of the fastest growing cities in Germany.
  • Attractive mix of tenants with long term WALT with anchor tenants.
  • Generates today rental yield of 6.4%.
  • An additional construction rights of approximately 5,000 square meters and the rezoning

potential with substantial upside in the long term. The largest mall in Rostock and the federal state, combining a mall with Power Center at leasable area

  • f approximately 64 thousand square meters with

2,500 parking spaces on the parcel of land of 354 dunams. 6% 19% Super Regional Retail Park (Hanse Center, Rostock) A

  • Very high Retail Centrality index (134).
  • Generating today rental yield of 6.4%.
  • Construction rights of 12 thousand square meters .
  • Rental increase potential.

4 large assets (total leasable area of approximately 60 thousand square meters) with approximately 2,200 parking spaces which are the only commercial or dominant center in the city. The assets are in four medium size cities constituting the commercial centers of their area. 8% 25% The Main Retail Center in Town B

  • Generating today rental yield of 7% .
  • Low book value per leasable square meter : EUR 1,250.
  • Very low value per square meter of land: EUR 675 per square meter.

5 assets with leasable area of 58 thousand square meters on a land plot of 116 dunams in Dusseldorf,

  • n Cologne, on Frankfurt and on Bavaria in proximity

to residential areas. 3 of the assets are leased to Obi and 2 are multi let. The average WALT of the contracts of the assets is approximately 6 years. 5% 15% Assets in large cities with rezoning potential C

  • Rental increase potential of 40%.
  • Rental yield of about 6.7% on the book value.
  • Low value per square meter - EUR 1,100 lower than the cost of reinstatement.

5 large neighborhood centers with leasable area of approximately 55 thousand square meters anchored in Kaufland hypermarket in rich cities near Stuttgart and Munich. 4% 11% Dominant assets in wealthy cities in Bavaria and Baden- Württemberg D

  • Most of them represent the most dominant DIY asset in the city; minor competition; A strategic

asset for the tenant (the nearest branch is between 15 and 60 km away).

  • Turnovers of approximately EUR 13-15 million per year store.
  • Rental yield on carrying cost of 7.3%.
  • Low value per square meter - EUR 1,100.
  • Large amount of land - 202 dunams, low value per square meter of land - less than EUR 370.

8 assets with total leasable area of about 67 thousand square meters on plots of land of approximately 202

  • dunams. 7 assets are leased to Obi and one asset is

leased to Toom for long periods (WALT of 11 years). 5% 14% DIY assets leased to category leaders in Germany for a long-term term E Long term rezoning potential for residence 2 office assets in Dusseldorf + small hypermarket 3% 8% Others F

13

slide-14
SLIDE 14

Dominant properties in attractive locations

Rostock

The largest shopping center in the federal state potential for significant betterment

The only shopping center in the city close to pedestrian, potential for residential development

The city ‘s largest shopping center

Celle - Lower Saxony Castrop Rauxel – NRW

The largest shopping center in thecity Dominant center in a wealthy city near Stuttgart

Borken – NRW Ludwigsburg- Baden Wurttemberg Erlangen - Bavaria Commercial center located in the center of the city with 17k sqm land plot potential for residential development

DIY in attractive location - Potential for residential development

OBI - Düsseldorf Augsburg - Bavaria

Central location, significant rezoning potential DIY in attractive location potential for residential development

OBI - Cologne

14

slide-15
SLIDE 15

Residential Development and Improvement Operation in Dusseldorf An International Economic Center, Sixth in Quality of Life Worldwide1

15

  • 1. The Mercer Quality of Living Survey 2015

Source: Mercer, City of Dusseldorf 2015

Ranked first in the world in terms of quality of life for cost of living Very high quality of life combined with low cost of living Continued price growth of 6% - 7% annually and still remains cheaper when compared with westerncities

Source: JLL, Globalpropertyguide.com, Eurostat, Yad-2 index, The Marker.

Residential Market - Average purchase price per m2

$3,358 $3,370 $3,687 $4,485 $4,647 $6,763 $6,924 $8,007 $9,820 $18,415

Source: Municipality of Dusseldorf, according to 2008 study, InWIS Forschung&BeratungGmbH

Expected shortage of residential units - study of City of Dusseldorf Structural shortage of tens of thousands of residential units

Expected shortage of

about 31,000 residential units in 2020

slide-16
SLIDE 16

Residential Development and Improvement Operations – High Profitability From Track ProvenOperations

16

1. Currently a yielding property, in rezoning to residential process. 2. In rezoning stages. It should be mentioned that the company has not yet decided to develop.

Future luxury project of about 100 residential units close to the Grafenberg forest, in preliminary planning stages. Land in Grafenberg1

Grafental I - sales and profitability data Phase A Phase B 1 Phase B 2 Phase B 3 Phase C (in marketing)

  • No. of residential units

202 118 107 109

+79 apartments 700 m2 for trade

68

  • No. of residential units

Sold (%) 202 100% 118 100% 79 100% 107 100% 62% Total sales as of August 2016 € 80.9m € 56.3m € 30.0m € 55.1m € 35.6m Average sales price per m2 € 3,585 € 3,937 € 3,523 € 4,152 € 4,571 Hand-over of apartments date Ended Q4/2015 Q1,4/2016 Ended Q4/2016 Q4/2017 Total expected profit € 14.0m € 6.3 m € 11.5m € 12.3 m 21% 26% 26% 26% 28% Development profitability Development profit statements (aggregate) recognized in financial € 14.0 m € 10.2 m € 6.3 m

  • * Rezoning / Planning stages

Aachen2 Rezoning to residential and construction of 200 residential units (combination of town houses and garden/roof apartments)

Grafental Clip

Grafental project - successful track- record The largest project in Dusseldorf with about 1,500 residential units in a central location. High development profitability (> 25%) and a continued trend of growing sale prices. Land in Grafenberg1,2 Future luxury project of about 100 residential units close to the Grafenberg forest, in preliminary planning stages.

574 residential units have been sold so far in the amount of EUR 258 million On the north borders of Grafental I. The first stage is expected to be approved during . 2017

€ 11.6m

A price increase of 27% from stage A and 10% from the previous stage (B3)

A profit of about EUR 21 million from sales which has not yet been recognized in the financial statements

Residential development in Dusseldorf and Aachen - Projects under construction, planning and rezoning

Name Total residential units No .of residential units delivered No .of residential units in progress No . Residential units approved for construction No .of Residential units in planning and betterment

Grafental I 850 389 226 235 Grafental II 650

  • 650

Grafenberg*2 100

  • 100

Aachen*2 200

  • 200

Total 1, 800 389 226 235 950 Old factory intended to be demolished

slide-17
SLIDE 17

Residential Development Operations in Dusseldorf – Highly Experienced Platform For Continued Growth

17

Highly experienced staff

Skilled team with decades of experience in planning, development and sales of residential units in Dusseldorf and the surrounding area. 3 2 1

Attractive locations

Central locations within the city, in upper class neighborhoods.

  • 1. GrafentalI
  • 2. GrafentalII

3 Grafenberg

slide-18
SLIDE 18

NAV – growth drivers

  • 1. Company’s share.

2.Based on new lettings performed in Q3/2016 without assuming market rental growth. 3.Rental yield in the market - average of multifamily sector in Germany according to Morgan Stanley, Credit Suisse and companies’ publications.

Book value of Portfolio - about EUR 545.7 million1

1 Company’s share, excluding the Matrix East portfolio the sale of which shall be completed in December 2016

2.CBRE, November 2016.

Comments Rental housing portfolio Commercial centers Residential development

Significant contribution to economic NAV

√Proven projects in Dusseldorf ( total sales of EUR 258 million so far). √ Full sale of the completed stages √ Very high sales rate of the stages in progress V High profitability rate (25%) and increasing √ Continuous price increase (about 10% compared to the previous stage). Current status Market prices Rental income (EUR million)1 € 37.1 € 46.9 Rental yield 6.79% 6.07%3 Sensitivity analysis Rental income (EUR million)1 € 37.1 (Current rental income) €46.92 (Market Rent Q3/2016) Rental yield 6.25% 5.50% 4.75% 6.25% 5.50% 4.75% Implied value (EUR million)1 € 593 € 674 € 780 € 750 € 853 € 987 Current status Market prices NOI (EUR million)1 € 21.8 € 24.1 NOI yield 6.21% 6.00%2

Book value of Portfolio - about EUR 350.1 million1

Sensitivity analysis NOI (EUR million)1 € 21.8 (Current rental income) € 24.1 (Market Rent) NOI return 6.00% 5.75% 5.50% 6.00% 5.75% 5.50% Implied value (EUR million)1 € 363 € 379 € 396 € 402 € 419 € 438 Multifamily Retail centres Residential development

EPRA NAV (30.09.2016) €464.3M Market value (17.11.2016) €524M

Sensitivity analyses – discounted profit1,2,3 after tax4 (the Company's share, EUR in millions) Annual rate of selling price increase Discount rate 4% 7% 10% 8% € 77.3 € 98.4 € 121.3 9% € 74.3 € 94.4 € 116.3 10% € 71.5 € 90.6 € 111.5 11% € 68.8 € 87.1 € 107.0 Project in preliminary planning stages Project name Aachen The Company share 50% Size of the land 53 Dunams Number of planned residential units 180-220

  • The premiums in relation to the EPRA NAV of the

public companies reflect an implied rental yield of 5.8%.

  • The rental growth rate from like-for-like assets is

expected to close the gap between the current rental and the rental in the market within five years, assuming that the rental ceases to grow.

  • Morgan Stanley forecasts a further yield

compression of 0.5% - 1% during the upcoming year.

  • The premiums in relation to the EPRA NAV of

the public companies reflect an implied rental yield of 6.15%.

  • The Company promotes projects for adding and

upgrading commercial spaces in some of the assets in a scope of EUR 50 million (annual yield

  • f 9%).

18

1.Excluding apartments sold and the profits not yet been realized in the books.

  • 2. Including projects that the Company has not yet decided to develop. Without income and profit expected from project in preliminary stages.
  • 3. The period of time assumed in calculating the completion of the projects: Grafental – 7 years, Grafenberg – 6 years.
  • 4. Maximum tax rate was assumed.

Excluding profit from:

slide-19
SLIDE 19

FFO I/FFO II/Growth Drivers (the Company’s share, EUR in million)

Q3/16 in annual terms

19

Representative development profit €9.2

(based on the average actual profit in the last two years)

Market value / FFO II = 13.3 x FFO II €39.3 FFO I

€30.1

+ =

Multifamily

(Rent adjusted to market prices)

+ €9.8

Market value / Adjusted FFO II = 9.6 x Financing costs

(Interest adjusted to market level) + € 5.5

Adjusted FFO II €54.6

Additional growth drivers Adjustments to FFO Annualized FFO (Q3 2016) Multifamily

Portfolio positioned to enjoy a significant and ongoing rental increase in the market (good macro and micro locations/quality assets) Privatization of apartments in the medium-term

Retail Parks

Adding and upgrading commercial assets totalling EUR 50 million (annual yield - 9%) Rezoning potential (Bavaria, Dusseldorf, Cologne, Frankfurt)

Residential Development

Continued growth in demand for apartments and accordingly steady increase in selling prices of projects in progress Capacity allowing doubling the

  • perations in the existing construction

sites New projects already in planning

slide-20
SLIDE 20

Appendices

18

20

slide-21
SLIDE 21

21

  • 1. Market interest – recent loans refinancing interest/average yield to maturity for bonds.
  • 2. Net debt to RE portfolio
  • 3. Based on current quarter .

Financial Position Financial Debt Structure Debt from Bonds Total Banks Outstanding balance in EUR €621.3 €144.9 €766.2 million Average duration 3.8 years 4.4 years 3.9 years Average interest 1.8% 3.9% 2.2% Market interest1 1.3% 1.8% 1.4% Rating and Leverage Ratios Credit rating S&P Maalot ilAA- LTV2 54.8% Debt to Capt, net 58.4% EPRA NAV LTV 54.5% EBITDA to interest (without contribution 3.0X from Grafental3)

Development of equity attributed to BCP’s shareholders - in EUR million

Due to units already sold but not yet recognized in the P&L Refinancing based

  • n market

interest implies an addition of about EUR5.5 million to the annual FFO

Key financial data -balance sheet

הנפקהלאחר 'דצמ-לציבור 2010

Balance Sheet Summary (EUR million) - as of 30.9.2016 Income producing properties* €1,051.8 Land for investment €101.9 Land Inventory for development(long-term and short-term) €84.4 Cash and liquid balances €69.7 Total assets €1,403.3 Total debt €766.2 Equity attributed to company’s shareholders €392.8 Total Equity incl. non controlling interests €497.0 EPRA NAV €464.3

0.0 50.0 100.0 150.0 200.0 250.0 300.0 350.0 400.0

153.6 187.2 209.6 237.3 279.6 345.5 392.8

After IPO- 31/12/2011 31/12/2012 31/12/2013 31/12/2014 31/12/2015 30/9/2016

EPRA NAV (EUR million) 30.9.2016 Equity attributed to the shareholders

  • f the Company

392.8 Adding deferred taxes (less minority interest) 60.7 Excluding the fair value of financial derivatives, net (less minority interest) 0.4 Adding non-recognized profit from sold units in Phases B and C (the Company’s share, net of taxes) 10.4 EPRA NAV 464.3

CAGR -17%

* excl. properties held for sale.

slide-22
SLIDE 22

Key financial data - profit and loss

22

*Including income from management fees that are not consolidated in the the financial statements. ** Adjusted NOI - NOI under the assumption that the properties are leased at market prices. PhaseB3 PhaseC

  • No. of residential units

202 118 79 apartements + 700m2 commercial 107 109

  • No. of underground parking

spaces 244 130 101 121 125 Built area 30k m2 18k m2 11k m2 16k m2 16k m2 Sold units(#) 202 118 79 107 68 Sold units(%) 100% 100% 100% 100% 62% Total sales as of November 2016 € 80.9m € 56.3m € 30.0m € 55.1m €35.6 Average sales price per sq m € 3,585 € 3,937 € 3,523 € 4,152 € 4,571 Commencement of early marketing 5/2012 9/2013 7/2013 1/2015 5/2016 Commencement of construction 7/2012 4/2014 4/2015 4/2016 Apartments hand-over date Ended 4/2014 Q4/2015- Q1,4/2016 Ended Q4/2016 Q4/2017 Expected development profit € 14.0m € 11.6m € 6.3m € 11.5m € 12.3m Development profitability 21% 26% 26% 26% 28% Development profit recognized in the reports (cumulative) € 14.0m € 10.2m € 6.3m

  • Free Cash Flow

€ 31m € 19m € 14m € 21m € 21m

Grafental I – Key data

  • Excl. contribution from the

Grafental project. Average interest of 1.8% p.a. on bank loans.

  • Excl. contribution from the

Grafental project. In the reported quarter no apartments were handed over; hand-

  • ver of phase B3 will

commence in the fourth quarter of 2016.

Profit and Loss (in EUR thousand) Q3/2016 Q3/2015 Rental Income € 18,473 €16,771 Profit from the sale of apartments €0 € 159 NOI* €16,044 € 15,170 NOI yield 6.0% 6.6% Adjusted NOI yield** 7.3% 7.6% EBITDA €14,439 €13,447 Real estate revaluation €26,325 €13,252 % of real estate revaluation in relation to the total investment property 2.2% 1.3% Cash flow interest €4,745 €4,810 FFO I €7,513 €6,379 FFO II €9,819 €8,117 EBITDA to interest (without contribution from Grafental) 3.0x 2.8x

  • Incl. contribution from the

Grafental project.

Grafental

about EUR 21 million profit from already sold apartments is not yet recognized in the P&L

Phase A Phase B1 Phase B2