
SLIDE 1
So Soil il nutr trie ient management in in dair iry farm rmin ing systems
Backtrack Dairies
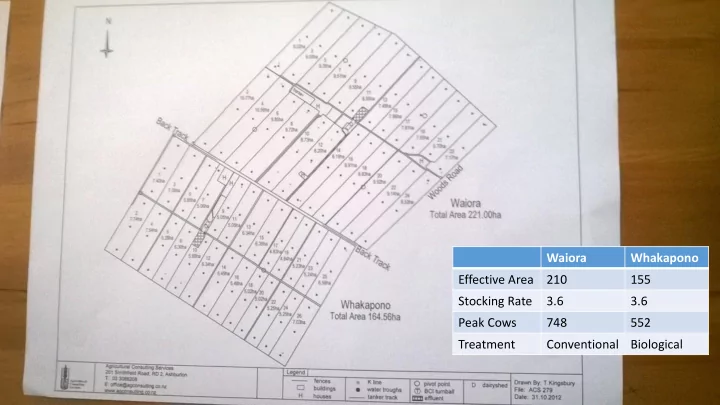
Waiora Whakapono Effective Area 210 155 Stocking Rate 3.6 3.6 Peak Cows 748 552 Treatment Conventional Biological
Backtrack Dairies Waiora Whakapono Effective Area 210 155 - - PowerPoint PPT Presentation
Backtrack Dairies Waiora Whakapono Effective Area 210 155 Stocking Rate 3.6 3.6 Peak Cows 748 552 Treatment Conventional Biological So Soil il nutr trie ient management in in dair iry farm rmin ing systems Milk Production
Waiora Whakapono Effective Area 210 155 Stocking Rate 3.6 3.6 Peak Cows 748 552 Treatment Conventional Biological
1 2 3 4 5 6 7 8 9
kg MS/ha
Milk Production kgMS/ha/day
Whakapono Waiora 0.5 1 1.5 2 2.5
Kg MS/cow/day
Milk Production KgMS/cow/day
Whakapono Waiora
200 400 600 800 1000 1200 1400 1600 1800 2000
MS/ha
Whakapono Waiora
MS/ha MS/Cow
0.00 100.00 200.00 300.00 400.00 500.00 600.00
MS
MS/Cow
Whakapono Waiora
50 100 150 200 250 300 350 400 450
Rainfall to Date
2 4 6 8 10 12 14 16 18 20 Temp C
Average Soil Temperature at 9am
Whakapono Waiora
Waiora Soil Moisture – last quarter
Whakapono Soil Moisture – last quarter
Waiora – 14.2 TDM/ha
Whakapono – 13.9 T DM/ha
10 20 30 40 50 60 70 80 6 7 8 9 10 11 12 1 2 3 4 5
KgDM/ha
Monthly Average Growth Rate kgDM/ha/day
Whakapono Waiora 2000 4000 6000 8000 10000 12000 14000 16000 1 4 9 111315171922232425262728293031323334353637383940414243444546474849505152
KG DM
Total Pasture Grown
Whakapono Waiora
Whakapono – 984 Kg/cow
200 400 600 800 1000 1200 2/06/2014 2/07/2014 2/08/2014 2/09/2014 2/10/2014 2/11/2014 2/12/2014 2/01/2015 2/02/2015 2/03/2015 2/04/2015 2/05/2015 2/06/2015
KgDM/cow
Supplements Fed to Date (kgDM/peak cows)
Whakapono Waiora
Waiora – 1110 kg/cow
20 40 60 80 100 120 140 160 180 200
kgN/ha
Cumulative N Fertiliser Use
Whakapono Waiora
5 10 15 20 25 30 6 8 10 11 3 5
DM %
Dry Matter %
Whakapono Waiora 11.2 11.4 11.6 11.8 12 12.2 12.4 12.6 12.8 13 6 8 10 11 3 5
ME
Pasture ME
Whakapono Waiora
5 10 15 20 25 30 35 6 8 10 11 3 5
%
Protein %
Whakapono Waiora 5 10 15 20 25 30 35 40 45 6 8 10 11 3 5
%
NDF %
Whakapono Waiora 2 4 6 8 10 12 14 16 18 20 6 8 10 11 3 5
%
Soluble Sugars %
Whakapono Waiora
Ave for Season Whakapono Waiora DM % 20.2 19.9 ME % 12.5 12.3 Protein % 23.8 24.1 NDF % 36.3 37.6 Soluble Sugars % 13.3 12.6
Ryegrass tiller density
2014 2015 May Jun Jul Aug Sep Oct Nov Dec Jan Feb Mar Apr May Jun Tillers/m2
2000 4000 6000 8000 10000 12000
Biological Conventional
Measurements courtesy of Lincoln University
Measurements courtesy of Plant and Food
Pre graze pasture early April 2015 on a 36 day round
Pre graze pasture mid May 2015 on a 48 day round
Measurements courtesy of Plant and Food
Cow Condition for April 2015
10 20 30 40 Whakapono Waiora % of herd 2.5 3 3.5 4 4.5 5 5.5 6
1 2 3 4 5 6
% of Herd
Cumulative Mastitis Cases
Whakapono Waiora 50000 100000 150000 200000 250000 300000 350000 400000 450000
SCC
Bulk Milk SCC
Whakapono Waiora
0.00 2.00 4.00 6.00 8.00 10.00 12.00 14.00 2/06/2014 2/07/2014 2/08/2014 2/09/2014 2/10/2014 2/11/2014 2/12/2014 2/01/2015 2/02/2015 2/03/2015 2/04/2015 2/05/2015
% of Herd
Cumulative Lame Cases
Whakapono Waiora
Whakapono Waiora Submission Rate 92 89 6 week ICR 75 71 Conception Rate 7.7 10
Whakapono
Product Total tonnes Kgs/Ha Kgs/Nutrients Kgs Nutrient/ha Lime =Calcium carbonate 72.714 673 48936 312 Dolomite = Calcium Carbonate 34.532 219 17266 109 Dolomite =Magnesium Carbonate 219 8633 54 Guano = Dicalcic Phosphate 21.6 137 1822 16.12 Sulphur = Elemental 7.09 45 6381 40.5 Kieserite = Magnesium Sulphate 3.939 25 624 4 SOP = Potassium Sulphate 24.591 156 12541 79 Sulphate of Ammonia 89059 657 17989 114 Urea 2552 16.25 1174 7.47 Liquid N 18 Boron 1961 12.49 Zinc 4709 29.99 Copper 457 2.9 Cobalt 46 0.3 Fertiliser Cost $ /HA Spring 2014 $54,492 $347 Nitrogen $36,685 $234 Autumn 2015 $33,301 $212 Totals $124,478 $793 GST $18,671.70 $143,149.70
Kinsey-Albrecht Soil Test Hills Lab Test
Whakapono Waiora Difference Whakapono Waiora Difference Total exchange capacity TEC 10.49 10.34 1.50% CEC 15.07 CEC 14.92 1.50% PH 6.01 6.09 1.25% 6.17 6.2 0.50% Humus content % 3.16 3.02 4.75% Base Saturation % Calcium, BS % (60 to 70 %) 61.75 67.89 9.50% 48 53 10.50% Magnesium, BS % (10 to 15 %) 12.71 7.63 67.50% 8.02 4.3 90% Potassium, BS % (2 to 5 %) 3.78 3.11 22% 2.59 2.11 23% Sodium, BS % (.5 to 3 %) 1.88 2 7.50% 0.39 0.42 7.75% Sulphate Sulphur p.p.m 33.42 26 28% 12.14mg/kg 9.42mg/kg 29% Phosphate as P2O5 kg/ha 705 662 7% Olsen Phosphorus 15.42 17.5 12.50% Calcium, value found kg/ha 3106 3152 1.50% me/100g 7.14 me/100g 7.95 11% Magnesium, value found kg/ha 371.57 212.35 75% me/100 1.19 me/100g 0.64 85% Potassium, value found kg/ha 358.92 273.92 31% me/100g 0.38 me/100 0.31 25% Sodium,value found kg/ha 101.46 106 4.50% me/100g .06 me/100g 0.062 4.50% Boron, p.p.m 1.43 0.95 50% Iron, p.p.m 333 330 1% Manganese, p.p.m 71 67 6% Copper, p.p.m 2.81 1.25 125% Zinc, p.p.m 10.15 4.7 115%
Whakapono Moderately good soil structure. VS = 1.5 Waiora Moderately poor soil structure. VS = 0.5
Waiora (kg/ha/yr) N P K S Ca Mg Na Nutrients Added Fertililser, lime and other 182 38 57 59 93 12 Rain/clover N Fixation 125 2 4 2 4 20 Irrigation 9 6 9 32 8 33 Supplements imported 74 11 55 8 10 6 3 Nutrients Removed As products 125 22 28 8 31 2 8 Exported effluent As supplements To atmospheric 120 To water 39 0.9 12 63 58 9 14 Change in internal pools Plant material Organic pool 106 11 1 8 Inorganic mineral 3
Inorganic soil pool 13 93 49 21 36 Whakapono (kg/ha/yr) N P K S Ca Mg Na Nutrients Added Fertililser, lime and
138 17 75 185 269 25 Rain/clover N Fixation 137 2 4 2 4 20 Irrigation 8 5 8 29 7 29 Supplements imported 72 10 54 8 10 6 3 Nutrients Removed As products 125 22 28 8 31 2 8 Exported effluent As supplements To atmospheric 107 To water 35 0.8 13 190 49 3 7 Change in internal pools Plant material Organic pool 89 9 1 7 Inorganic mineral 2
71
Inorganic soil pool
107 158 38 40
Overseer Nutrient Budgets
Financial Analysis
Totals Whakapono Whakapono Whakapono Waiora Waiora Waiora 14/15 Season Per ha Per kg MS 14/15 Season Per ha Per kg MS Hectares 365 155 210 Cows (peak) 552 748 Stocking Rate 3.56 3.56 Total Milk Production 643,617 275,330 1776 499 368,287 1754 492 Milk Income (incl dividend) 1,599,667 10,320 5.81 2,139,747 10,189 5.81 Surplus Dairy Stock 267,193 113,557 733 0.42 153,636 732 0.42 Total Income 1,713,224 11,053 6.22 2,293,383 10,189 5.81 Fertiliser 288,534 135,071 871 0.49 153,463 731 0.42 Supplement (fed on platform) 497,481 197,544 1274 0.72 299,937 1428 0.81 Animal Health 134,487 55,957 361 0.20 78,530 374 0.21 Other Farm Working Expenses 1,989,451 851,445 5493 3.09 1,138,006 5458 3.09 Total Expenses 2,236,633 1,240,017 8000 4.50 1,669,936 7991 4.53 Profit 473,207 3053 1.72 623,447 2930 1.69
Waiora Total kgMS sold 275,330 368,287 kgMS/peak cows 499 492 Peak Cows 552 748 Total N Fert Applied 152 189 Total Supplement Fed/peak cows (kgDM/cow) 984 1110 Herd Ave CS –Apr 15 4.6 4.7 Estimated N Leaching (full year – Overseer) 35 39