B.X. Thanh Background: Aerobic Granule Rationale: Aerobic - - PDF document

b x thanh
SMART_READER_LITE
LIVE PREVIEW

B.X. Thanh Background: Aerobic Granule Rationale: Aerobic - - PDF document

Asian I nstitute of Technology Answ ers For Exam iners Com m ents School of Environm ent, Resources & Developm ent Environm ental Engineering & Managem ent 1. Author should give more precision for such a choice of OLR and NLR values.


slide-1
SLIDE 1

B.X. Thanh

1/40

B.X. Thanh - 1 0 4 1 7 3 1 4 -Jan-0 9

Final Presentation

Fouling Behavior & Nitrogen Removal in The Aerobic Granulation Membrane Bioreactor

Bui Xuan Thanh

  • Prof. C. Visvanathan (Chairman)

Asian I nstitute of Technology School of Environm ent, Resources & Developm ent Environm ental Engineering & Managem ent

  • Dr. Esa Viljakainen
  • Dr. Oleg V. Shipin

Examination Committee:

SBAR MBR

  • Dr. Mathieu Spérandio

2/40

B.X. Thanh - 1 0 4 1 7 3 1 4 -Jan-0 9

Answ ers For Exam iner’s Com m ents

  • 1. Author should give more precision for such a choice of OLR and NLR values. After

the reduction of NLR (but no information to justify this new choice)

  • OLR of 2 kgCOD/m3.d is commonly highest designed for the CAS process in reality.
  • NLR of 1 kg N/m3.d was the high loading to investigate the maximum SND of BG-MBR

without external C addition.

  • NLR, then reduced to 0.5-0.6 N/m3.d to avoid effect of the pH fluctuation.
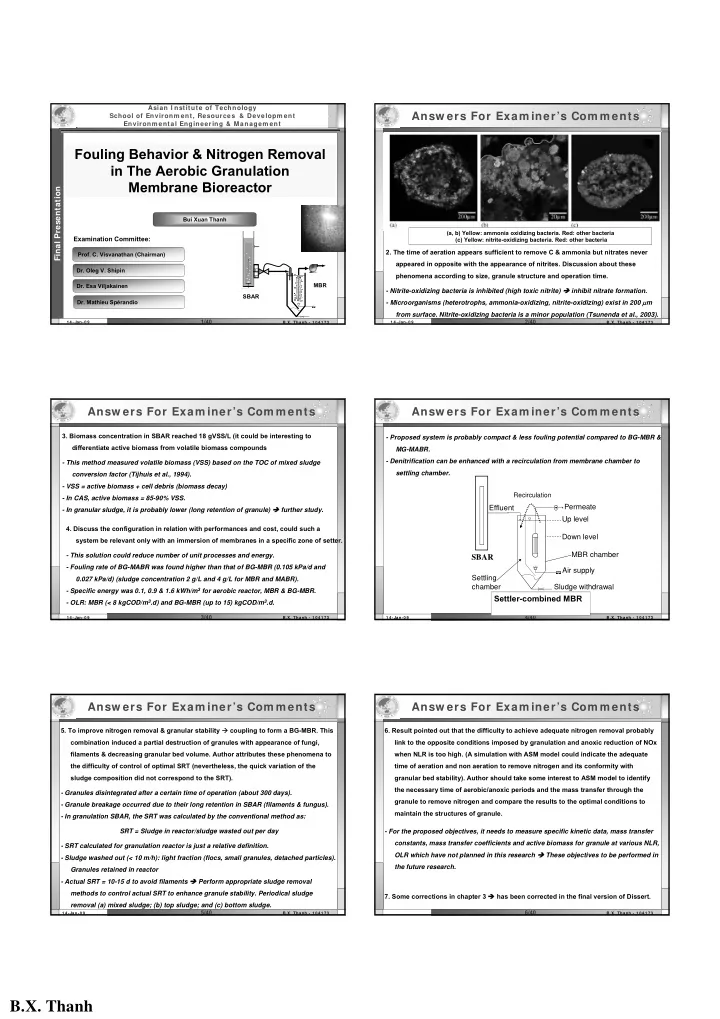
  • 2. The time of aeration appears sufficient to remove C & ammonia but nitrates never

appeared in opposite with the appearance of nitrites. Discussion about these phenomena according to size, granule structure and operation time.

  • Nitrite-oxidizing bacteria is inhibited (high toxic nitrite) inhibit nitrate formation.
  • Microorganisms (heterotrophs, ammonia-oxidizing, nitrite-oxidizing) exist in 200 µm

from surface. Nitrite-oxidizing bacteria is a minor population (Tsunenda et al., 2003).

(a, b) Yellow: ammonia oxidizing bacteria. Red: other bacteria (c) Yellow: nitrite-oxidizing bacteria. Red: other bacteria 3/40

B.X. Thanh - 1 0 4 1 7 3 1 4 -Jan-0 9

Answ ers For Exam iner’s Com m ents

  • 3. Biomass concentration in SBAR reached 18 gVSS/L (it could be interesting to

differentiate active biomass from volatile biomass compounds

  • This method measured volatile biomass (VSS) based on the TOC of mixed sludge

conversion factor (Tijhuis et al., 1994).

  • VSS = active biomass + cell debris (biomass decay)
  • In CAS, active biomass = 85-90% VSS.
  • In granular sludge, it is probably lower (long retention of granule) further study.
  • 4. Discuss the configuration in relation with performances and cost, could such a

system be relevant only with an immersion of membranes in a specific zone of setter.

  • This solution could reduce number of unit processes and energy.
  • Fouling rate of BG-MABR was found higher than that of BG-MBR (0.105 kPa/d and

0.027 kPa/d) (sludge concentration 2 g/L and 4 g/L for MBR and MABR).

  • Specific energy was 0.1, 0.9 & 1.6 kWh/m3 for aerobic reactor, MBR & BG-MBR.
  • OLR: MBR (< 8 kgCOD/m3.d) and BG-MBR (up to 15) kgCOD/m3.d.

4/40

B.X. Thanh - 1 0 4 1 7 3 1 4 -Jan-0 9

Answ ers For Exam iner’s Com m ents

  • Proposed system is probably compact & less fouling potential compared to BG-MBR &

MG-MABR.

  • Denitrification can be enhanced with a recirculation from membrane chamber to

settling chamber.

MBR chamber Air supply Permeate Effluent

SBAR

Setller-combined MBR

Up level Down level Sludge withdrawal Settling chamber

Settler-combined MBR

Recirculation

5/40

B.X. Thanh - 1 0 4 1 7 3 1 4 -Jan-0 9

Answ ers For Exam iner’s Com m ents

  • 5. To improve nitrogen removal & granular stability coupling to form a BG-MBR. This

combination induced a partial destruction of granules with appearance of fungi, filaments & decreasing granular bed volume. Author attributes these phenomena to the difficulty of control of optimal SRT (nevertheless, the quick variation of the sludge composition did not correspond to the SRT).

  • Granules disintegrated after a certain time of operation (about 300 days).
  • Granule breakage occurred due to their long retention in SBAR (filaments & fungus).
  • In granulation SBAR, the SRT was calculated by the conventional method as:

SRT = Sludge in reactor/sludge wasted out per day

  • SRT calculated for granulation reactor is just a relative definition.
  • Sludge washed out (< 10 m/h): light fraction (flocs, small granules, detached particles).

Granules retained in reactor

  • Actual SRT = 10-15 d to avoid filaments Perform appropriate sludge removal

methods to control actual SRT to enhance granule stability. Periodical sludge removal (a) mixed sludge; (b) top sludge; and (c) bottom sludge.

6/40

B.X. Thanh - 1 0 4 1 7 3

Answ ers For Exam iner’s Com m ents

  • 6. Result pointed out that the difficulty to achieve adequate nitrogen removal probably

link to the opposite conditions imposed by granulation and anoxic reduction of NOx when NLR is too high. (A simulation with ASM model could indicate the adequate time of aeration and non aeration to remove nitrogen and its conformity with granular bed stability). Author should take some interest to ASM model to identify the necessary time of aerobic/anoxic periods and the mass transfer through the granule to remove nitrogen and compare the results to the optimal conditions to maintain the structures of granule.

  • For the proposed objectives, it needs to measure specific kinetic data, mass transfer

constants, mass transfer coefficients and active biomass for granule at various NLR, OLR which have not planned in this research These objectives to be performed in the future research.

  • 7. Some corrections in chapter 3 has been corrected in the final version of Dissert.
slide-2
SLIDE 2

B.X. Thanh

7/40

B.X. Thanh - 1 0 4 1 7 3 1 4 -Jan-0 9

Background: Aerobic Granule

  • Size: 0.5–9.0 mm Simultaneous nitrification/denitrification;
  • Excellent settling ability (20-110 m/h, SVI = 18 mL/g)
  • Tolerate temperature range (8-55oC) (De Kreuk et al., 2005);
  • Microbial diversity;
  • Remove phenol (3.8 kg/m3.day) (Tay et al., 2005)

and nitrilotriacetic (NTA) (Nancharaiah et al., 2006)

DO NO3

  • COD

NH4

+

Granule Bulk liquid Anaerobic core Aerobic layer

Carrier 8/40

B.X. Thanh - 1 0 4 1 7 3 1 4 -Jan-0 9

Rationale: Aerobic Granulation MBR

Permeate SBAR MBR

AEROBIC GRANULE & MBR? Aerobic Granule!

+

Being popular due to cost reduction Water reuse and recycling; High SRT, MLSS & OLR less footprint; But fouling, sludge treatment, and oxygen transfer. MBR

9/40

B.X. Thanh - 1 0 4 1 7 3 1 4 -Jan-0 9

Objectives of Study

  • 1. Study on organic removal and simultaneous nitrification

denitrification of aerobic granule and its stability in SBAR;

  • 2. Characterize the fouling behavior of an external submerged

MBR treating granulation SBAR effluent (BG-MBR) ;

  • 3. Study on granule stability and fouling propensity of the

Continuous Granulation MBR (CG-MBR) at various organic loading rate (OLR);

10/40

B.X. Thanh - 1 0 4 1 7 3 1 4 -Jan-0 9

Overall Experim ental Plan

Phase I a (AIT) Batch granulation MBR (BG-MBR) Aerobic Granulation MBR Continuous granulation MBR (CG-MBR)

+ C, N removal + Granule characterization + Granule stability + Fouling behavior

Phase I b (INSA)* Phase II (AIT) SBAR

+ Effect of aeration rates (conventional vs granulation) + Effect of anoxic/aerobic condition on sludge/effluent

  • f SBAR

+ Granule stability; + Effect of OLR on fouling, N removal *INSA = Institut National des Sciences Appliquées, Toulouse, France

SBAR Settler MBR

11/40

B.X. Thanh - 1 0 4 1 7 3 1 4 -Jan-0 9

Batch Granulation MBR ( BG-MBR) : Phase I a

Supernatant SBAR Cycle (4 hrs) Feeding High Aeration Low Aeration Settling Withdrawal Time (min) 6 198 30 3 3

SBAR: High aeration: 1.7 cm/s Low Aeration: 0.1 cm/s NLR: 0.6-1 kgN/m3.d OLR: 2 kg/m3.d Shell carrier MBR: Air flow: 0.3 cm/s Flux: 2.8 L/m2.h HRT: 3.4 h SRT: 20 d Suction: 7on/3off

MBR

Hollow fibre, PE membrane area 0.42 m2 Permeate P Air supply 12/40

B.X. Thanh - 1 0 4 1 7 3

MBR Timer PLC Level controller SBAR Settler Feed tank Air flow meter PG Suction pump

BG-MBR: Lab Scale System s

slide-3
SLIDE 3

B.X. Thanh

13/40

B.X. Thanh - 1 0 4 1 7 3 1 4 -Jan-0 9

MBR & Measured Param eters

Soluble parameters:

  • TOC, Nitrogen species
  • EPS (PS, PN)
  • UVA254, SUVA (= UVA254/DOC)
  • Size Exclusion Chromatography (SEC-EEM)
  • Hydrophobicity

Sludge parameters:

  • MLVSS/MLSS
  • SVI
  • Capillary Suction Time (CST)
  • Microscopic Observation
  • Specific oxygen uptake rate (SOUR)

Membrane fouling parameters:

  • Modified Fouling Index (MFI) (SS, CL, SL)
  • Trans-membrane pressure (TMP)
  • Critical flux
  • Particle Size Distribution (PSD)
  • Resistance/Resistance rate

Hollow Fibre Membrane Module

External Submerged MBR

14/40

B.X. Thanh - 1 0 4 1 7 3 1 4 -Jan-0 9

Effect of Aeration Rates and Anoxic grow th on SBAR effluent– Phase I b

Operating conditions:

  • SBAR: V = 17 L,

H = 1.07 m, D = 0.15 m

  • OLR: 2.0-2.3 kgCOD/m3.d;
  • Batch: 6 h; 8 L/batch;
  • Cycle: Feeding: 30 min;

Reaction: 4h30min; Settling: 30 min; Discharge: 30min

  • SRT: automatic washout;

Days 38 79

Run I Run II Run III

0.8 2.2 0.6 Aeration rate (cm/s) 121 Introduce N2 gas 174

15/40

B.X. Thanh - 1 0 4 1 7 3 1 4 -Jan-0 9

Continuous Granulation MBR ( CG-MBR) : Phase I I

MBR

Hollow fibre membrane module 0.42 m2 Air supply

Airlift reactor

System stop each 4 hr, settling 1 min sludge discharge Permeate P sludge discharge (440 mL/4 h)

CG-MBR:

Air supply: 1.7 cm/s (airlift); 0.1 cm/s (MBR) HRT: 10 h SRT: depends Flux: 2.9 L/m2.h Suction: 7on/3off Volume 10 L (airlift) 3.5 L (MBR) 16/40

B.X. Thanh - 1 0 4 1 7 3 1 4 -Jan-0 9

Operating Conditions: CG-MBR

RUN 1: OLR 2 kg COD/m3.d NLR 0.6 kg N/m3.d OLR RUN 2: OLR 4 kg COD/m3.d NLR 0.6 kg N/m3.d RUN 3: OLR 8 kg COD/m3.d NLR 0.6 kg N/m3.d

Days 50 88 120

17/40

B.X. Thanh - 1 0 4 1 7 3 1 4 -Jan-0 9

BG-MBR Perform ance: Phase I a

Page 53 Page 53 50 100 150 200 250 300 350 Influent Settler MBR supernatant Permeate TOC (mg/L) 10 40 70 100 130 160 190 220 TN (mg/L) TOC TN

  • 50

50 100 150 200 250 Influent Settler MBR supernatant Permeate concentration (mg/L) NH4-N NO2-N NO3-N TN

SBAR: Organic removal & Partial Nitrification; MBR: Nitrification & filtration;

18/40

B.X. Thanh - 1 0 4 1 7 3 1 4 -Jan-0 9

Granule Characteristics in SBAR ( Phase I a)

1 4 -Jan-0 9

Good settling (AS: < 10 m/h); High density & compact

Settling velocity (m/h) 5 4 2 3 4 2 6 1 8 1 Frequency 100 80 60 40 20 Mean: 131 m/h SD: 131 N: 482 Granule size (mm) 8 7 6 5 4 3 Frequency 200 100 Mean: 4.68 mm SD: 1.35 N: 500 Page 54 Page 54

slide-4
SLIDE 4

B.X. Thanh

19/40

B.X. Thanh - 1 0 4 1 7 3 1 4 -Jan-0 9

SBAR Perform ance – Organic Rem oval

50 100 150 200 250 300 350 30 60 90 120 150 180 210 240 time (min) TOC (mg/L) 1 2 3 4 5 6 7 8 9 DO (mg/L); pH TOC DO pH pH = 8.0 ± 0.2; DO = 4.0 – 7.8 mg/L; Organic matters are removed fast in 30 min (97.7 ± 1.4 %);

Page 51 20/40

B.X. Thanh - 1 0 4 1 7 3 1 4 -Jan-0 9

SBAR Perform ance – Nitrogen Rem oval

40 80 120 160 200 30 60 90 120 150 180 210 240 time, min conc, mg/L NH4-N NO2-N NO3-N TN

+ Dynamic balance: NH4-N reduces NO2, NO3 N2 generated! +TN removal 59% (SND= 47%, 22.2 mgN/L.h or 1.76 gN/gVSS.h);

SBAR

TNinf = 100% (190 mg/L) TNeff = 41% (78 mg/L)

TNSND = 47% (89 mg/L) Assimilation = 12% (23 mg/L)

TNremoved = 59% (112 mg/L)

Page 51 Page 52 21/40

B.X. Thanh - 1 0 4 1 7 3 1 4 -Jan-0 9

Mem brane Fouling Behavior: Phase I a

Fouling propensity of sludge fractions: Suspended Solids (SS), Colloids (CL) & Solutes (SL)

1 2 3 4 5 6 7 8 25 50 75 100 125 150 175 200 V, mL t/V, s/mL SS-CL-SL CL-SL SL

Fouling potential of SS, CL & SL were 12%, 39% & 49%; Resistance percentage of SS, CL & SL were 2, 12 & 86 %; Soluble matters is the major fouling contributor

Page 58 22/40

B.X. Thanh - 1 0 4 1 7 3 1 4 -Jan-0 9

Mem brane Fouling – Soluble Fractions

5 10 15 20 settler MBR Permeate concentration (mg/L) 0.00 0.20 0.40 0.60 0.80 1.00 1.20 soluble PS soluble PN PS/EPS ratio

  • Soluble PS increased in MBR (cell lysis, deflocculation)
  • PS/EPS > 0.8;
  • Soluble PS & PN deposited on membrane (11 mgPS/L.m2 & 8 mgPN/L.m2);
  • Soluble EPS extracted from membrane fibres: 20 µg/cm2 (after 78 days)

Release Deposition

Page 60 23/40

B.X. Thanh - 1 0 4 1 7 3 1 4 -Jan-0 9

50 100 150 200 250 30 60 90 120 150 180 day SVI (ml/g) 2 4 6 8 10 MLSS (g/L) SVI30 MLSS

0.8 cm/s 2.2 cm/s 0.6 cm/s N2 introduced

  • Biomass conc. & settling ability increased impressively (SVI = 44 mL/g);
  • Anoxic growth improves aggregate density & promote aggregation;
  • Average effluent SS from SBAR reduced at Run III (200 to 50 mg/L).

Sludge characteristics

Effect of Aeration Rates & Anoxic grow th

  • n SBAR Effluent– Phase I b
200 µm 200 µm

Page 68 24/40

B.X. Thanh - 1 0 4 1 7 3 1 4 -Jan-0 9

Rt = ∆P/(J*µ)

0.00E+00 1.00E+12 2.00E+12 3.00E+12 4.00E+12 5.00E+12 40 80 120 160 200 240 280 V (mL) Rm+Rf (1/m) 0.0E+00 4.0E+08 8.0E+08 1.2E+09 1.6E+09 0.25 0.5 0.75 1 1.25 1.5 Pressure (bar) dR/dV (m-1*s-1)

Resistance Rate Calculation– Phase I b

slide-5
SLIDE 5

B.X. Thanh

25/40

B.X. Thanh - 1 0 4 1 7 3 1 4 -Jan-0 9

0.0E+00 5.0E+12 1.0E+13 1.5E+13 2.0E+13 0.25 0.5 0.75 1 1.25 1.5 dR/dV (1/m.L) SS-CL-SL CL-SL SL 0.0E+00 5.0E+12 1.0E+13 1.5E+13 2.0E+13 0.25 0.5 0.75 1 1.25 1.5 dR/dV (1/m.L) 0.0E+00 5.0E+12 1.0E+13 1.5E+13 2.0E+13 0.25 0.5 0.75 1 1.25 1.5 Pressure (bar) dR/dV (1/m.L)

0.8 cm/s 2.2 cm/s 0.6 cm/s + Anoxic/aerobic

  • At low aeration rate (0.8-0.6 cm/s):

Resistance rates (SS, CL, SL) same

  • rder of magnitude;
  • At high aeration rate (2.2 cm/s): resistance rates

increases & resistance of SS plays a significant role release of small particles & SMPs.

  • With anoxic: resistance slightly increases.

SS = 334 mg/L SS = 474 mg/L SS = 97 mg/L

Resistance Rate in SBAR Effluent: Phase I b

Page 69 26/40

B.X. Thanh - 1 0 4 1 7 3 1 4 -Jan-0 9

0.0E+00 4.0E+11 8.0E+11 1.2E+12 Resistance (1/m) 0.0E+00 4.0E+11 8.0E+11 1.2E+12 Resistance (1/m) 0.0E+00 4.0E+11 8.0E+11 1.2E+12 Rf Rir Rrev Resistance (1/m)

SS = 334 mg/L SS = 474 mg/L SS = 97 mg/L

Same trend as fouling rate;

  • High aeration rate increases

irreversible fouling;

  • Anoxic growth also increases

irreversible fouling (due to soluble)

0.8 cm/s 2.2 cm/s 0.6 cm/s + Anoxic/aerobic

I rreversible/ Reversible Resistance in SBAR Effluent: Phase I b

Reduction of aeration and improvement of denitrification leads to lower irreversible fouling

Page 70 27/40

B.X. Thanh - 1 0 4 1 7 3 1 4 -Jan-0 9

Source SBAR Effluent SBAR Sludge Aeration rate 0.8 cm/s 2.2 cm/s 0.6 cm/s + ano/aero 2.2 cm/s 0.6 cm/s C (kgSS/m3) 0.334 0.474 0.097 3.160 4.750 Specific cake resistance - α (1012 m/kg) 27.2 20.1 214.0 7.5 1.6

An inverse trend for “Sludge” & “Effluent” behavior during filtration:

  • Anoxic growth seems to have a negative impact on effluent (SMP)

but a positive role on sludge filtration (aggregate densification).

  • Specific cake resistance (α ) is always lower for Sludge than Effluent

(due to particles properties and role of soluble)

Com parison of Specific cake resistance of Effluent & Sludge: Phase I b

Page 71 28/40

B.X. Thanh - 1 0 4 1 7 3 1 4 -Jan-0 9

Size exclusion chromatography (SEC) shows :

  • Macromolecules (40-600 kDa) are increasingly produced at high aeration rate (2.2

cm/s),

  • Compounds from 5.7- 6.2 kDa were especially released during denitrification

intensification (anoxic growth) and granular sludge formation

Characterization of soluble compounds by Chromatography

Hydrophobic Interaction Chromatography (HIC) shows :

  • At high aeration rate, Supernatant in effluent contained larger (60%)

hydrophobic fraction with low hydrophobic intensity;

  • At low aeration rate with anoxic growth, supernatant in effluent contained less

hydrophobic fraction (20%) with high hydrophobic intensity.

Soluble Matters Characteristics: Phase I b

29/40

B.X. Thanh - 1 0 4 1 7 3 1 4 -Jan-0 9

Continuous Granulation MBR ( CG- MBR) : Phase I I

20 40 60 80 100 20 40 60 80 100 120 Day Removal efficiency (%) 1 2 3 4 5 OLR (kgTOC/m3.d) TN DOC Loading 10 20 30 40 50 20 40 60 80 100 120 Day NO2-N and NH4-N (mg/L) 40 80 120 160 200 NO3-N (mg/L) NH4-N NO2-N NO3-N + Granule disintegrate CG-MBR=conventional MBR; + TOC removal: 97.8, 99.0 & 99.4 % at OLR 2, 4, 8; + TN removal: 20, 30 & 53%; + Granule breakage TN removal reduced; + NO3 reduced, NO2, NH3 increased at OLR 8; + Nitrifying activity ↓ at high OLR not compete with heterotrophs

Granule break

Page 75 Page 75 30/40

B.X. Thanh - 1 0 4 1 7 3

20 40 60 10 20 30 40 50 60 Day TMP (kPa) OLR 2 OLR 4 OLR 8

1 4 -Jan-0 9

Fouling Propensity of CG-MBR: Phase I I

+ Cake build-up TMP “jump” + Cake resistance > 87.5 %

Fouling rate (kPa/d) Cake build up Page 78

y = 4.67x2 - 7.94x + 3.47 R2 = 1.00 y = 3.03x - 1.50 R2 = 0.94 y = 8.15x - 4.06 R2 = 0.97 0.0 0.5 1.0 1.5 2.0 2.5 0.5 1 1.5 2 F/M (1/d) Fouling rate (kPa/d) 2 4 6 8 10 Loading rate (kg/m3.d) Fouling rate TOC loading COD loading

Page 78

+ Fouling rate proportional to F/M ratio (2rd order); OLRs (1st order); + Membrane contacts with high amount of organic matters fouling.

slide-6
SLIDE 6

B.X. Thanh

31/40

B.X. Thanh - 1 0 4 1 7 3 1 4 -Jan-0 9

10 20 30 40 20 40 60 80 100 12 Day Permeate (mg/L) PS PN DOC

Behavior of Soluble Matters in CG-MBR

10 20 30 40 20 40 60 80 100 120 Day Supernatant (mg/L) PS PN DOC

+ Soluble matters (DOC, Polysaccharides, Protein): (Supernatant > Permeate!) deposited on membrane ;

Deposition rates (mg/L.m2

membrane)

OLR (kgCOD/m3.d) 2 4 8 DOC 16.3 18.2 17.2 sPS 13.1 11.3 13.7 sPN 5.6 5.0 6.7 sEPS 18.7 16.3 20.5 Page 79 Page 79 32/40

B.X. Thanh - 1 0 4 1 7 3 1 4 -Jan-0 9

Com parison: BG-MBR vs CG-MBR

20 40 60 BG-MBR CG-MBR TN removal (%) 0.1 0.2 0.3 0.4 0.5 0.6 0.7 0.8 Fouling rate (kPa/d) & F/M (1/d) TN removal Fouling rate F/M

+ Granule was instable in CG-MBR higher F/M, higher fouling and lower N removal. + Granule stuck on the membrane fibres (lack shear stress) Flatsheet module is suitable for granulation MBR!

Page 80 33/40

B.X. Thanh - 1 0 4 1 7 3 1 4 -Jan-0 9

Com parison: Treatm ent System s

Items Anaerobic reactor Submerged MBR BG-MBR Operating temp. (oC) 30-55 25-35 8-55 Energy requirement (kWh/m3) 0.1 0.9 1.6 Sludge failure Possible

  • Possible

Shock load resistance Possible

  • Yes

Start-up time (days) 100 10 30 MLSS (g/L) 2-60 (depends) 8-15 Up to 18 g/L (2-4 g/L: MBR) SRT (day) 10-300 15-30 10-100* SVI (mL/g) 10-280 120-250 mL/g 10-40 mL/g Settling velocity (m/h) < 10 < 10 20-100 (higher for granule) Particle size (µm) 0.5-8.0 mm (granule) 0.3-200 (flocs) 1-250 (flocs) 0.5-9.0 mm (granules) 0.3-301.7 (flocs in MBR) OLR (kg COD/m3.d) Up to 40 < 8 2-30 SND No Possible Good (1.76 mgTN/gVSS.h) Fouling potential

  • High (0.168 kPa/d)

Less (0.027 kPa/d)

BG-MBR shows the potential application for high strength C, N wastewater

Page 82 34/40

B.X. Thanh - 1 0 4 1 7 3 1 4 -Jan-0 9

Conclusions

+ BG-MBR system: + Ability for C & N removal. The SND at OLR of 2 kgCOD/m3.d was 47% or 22 mgTN/L.h (1.76 mgTN/gVSS.h). + Aerobic granules disintegrated under anaerobic condition and long SRT. + Release of soluble matters in MBR depends on the HRT which influences the fouling propensity & supernatant quality. SMPs are the main cause for fouling where polysaccharides were dominant (11 mg/L.m2 & 8 mg/L.m2 for sPS & sPN). + The disintegration of granules resulted in the release of SMPs that increased the fouling propensity of the BG-MBR system CG-MBR system: + Granule is disintegrated in continuous operation mode (CG-MBR); + Fouling rate showed 2rd order increment with F/M ratio & 1st order with OLR. + SMPs deposited on membrane.

35/40

B.X. Thanh - 1 0 4 1 7 3 1 4 -Jan-0 9

Conclusions ( cont’d)

Effect of aeration rates: + The anoxic/aerobic conditions enhanced the biomass retention, settling ability, denitrification & filterability. + Resistance rate & specific cake resistance of SBAR effluent were higher than that of sludge in anoxic/aerobic operation despite higher SS. + Resistance & irreversible resistance of SBAR effluent were increased at high aeration rate (2.2 cm/s) due to release of macromolecules (30-50 kDa) & small particles while SMPs were released at lower aeration rate (0.8 cm/s). + At high aeration rate (2.2 cm/s), 60% of the hydrophobic fraction was found in the soluble fraction of SBAR effluent with low hydrophobic intensity. While at the low aeration rate (0.6 cm/s + anoxic growth), 20% of the hydrophobic fraction was found with high hydrophobic intensity. + BG-MBR showed better operational performance than CG-MBR (granule stability, N removal & fouling propensity). + Higher biomass retention in BG- MBR compared to CG-MBR lower F/M lower fouling.

36/40

B.X. Thanh - 1 0 4 1 7 3 1 4 -Jan-0 9

Recom m endations

+ Study on the granule stability at various SRT & sludge removal methods (mixed sludge, top sludge, & bottom sludge). + To accelerate and stabilize the granulation process, methods namely support media addition, bridging polymer addition, aeration rates, cycle length, etc should be investigated and optimized. + In BG-MBR, HRT of MBR affects the release of SMPs relates fouling Investigate fouling and sludge characteristics at various HRT. + Study on the possibility of granulation and fouling characteristics in sequencing batch MBR in which membrane functions as an ideal decanter in a SBR. The light fraction of sludge is removed periodically (feast/famine). + SMPs played an important role in fouling of granulation MBR study on the quality and quantity of soluble fraction through SEC-EEM-DOC for understanding the nature of foulants at certain operating conditions

slide-7
SLIDE 7

B.X. Thanh

37/40

B.X. Thanh - 1 0 4 1 7 3

Recom m endations ( Cont’d) :

Proposed Batch Granulation-MBR

Air supply Permeate Effluent

SBAR

Setller-combined MBR

Up level Down level Sludge withdrawal Settling chamber MBR chamber

Settler-combined MBR

Recirculation

+ Investigate compacted BG-MBR which membrane is integrated in an aerated zone of settler. + Recirculation ratio from aeration zone to settling zone can improve further N removal.

38/40

B.X. Thanh - 1 0 4 1 7 3 1 4 -Jan-0 9

Recom m endations ( Cont’d) :

Proposed CG-MBR

+ Study on the application of flat-sheet membrane in CG-MBR. This semi-continuous system can maintain granule stability (Sludge discharge interval 1-4 h, to control feast-famine condition).

P

Sludge discharge pump (each 4 h) Influent pump (continuous) Permeate pump (on/off cycle) Flatsheet membrane module Air scouring Air supply Level sensor Granules

Remark: Granulation Membrane Airlift Bioreactor Each 4 h, system stops and sludge settling for 1-2 minute sludge discharge Page 86 39/40

B.X. Thanh - 1 0 4 1 7 3 1 4 -Jan-0 9

Publications

Thanh, B.X., Visvanathan, C., Spérandio, M., Ben Aim, R. (2008). Fouling characterization in aerobic granulation coupled MBR, Journal of Membrane Science, 318 (1-2), 334-339. Thanh, B.X., Visvanathan, C., Ben Aim, R. (2009). Characterization of aerobic granules at various organic loading rates, Process Biochemistry, 44, 242-245. Thanh, B.X., Visvanathan, C., Ben Aim, R. (Submitted). Fouling behavior in external submerged MBR treating granulation effluent, Separation Purification and Technology. Thanh, B.X., Sperandio, M., Guigui, C., Ben Aim, R., Wan, J.F., Visvanathan, C. (2008). Coupling SBAR and membrane filtration: Influence of nitrate removal on sludge characteristics, effluent quality and filterability, Conference on Membranes in Drinking Water Production and Wastewater Treatment, Oct 20th-22nd, 2008, Toulouse, France. Jegatheesan, V., Shu, L., Visvanathan, C., Thanh, B.X. (2008). Aerobic Environmental Process: Chapter 23 in Advances in Fermentation Technology, Ed. Pandey et al.,

  • pp. 622-654, Asiatech Press, New Delhi. ISBN: 81-87680-18-0.

Journal Publications: Book chapter: IWA International Conferences:

40/40

B.X. Thanh - 1 0 4 1 7 3 1 4 -Jan-0 9

Thank you for Thank you for your attention! your attention!