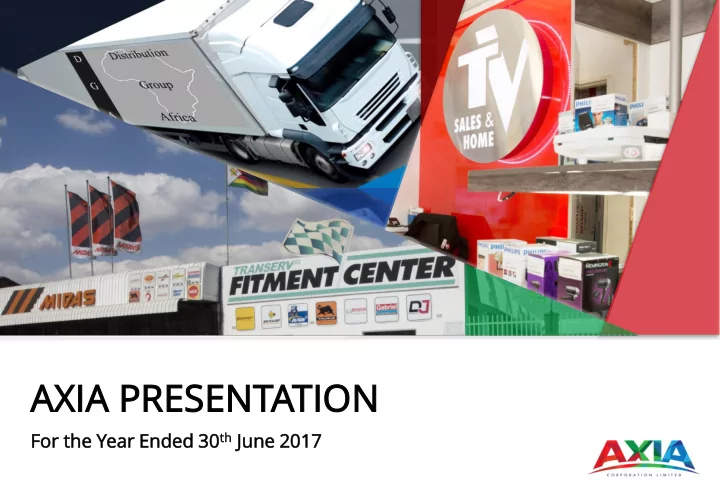

AXI XIA PR PRES ESENT ENTATION TION th June For the he Year ar End nded ed 30 30 th une 20 2017 17
IN INTRODUC ODUCTI TION ON Who We Are Chief Executive Officer Financial Review Finance Director Conclusion Chief Executive Officer www.axiacorpltd.com
Wh Who Ar o Are We?
OUR COMPANIE ANIES S www.axiacorpltd.com
CORPOR PORATE TE STRUCTU CTURE RE Moregrow Enterprises Innscor Credit Retail (Holding Company of Distribution Group Africa Geribran Services) T/A TV Sales & Home (50.01%) T/A Transerv (66.67%) (eff 26.01%) Incorporated in February 2016 Holding Company of 3 operating businesses (structure above) Involved in Speciality Retail and Distribution www.axiacorpltd.com
TV SALE LES S & HOME 280 Employees 41 Retail Sites 28 Delivery Vehicles www.axiacorpltd.com
TRANSE ANSERV RV 340 Employees 43 Retail Branches and Fitment Centers www.axiacorpltd.com
DIS ISTRI TRIBU BUTI TION ON GROUP P AFRICA RICA 1,116 Employees 910 in Zimbabwe 132 in Zambia 74 in Malawi Owns two warehouses measuring 10,000 sqm and leases five warehouses measuring 20,176 sqm Has a fleet of 102 vehicles www.axiacorpltd.com
MACRO CRO EC ECONOMIC MIC EN ENVIR IRONME ONMENT NT Challenges in acquiring some import licenses and making foreign payments Shortage of foreign currency Declining disposable income thus compressed consumer spending Increasing price sensitivity by customers www.axiacorpltd.com
FINA NANCIA NCIAL L REV EVIEW EW
IN INCOME ME STATE TEME MENT NT FY2017 FY2016 % Chg ACTUAL ACTUAL Actual USD '000 USD '000 vs. FY2016 REVENUE 248,262 197,506 26% OPERATING PROFIT BEFORE 22,908 18,511 24% DEPRECIATION AND AMORTISATION (EBITDA) FINANCIAL INCOME 943 2,950 -68% DEPRECIATION & AMORTISATION (1,769) (1,469) -20% OPERATING PROFIT BEFORE 22,082 19,992 10% INTEREST AND FAIR VALUE ADJUSTMENTS
IN INCOME ME STATE TEME MENT NT (CON’T) FY2017 FY2016 % Chg ACTUAL ACTUAL Actual USD '000 USD '000 vs. FY2016 OPERATING PROFIT BEFORE INTEREST AND FAIR VALUE ADJUSTMENTS 22,082 19,992 10% FAIR VALUE ADJUSTMENTS ON LISTED EQUITIES 70 (35) 299% PROFIT BEFORE INTEREST AND TAX 22,152 19,957 11% NET INTEREST EXPENSE (821) (285) -188% EQUITY ACCOUNTED EARNINGS (577) (112) 415% PROFIT BEFORE TAX 20,754 19,560 6% TAX EXPENSE (5,479) (5,101) -7% PROFIT AFTER TAX (USD) 15,274 14,459 6% NON -CONTROLLING INTERESTS (7,859) (7,925) 1% ATTRIBUTABLE PROFIT (BASIC) 7,415 6,534 13% ATTRIBUTABLE PROFIT (HEADLINE) 7,415 5,933 25% *Excluding profit on disposal of BFC BASIC EARNINGS PER SHARE (CENTS) 1.37 1.21 13% HEADLINE EARNINGS PER SHARE (CENTS) 1.37 1.09 25% FINAL DIVIDEND PER SHARE (CENTS) 0.30
IN INCOME ME STATE TEME MENT NT CONTRI TRIBUT BUTORS ORS REVENUE EBITDA 82% TV Sales & Home 37% Moregrow (Transerv) 3% -9% 20% Distribution Group Africa Zimbabwe 38% Distribution Group Africa Region -6% -47%
STATE TEME MENT NT OF FIN INANCI ANCIAL AL POSIT ITION ION ASSETS BREAKDOWN 30 JUNE 2017 30 JUNE 2016 % Change audited audited USD '000 USD '000 ASSETS Non-current assets fixed assets 8,760 8,722 intangible assets 4,105 4,223 investments in associates - 231 loan receivable from associate 1,321 1,220 deferred tax assets 1,632 873 15,818 15,269 4% Current assets financial assets 921 117 inventories 39,777 32,420 trade and other receivables 49,116 43,722 cash and cash equivalents 11,193 13,718 101,007 89,977 12% Total Assets 116,825 105,245 11%
STATE TEME MENT NT OF FIN INANCI ANCIAL AL POSIT ITION ION (CON’T) EQUITY AND LIABILITIES 30 JUNE 2017 30 JUNE 2016 % Change audited audited Capital and reserves USD '000 USD '000 share capital 54 54 - share based payment reserve 14 - non distributable reserves (2,535) (2,727) distributable reserves 37,048 31,169 attributable to equity holders of parent 34,581 28,496 21% non-controlling interests 24,182 21,204 14% Total shareholders' equity 58,763 49,700 18% Non-current liabilities deferred tax liabilities 1,859 1,735 interest bearing debt- third party 2,206 3,736 4,064 5,470 -26% Current liabilities interest bearing debt- third party 23,545 14,839 trade and other payables 28,729 33,065 provisions 702 898 taxation 1,021 1,273 53,997 50,075 8% Total liabilities 58,062 55,545 5% Total Equity and Liabilities 116,825 105,245 11% - Net Debt/Equity 24.77% 9.77% Net Gearing 17.23% 7.11%
STATE TEME MENT NT OF CA CASHFL HFLOWS WS
CONCL CLUSI SION ON www.axiacorpltd.com
CON ONTACT T US For further ther informa formatio tion, n, pleas ase con ontac act: : John n Koum umide des, , Chief Executiv utive Offic ficer r T: +263 63 4 776 6 250 E: E: johnk@ax hnk@axiaop ops.co .com m Ray y Ramb mbanap napasi, , Financ nance Director tor T: +263 63 4 776 6 998 8 E: E: rayr@axia ayr@axiaop ops.co .com www.ax .axia iacor orpl pltd.c d.com om
Recommend
More recommend