SLIDE 1
5/25/20 1
CSE 571 Inverse Optimal Control (Inverse Reinforcement Learning)
Many slides by Drew Bagnell Carnegie Mellon University
1
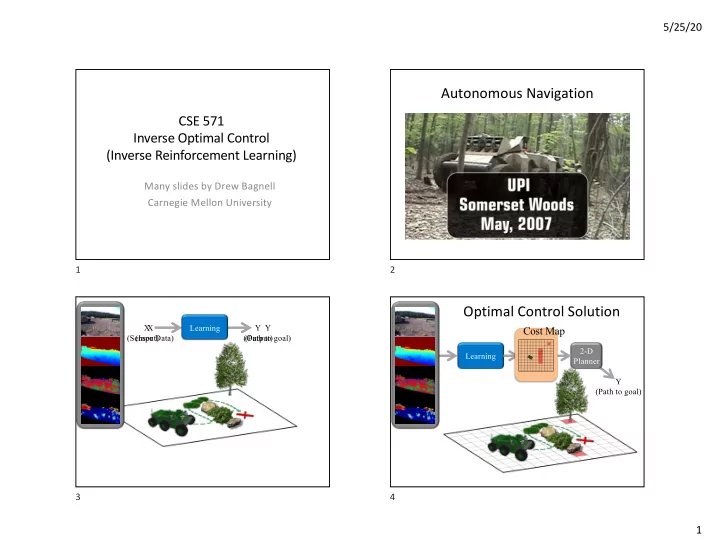
Autonomous Navigation
2
Learning Y (Path to goal) X (Sensor Data) Y (Output) X (Input)
3
Optimal Control Solution
Learning Y (Path to goal) 2-D Planner
Cost Map
4
SLIDE 2
5/25/20 2
Mode 1: Training example
5
Mode 1: Training example
6
Mode 1: Learned behavior
7
Mode 1: Learned behavior
8
SLIDE 3
5/25/20 3
Mode 1: Learned cost map 9 Mode 2: Training example 10 Mode 2: Training example 11 Mode 2: Learned behavior 12
SLIDE 4
5/25/20 4
Mode 2: Learned behavior 13 Mode 2: Learned cost map 14
Ratliff, Bagnell, Zinkevich 2005 Ratliff, Bradley, Bagnell, Chestnutt, NIPS 2006 Silver, Bagnell, Stentz, RSS 2008
w'
Weighting vector
Cost =
Feature vector
F 15
w=[], F=[]
Ratliff, Bagnell, Zinkevich, ICML 2006 Ratliff, Bradley, Bagnell, Chestnutt, NIPS 2006 Silver, Bagnell, Stentz, RSS 2008
Learn F1
( , High Cost) ( , Low Cost)
16
SLIDE 5 5/25/20 5
w=[w1], F=[F1]
Ratliff, Bagnell, Zinkevich, ICML 2006 Ratliff, Bradley, Bagnell, Chestnutt, NIPS 2006 Silver, Bagnell, Stentz, RSS 2008
Learn F2
( , High Cost) ( , Low Cost)
17 18
Ratliff, Bradley, Chesnutt, Bagnell 06 Zucker, Ratliff, Stolle, Chesnutt, Bagnell, Atkeson, Kuffner 09
19
Learned Cost Function Examples
20
SLIDE 6 5/25/20 6
Learned Cost Function Examples
21
Pedestrian Trajectory Prediction
22
Staying out of People’s Path
23
Learning Manipulation Preferences
- Input: Human demonstrations of preferred behavior
(e.g., moving a cup of water upright without spilling)
- Output: Learned cost function that results in trajectories
satisfying user preferences
24
24
SLIDE 7 5/25/20 7
25
Demonstration(s)
25
26
Demonstration(s) Graph
26
27
Demonstration(s) Graph
27
28
Demonstration(s) Graph Projection
28
SLIDE 8 5/25/20 8
29
Demonstration(s) Graph Projection
29
30
Demonstration(s) Graph Projection Learned cost
30
31
Demonstration(s) Graph Projection Discrete sampled paths Learned cost
31
32
Demonstration(s) Graph Projection Output trajectories Discrete sampled paths Learned cost
32
SLIDE 9 5/25/20 9
33
Demonstration(s) Graph Projection Output trajectories Discrete sampled paths Learned cost Discrete MaxEnt IOC
33
34
Demonstration(s) Graph Projection Output trajectories Discrete sampled paths Learned cost Local Trajectory Optimization
34
Setup
- Binary state-dependent features (~95)
- Histograms of distances to objects
- Histograms of end-effector orientation
- Object specific features (electronic vs non-electronic)
- Approach direction w.r.t goal
- Task
- Hold cup upright while not moving above electronics
35
35
Laptop task: Demonstration
( Not part of training set)
36
36
SLIDE 10 5/25/20 10
Laptop task: LTO + Discrete graph path
37
37
Laptop task: LTO + Smooth random path
38
38
Readings
- Max-Ent IRL (Ziebart, Bagnell):
http://www.cs.cmu.edu/~bziebart/
http://graphics.stanford.edu/projects/cioc/cioc.pdf
- Manipulation (Byravan/Fox): https://rse-
lab.cs.washington.edu/papers/graph-based-IOC-ijcai-2015.pdf
- Imitation learning (Ermon): https://cs.stanford.edu/~ermon/
- Human/manipulation (Dragan):
https://people.eecs.berkeley.edu/~anca/research.html
39
39