
SLIDE 1
ST 430/514 Introduction to Regression Analysis/Statistics for Management and the Social Sciences II
Autocorrelation
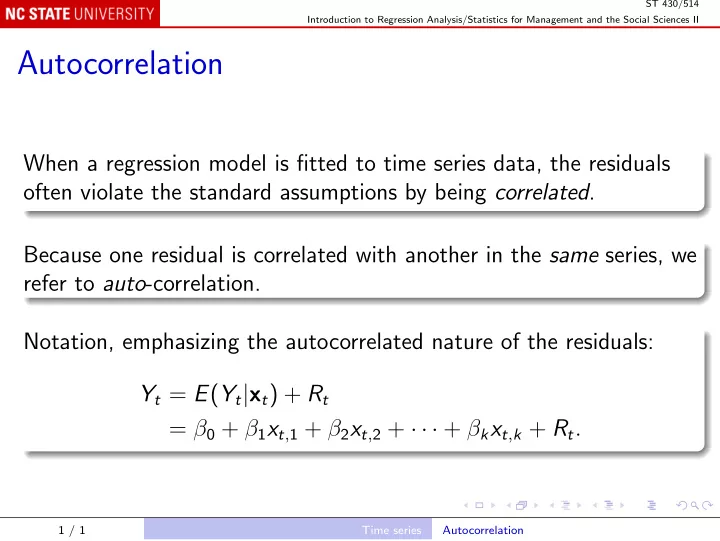
When a regression model is fitted to time series data, the residuals
- ften violate the standard assumptions by being correlated.
Because one residual is correlated with another in the same series, we refer to auto-correlation. Notation, emphasizing the autocorrelated nature of the residuals: Yt = E(Yt|xt) + Rt = β0 + β1xt,1 + β2xt,2 + · · · + βkxt,k + Rt.
1 / 1 Time series Autocorrelation