
SLIDE 1
- Dec. 2014
H.J. Wolfson - INRIA 1
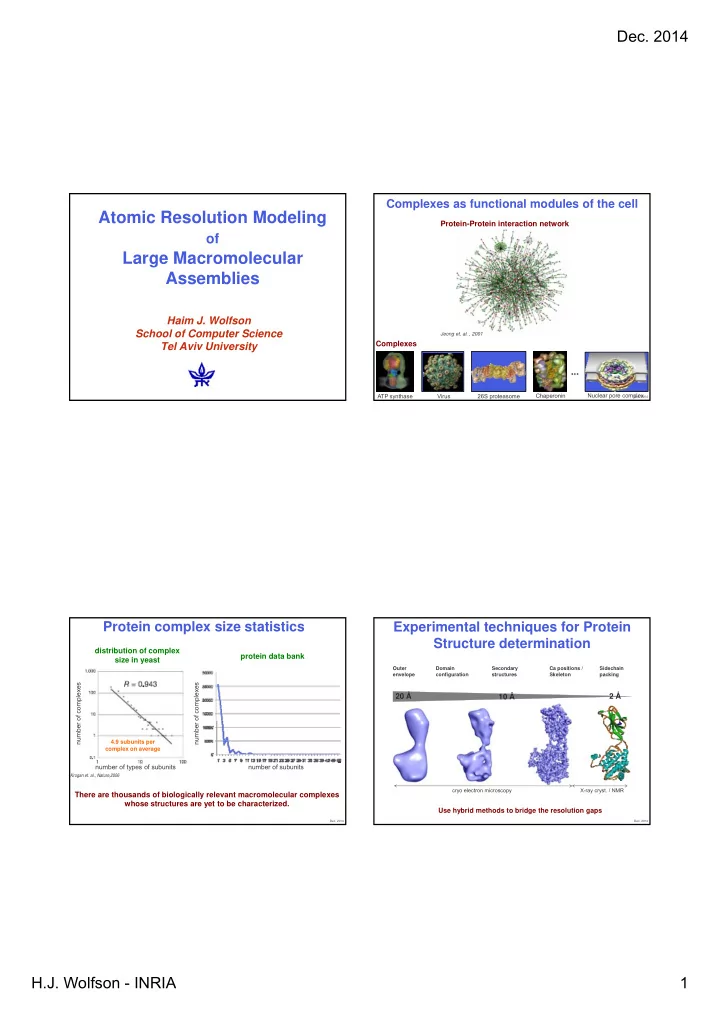
Atomic Resolution Modeling
- f
Large Macromolecular Assemblies
Haim J. Wolfson School of Computer Science Tel Aviv University
Protein-Protein interaction network
Complexes as functional modules of the cell
Jeong et. al. , 2001
Chaperonin Virus ATP synthase Nuclear pore complex
Complexes
26S proteasome
...
- Dec. 2014
Protein complex size statistics
- f complexes
distribution of complex size in yeast protein data bank
- f complexes
Krogan et. al., Nature,2006
number number of subunits number number of types of subunits
4.9 subunits per complex on average
There are thousands of biologically relevant macromolecular complexes whose structures are yet to be characterized.
- Dec. 2014
Experimental techniques for Protein Structure determination
20 Å 10 Å 2 Å
Ca positions / Skeleton Secondary structures Sidechain packing Outer envelope Domain configuration cryo electron microscopy X-ray cryst. / NMR
Use hybrid methods to bridge the resolution gaps
- Dec. 2014