
SLIDE 1
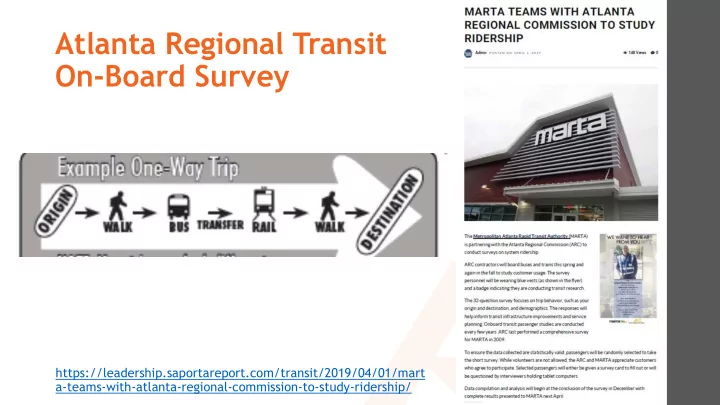
Atlanta Regional Transit On-Board Survey
https://leadership.saportareport.com/transit/2019/04/01/mart a-teams-with-atlanta-regional-commission-to-study-ridership/
Atlanta Regional Transit On-Board Survey - - PowerPoint PPT Presentation
Atlanta Regional Transit On-Board Survey https://leadership.saportareport.com/transit/2019/04/01/mart a-teams-with-atlanta-regional-commission-to-study-ridership/ Main purpose: collect public transit rider demographic &
https://leadership.saportareport.com/transit/2019/04/01/mart a-teams-with-atlanta-regional-commission-to-study-ridership/
➤ Main purpose: collect public transit rider demographic & origin-destination data ➤ Capture trip-making behavior, trip patterns & socio- economic characteristics of transit riders ➤ Provide inputs to update ARC’s regional activity- based travel demand model & support transit service planning ➤ Improve metro Atlanta’s competitiveness for FTA New Starts funding investment in new transit service ➤ Budget: $1.75M (20% local match from MARTA) ➤ Survey Sample Size: 10% ➤ Consultant Team Selected: ETC Institute with Connetics Transportation Group (DBE), Resource Systems Group, WSP , ANIK International (DBE) and Stat Team Inc. (DBE)
Source: Populus 2017 Nationwide Data
Source: National Transit Database
100,000 200,000 300,000 400,000 500,000 600,000 700,000 800,000 1Q-90 3Q-90 1Q-91 3Q-91 1Q-92 3Q-92 1Q-93 3Q-93 1Q-94 3Q-94 1Q-95 3Q-95 1Q-96 3Q-96 1Q-97 3Q-97 1Q-98 3Q-98 1Q-99 3Q-99 1Q-00 3Q-00 1Q-01 3Q-01 1Q-02 4Q-02 2Q-03 4Q-03 2Q-04 4Q-04 2Q-05 4Q-05 2Q-06 4Q-06 2Q-07 4Q-07 2Q-08 4Q-08 2Q-09 4Q-09 2Q-10 4Q-10 2Q-11 4Q-11 2Q-12 4Q-12 2Q-13 4Q-13 2Q-14 4Q-14 2Q-15 4Q-15 2Q-16 4Q-16 2Q-17 4Q-17 2Q-18
1996 Summer Olympics 2008 Gas Shortage 2009-10 Onboard Survey 2001-02 Onboard Survey
https://www.apta.com/resources/statistics/Documents/Ridership
Source: MARTA ridership data
This chart uses MARTA ridership data to show the change in average weekday ridership by rail station before and after the I-85 bridge collapse.
riders boarding stations on weekdays during March 31 – April 29 (after the collapse) to the average number of riders during weekdays March 24 – 31 (before the collapse).
% increase in ridership. Many of the northern stations experienced large increases, such as the Brookhaven station which had a 67% increase in ridership.
Source: MARTA ridership data
This map uses the same MARTA ridership data to show the change in average weekday ridership by station.
the % values shown in the previous chart.
symbolized by large bl blue ue circles had the greatest % increase in ridership. Many of the northern stations experienced large increases.
➤ Survey will provide info to transit operators for Title VI ➤ Survey will ask about new transit access/egress modes
(Uber, Lyft)
transit?
➤ Survey will leverage transit technologies and “Big Data” (Breeze Electronic Fare Card, “tap on/off” data, automatic passenger count, GTFS, etc.) ➤ https://cdn.atlantaregional.org/wp-content/uploads/arc- transit-on-board-survey-faq.pdf
➤ https://www.itsmarta.com/arc-survey-FAQs.aspx
➤ 11 MARTA Fixed Bus Routes (5, 15, 39, 71, 73, 78, 83, 89, 110, 121, 196) ➤ Average Weekday Ridership
➤ Recommended by FTA for Survey Data Expansion ➤ Supplement / Complement MARTA’s APC (Automated Passenger Counter) Data ➤ We have collected over 13,000 on-to-off pairs, and are 100% complete