Atelier Impact de lactivit humaine sur Impact de lactivit humaine - - PowerPoint PPT Presentation

atelier impact de l activit humaine sur impact de l
SMART_READER_LITE
LIVE PREVIEW

Atelier Impact de lactivit humaine sur Impact de lactivit humaine - - PowerPoint PPT Presentation

Atelier Impact de lactivit humaine sur Impact de lactivit humaine sur Atelier lenvironnement marin lenvironnement marin 15 :00 Introduction de latelier et mthode de travail (F. Mantoura) - 10 mn 15 :10


slide-1
SLIDE 1

24/01/2008

1

Colloque Euro-Méditerranée – 20-21/11/2007

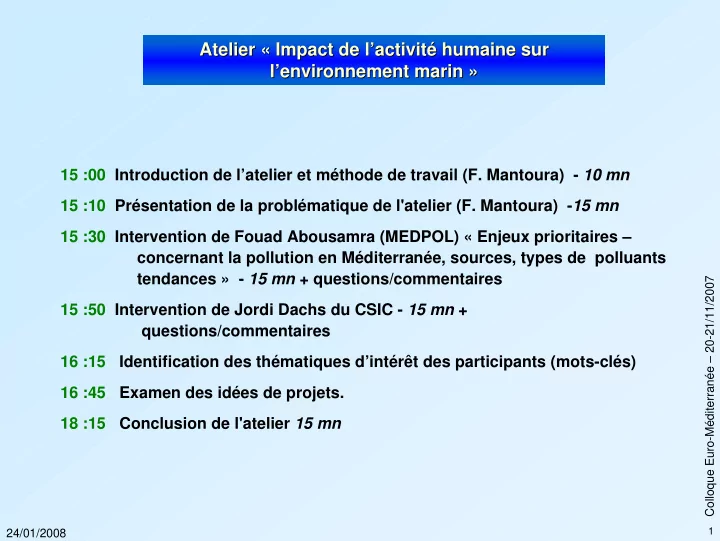
Atelier « Atelier « Impact de l’activité humaine sur Impact de l’activité humaine sur l’environnement marin l’environnement marin » »

15 :00 Introduction de l’atelier et méthode de travail (F. Mantoura) - 10 mn 15 :10 Présentation de la problématique de l'atelier (F. Mantoura) -15 mn 15 :30 Intervention de Fouad Abousamra (MEDPOL) « Enjeux prioritaires – concernant la pollution en Méditerranée, sources, types de polluants tendances » - 15 mn + questions/commentaires 15 :50 Intervention de Jordi Dachs du CSIC - 15 mn + questions/commentaires 16 :15 Identification des thématiques d’intérêt des participants (mots-clés) 16 :45 Examen des idées de projets. 18 :15 Conclusion de l'atelier 15 mn

slide-2
SLIDE 2

24/01/2008

1

Colloque Euro-Méditerranée – 20-21/11/2007

Spécificités de la Méditerranée Spécificités de la Méditerranée Mer quasi-fermée: moins de 1% de l’océan Grande diversité biologique (~30 % d’espèces endémiques) Dynamique complexe gouvernée par les forçages météo. Evénements paroxysmiques (crues, tempêtes, plongées d’eau denses…) Déficit hydrique compensé par des eaux atlantiques => bassin de concentration Cycles plus courts (renouvellement des masses d’eau en quelques décennies) que dans l’océan mondial => laboratoire pour l’observation des tendances affectant le milieu marin

slide-3
SLIDE 3

24/01/2008

2

Colloque Euro-Méditerranée – 20-21/11/2007

Pressions anthropiques Pressions anthropiques

21 pays riverains (400 Millions d’habitants) Artificialisation rapide du littoral (50% en 2025 ?, cf. Plan Bleu) Augmentation du trafic maritime Développement du tourisme et de l’industrialisation Exploitation des ressources marines Pollutions chroniques et accidentelles (rejets urbains, industriels, agricoles, déchets…) Introduction d’espèces nouvelles, parfois invasives Risques pour les services rendus par les écosystèmes marins aux populations des pays riverains

Dégradation et destruction des habitats Appauvrissement des écosystèmes Contamination des ressources marines

Transports physique et biologique => Les effets se manifestent souvent à l’échelle du bassin

slide-4
SLIDE 4

24/01/2008

3

Colloque Euro-Méditerranée – 20-21/11/2007

Face à ces enjeux Face à ces enjeux

Apporter des réponses concertées et coordonnées Développer les connaissances nécessaires pour :

Anticiper les réponses des écosystèmes aux forçages anthropiques Eclairer les mesures de gestion, de protection et de restauration des espaces marins naturels

Importance d’avoir des méthodologies communes et des données homogènes

slide-5
SLIDE 5

24/01/2008

4

Colloque Euro-Méditerranée – 20-21/11/2007

Mieux connaître l’état du milieu marin et les Mieux connaître l’état du milieu marin et les pressions qui s’y exercent pressions qui s’y exercent

Particulièrement en Méditerranée, des lacunes importantes existent dans la connaissance de l’état actuel des écosystèmes Pressions mal quantifiées, évolution de ces pressions mal connue (par exemple parts respectives des apports atmosphériques, fluviaux, urbains pour les contaminants chimiques) Importance de disposer d’états de référence pour détecter les changements dans le milieu (par exemple: niveaux inconnus pour certains polluants émergents)

slide-6
SLIDE 6

24/01/2008

5

Colloque Euro-Méditerranée – 20-21/11/2007

Nécessité de lever certains verrous dans la compréhension des mécanismes physiques et biogéochimiques Inconnues dans les processus majeurs qui gouvernent la dynamique du milieu et les transferts entre les différents compartiments marins. En particulier échanges entre les différents domaines géographiques et au sein des réseaux trophiques. Contributions respectives des processus physiques et biologiques dans les transferts Besoin de données d’observation à des échelles de temps et d’espace actuellement peu échantillonnées Connaissances nécessaires pour éclairer l’effet respectif des différentes pressions (apports anthropiques, changement climatique, espèces invasives, etc.) sur les écosystèmes

slide-7
SLIDE 7

24/01/2008

6

Colloque Euro-Méditerranée – 20-21/11/2007

Partager méthodes et outils Partager méthodes et outils

Manque de données de référence fiables et/ou comparables en Méditerranée Promouvoir la synergie et l’échange entre les base de données existantes Appuyer la collecte coordonnée et soutenue de données marines environnementales (biodiversité, substances chimiques…) Outils d’observation et d’analyse, gestion de données, modélisation Stratégie pertinente et coordonnée de protection

slide-8
SLIDE 8

U U N N E E P P / / M M A A P P

Regional glance on importance

  • f LBS in the Mediterranean

Fouad Abousamra UNEP/MAP MEDPOL Programme Officer

slide-9
SLIDE 9

U U N N E E P P / / M M A A P P

MEDPOL

  • Assessment and control of pollution: LBS,

Dumping, Hazardous Waste Protocols

  • Phase I: Capacity Building ,monitoring

programmes

  • Phase II: National monitoring programmes.
  • Phase III: Trends and compliance monitoring ,

Strategic Action Programme(SAP)

  • Phase IV:Continuation of Phase III in the

framework of ecosystem approach

slide-10
SLIDE 10

U U N N E E P P / / M M A A P P

WASTEWATER TREATMENT PLANTS (WWTPs) IN COASTAL CITIES 2004

Number of coastal cities served by WWTPs 69% WWTPs Under Construction/Pr

  • jected

6% Number of coastal cities without WWTPs 21% WWTPs In maintenance/Te mporarly out of

  • peration/No

information 4%

slide-11
SLIDE 11

U U N N E E P P / / M M A A P P

DEGREE OF TREATMENT Primary 18% Tertiary 15% Unknown 10% Secondar y 55% Pretreatm ent 2%

SECONDARY 52% UNKNOWN 13% PRIMARY 23% TERTIARY 12%

PRIMARY UNKNOWN TERTIARY SECONDARY

slide-12
SLIDE 12

U U N N E E P P / / M M A A P P

DISCHARGE OF TREATED WASTEWATER

DI : discharge directly into the sea 16 % Ss : discharge through many small submarine outfalls 1 % SO : discharge through a submarine

  • utfall 11%

Other (desert, groundwater , lake etc) 8% No information 56% RE : discharge is re

  • used

8%

slide-13
SLIDE 13

U U N N E E P P / / M M A A P P

DISCHARGE OF UNTREATED WASTEWATER

No information 23% DI: discharge directly into the sea 51% Ss: discharge through many small submarine outfalls 16% SO: discharge through a submarine outfall 3% RE: discharge is re- used 0% Other (desert, groundwater, lake etc) 7%

slide-14
SLIDE 14

U U N N E E P P / / M M A A P P

The Kosovo conf lict

slide-15
SLIDE 15

U U N N E E P P / / M M A A P P

slide-16
SLIDE 16

U U N N E E P P / / M M A A P P

Maritime Traffic

ACCIDENTAL POLLUTION

38

slide-17
SLIDE 17

U U N N E E P P / / M M A A P P

Untreated Sewage

slide-18
SLIDE 18

U U N N E E P P / / M M A A P P

slide-19
SLIDE 19

U U N N E E P P / / M M A A P P

slide-20
SLIDE 20

U U N N E E P P / / M M A A P P

slide-21
SLIDE 21

U U N N E E P P / / M M A A P P

slide-22
SLIDE 22

U U N N E E P P / / M M A A P P

slide-23
SLIDE 23

U U N N E E P P / / M M A A P P

slide-24
SLIDE 24

U U N N E E P P / / M M A A P P

slide-25
SLIDE 25

U U N N E E P P / / M M A A P P

slide-26
SLIDE 26

U U N N E E P P / / M M A A P P

slide-27
SLIDE 27

U U N N E E P P / / M M A A P P

slide-28
SLIDE 28

U U N N E E P P / / M M A A P P

slide-29
SLIDE 29

U U N N E E P P / / M M A A P P

slide-30
SLIDE 30

U U N N E E P P / / M M A A P P Transboundary sites at risk related to Mediterranean marine biodiversity

slide-31
SLIDE 31

U U N N E E P P / / M M A A P P

Ecosystems associated with highest pollutant-load hot spots

slide-32
SLIDE 32

U U N N E E P P / / M M A A P P

Geographical Coverage of LBS Protocol and Pollution Hot Spots

slide-33
SLIDE 33

U U N N E E P P / / M M A A P P

Dumping Sites in the Mediterranean (1995-2001)

slide-34
SLIDE 34

U U N N E E P P / / M M A A P P

Desalinated Water

Percent of changes 1997-2002

Country % increase Algeria Cyprus 44 France Greece Israel 100 Italy 20 Lebanon Libya 10 Malta Morocco Spain 52 Tunisia Turkey 44

Ref: 1998 –2002 IDA Worldwide Desalting Plants Inventory Report No. 15. WANGNICK CONSULTING Gmbh, sponsored by International Desalination Association.

slide-35
SLIDE 35

U U N N E E P P / / M M A A P P

Impact of brine in the outfall vicinity

slide-36
SLIDE 36

U U N N E E P P / / M M A A P P

Area at 250 m distance from the outfall

slide-37
SLIDE 37

U U N N E E P P / / M M A A P P

Le programme de dessalement d’eau de mer

El Tarf1 50 000 m3/j Skikda 100 000 m3/j Alger 3 100 000 m3/j Alger1 200 000 m3/j Alger 2 120 000 m3/j Tipaza Ouest 100 000 m3/j Chlef 200 000 m3/j Mostaganem 200 000 m3/j Oran 1 90 000 m3/j Oran 2 500 000 m3/j Ain Temouchent 200 000 m3/j Tlemcen 1 200 000 m3/j Tlemcen 2 200 000 m3/j El Tarf2 15 000 m3/j Bejaia 90 000 m3/j Jijel 70 000 m3/j

Programme dessalement eau de mer Unités de dessalement proposées - unités en m3/j Région Nombre d’unités 2006 2010 2020- 2030 Ouest 6 90 000 1 390 000 1 390 000 Centre 6 720 000 810 000 Est 4 150 000 380 000 Total programme dessalement 16 90 000 2 260 000 2 580 000 Total du programme de dessalement en Millions de m3/an 32.9 825 942

4/7

Développement sectoriel à moyen et long terme

Messaoud TERRA, DAEP-MRE/ 3 Rue du Caire Kouba / Alger.

slide-38
SLIDE 38

U U N N E E P P / / M M A A P P

Algeria

  • Algeria :942.000.000 m3/d by 2020
  • Assuming 50% Thermal process
  • At an average 500 microg/liter of

copper

  • 60% of brine discharge
  • Copper input: 27.660.000.000 kg/y
  • Regional input for 2003: 51910 kg/y
slide-39
SLIDE 39

U U N N E E P P / / M M A A P P

Algeria

  • Algeria 942.000.000 m3/y
  • Brine input range:

6.594.000.000 -8.578.000.000 m3/y

  • Other chemicals: Cd, Zn, SOx,NOx ,

dioxines ,PAHs ….

slide-40
SLIDE 40

U U N N E E P P / / M M A A P P

Recent development at regional level

  • Actions to reduce inputs :

– Implementation of SAP/NAPs – EU 2020 initiative

  • Reduction of inputs
  • Research
  • Capacity building

– GEF .MAP.WB strategic partnership for LME

  • Reduction of inputs
  • Capacity building
slide-41
SLIDE 41

U U N N E E P P / / M M A A P P

Recent development at regional level

  • Adoption of ecosystem approach for the

management of human activities .

– Pilot studies 2008-2009 to develop assessments – Development of indicators2003-… – Identification of ecoregions 2008 ?? – Identification of EQOs

slide-42
SLIDE 42

U U N N E E P P / / M M A A P P

Regional needs

  • Effective and targetted cooperation between

North-South scientific institutions.

  • Scientific investigations in open sea .
  • Better understanding of the marine ecosystem.
  • Identification of emerging issues related to

pollution

  • Work towards more policy oriented sciences.
slide-43
SLIDE 43

U U N N E E P P / / M M A A P P

Regional needs

  • Development of EQOs
  • Diffuse sources: MAP-IOC,EUROHARP
  • Riverine inputs: GEF
  • Ranking of priority substances.
slide-44
SLIDE 44

U U N N E E P P / / M M A A P P

Merci de votre attention

For additional information , contactez: Fouad Abousamra 46, Vas.Konstantinou 11635, Athens, Greece Tel:+302107273116 Fax:+302107253196 Email:fouad@unepmap.gr

slide-45
SLIDE 45

Organic Pollutants in the Mediterranean Sea and Atmosphere

Jordi Dachs

Department of Environmental Chemistry, Institute for Chemical and Environmental Research Consejo Superior de Investigaciones Científicas (CSIC) Barcelona, Catalunya, Spain.

slide-46
SLIDE 46

Organic Pollutants in the Mediterranean Sea

CG CW CP CA

Air-Water Exchange Water-Particle Partitioning Gas-Particle Partitioning Dry Deposition Wet Deposition Vertical Fluxes Advection Bioaccumulation Continental Inputs Atmospheric Transport Degradation

CG CW CP CA

Air-Water Exchange Air-Water Exchange Water-Particle Partitioning Gas-Particle Partitioning Dry Deposition Wet Deposition Dry Deposition Wet Deposition Vertical Fluxes Advection Bioaccumulation Bioaccumulation Continental Inputs Atmospheric Transport Degradation

  • Regional and spatial variability; sources and processes.
  • Short term and seasonal variability, long-term time trends.
  • Inputs of pollutants to aquatic food webs. Ecotoxicology.
  • Mixtures of chemicals. Which chemicals should we study? Legacy vs.

Emerging pollutants

  • Field versus modelling work
slide-47
SLIDE 47

Air

(aerosol + gas phase)

Water

(particulate + dissolved phase)

Simultaneous samples Plankton June 2006 May 2007

Sampling cruises in the Mediterranean Sea

45N 30N 5W 35W 45N 30N 5W 35W 45N 30N 5W 35W 45N 30N 5W 35W 45N 30N 5W 35W

slide-48
SLIDE 48

50 100 150 200 0,0 1,0 2,0 3,0 0,0 0,1 0,1 0,2 0,2 100 200 300 400 Fluorene Dibenzothiophene Methyldibenzothiophene Phenanthrene Methylphenantrene Dimethylphenantrene Anthrathene Fluoranthrene Pyrene Benzo(a)anthracene Crysene Benzo(b)fluoranthrene Benzo(k)fluoranthrene Benzo(a)pyrene Benzo(e)pyrene Perylene Indeno(1,2,3-cd)pyrene Dibenzo(a,h)anthracene Benzo(ghi)perylene

PAHs PCBs

5 10 15 20 25

GAS PHASE IN AIR (ng/m3) GAS PHASE IN AIR (ng/m3) DISSOLVED PHASE IN SURFACE WATER (pg/L) PLANKTON (ng/g)

0,0 0,1 0,1 0,2 10 20 30 40 50 10 20 30 40 50

4 8 12 28 31 33 49 52 70 87 95 118 128 138 149 151 153 158 169 170 171+156 177 183 187 191 194 195 201 205 208

DISSOLVED PHASE IN SURFACE WATER (pg/L) PARTICULATED PHASE IN SURFACE WATER (pg/L) PARTICULATED PHASE IN SURFACE WATER (pg/L) PLANKTON (ng/g) PARTICULATE PHASE IN AIR (ng/m3)

slide-49
SLIDE 49

( g )

5ºW 35ºE 30º N 45º N

0,4 0,2 0,33 0,49 0,27 0,23 0,26 0,42 0,43 0,97 1,26 0,72 0,52 0,34 0,48

( g )

5ºW 35ºE 30º N 45º N

0,4 0,2 0,33 0,49 0,27 0,23 0,26 0,42 0,43 0,97 1,26 0,72 0,52 0,34 0,48

5ºW 35ºE 30º N 45º N

0,4 0,2 0,4 0,2 0,33 0,33 0,49 0,49 0,27 0,27 0,23 0,23 0,26 0,26 0,42 0,42 0,43 0,43 0,97 0,97 1,26 1,26 0,72 0,72 0,52 0,52 0,34 0,48 0,34 0,48

p (pg )

5ºW 35ºE 30ºN 45ºN

204,7 307,3 196,6 428,8 591,2 427,2 387,9 368,6 336,5 323,1 344,46 162,4

p (pg )

5ºW 35ºE 30ºN 45ºN

204,7 307,3 196,6 428,8 591,2 427,2 387,9 368,6 336,5 323,1 344,46 162,4

5ºW 35ºE 30ºN 45ºN

204,7 307,3 204,7 307,3 196,6 196,6 428,8 428,8 591,2 591,2 427,2 387,9 427,2 387,9 368,6 368,6 336,5 336,5 323,1 323,1 344,46 162,4 344,46 162,4

PCBs (41 congeners) in the Mediterranean Sea and Atmosphere

Gas Phase (ng m-3) Seawater (pg L-1)

slide-50
SLIDE 50

59.1

  • 20.6 -30
  • 30.6
  • 95
  • 94

4.5 66.4 100 101.4 75.6 35.5

  • 17.8
  • 47.1
  • 1.9
  • 21.7
  • 150.0
  • 100.0
  • 50.0

0.0 50.0 100.0 150.0

MALLORCA

  • SARDINIA

SARDINIA

  • SICILY

IONIAN SEA AEGEAN SEA BLACK SEA

Air-water flux (ng m-2 d-1)

÷ ⎠ ⎞ ⎜ ⎝ ⎛ − =

W A AW AW

C H C k F '

Regionality in Air-water exchange of PCBs in the Mediterranean Sea

slide-51
SLIDE 51

Regionality in PAH sources in the Mediterranean Sea

1596.2 1363.1 753.6 812.3 708.6 648.9 450.3 393.7 405.8 440.8 694.7 551.9

5ºW 35ºE 30ºN 45ºN

1596.2 1363.1 753.6 812.3 708.6 648.9 450.3 393.7 405.8 440.8 694.7 551.9 1596.2 1363.1 753.6 812.3 708.6 648.9 450.3 393.7 405.8 440.8 694.7 551.9 1596.2 1596.2 1363.1 753.6

1363.1

753.6 812.3 812.3 708.6 708.6 648.9 450.3 648.9 450.3 393.7 393.7 405.8 440.8 440.8 694.7 551.9 694.7 551.9

5ºW 35ºE 30ºN 45ºN

Dissolved Phase (pg L-1)

1.3 1.1 1.1 1.7 1.6 1.7 1.3 1.9 1.7 4.2 2.8 2.6 0.0 0.5 1.0 1.5 2.0 2.5 3.0 3.5 4.0 4.5

Near Mallorca Near Mallorca Sardinia-Sicily Sicily Malta -Greece Greece Greece Egean Egean Marmara sea Black Sea Black Sea

Phen/MPhen

Phenanthrene / MethylPhenanthrene

slide-52
SLIDE 52

Off-shore Banyuls sur Mer Off-shore Barcelona SW Mediterranean

Nonylphenols in Western Mediterranean Sea and Atmosphere

  • 30000
  • 20000
  • 10000

10000 20000 30000 40000

S e p t e m b e r , 2 1 M a r c h , 2 2 J u n e , 2 2 S e p t e m b e r , 2 1 M a r c h , 2 2 J u l y , 2 2 J u n e , 2 1

Flux (ng d-1 m-2) A-W Exchange Dry Deposition

Of-shore Barcelona Of-shore Banyuls sur Mer SW Mediterranean

n.a. n.a.

slide-53
SLIDE 53

To which extend atmospheric inputs control water and biota concentrations of POPs?

(Jurado et al. 2007, Mar. Pollut. Bull)

slide-54
SLIDE 54

CW

T [ng m-3]

A

PCB 28 depth [m] CW

T [ng m-3]

A

PCB 28 depth [m]

precipitation precipitation

PCB 28

(Jurado et al. 2007, Mar. Pollut. Bull 54, 441-451)

Influence of turbulence on water column concentrations and variability (Example: Adriatic Sea)

slide-55
SLIDE 55

10 20 30 40 April May June July August Sept Oct Nov Dec Jan Febr March April May 250m 1440m 2850m

ΣBenzofluoranthene Flux ng m-2 d-1 mg m-2 d-1

100 200 300 Mass Flux

ng m-2 d-1

Biogeochemical Coupling of Atmospheric Deposition and Settling Fluxes

20 40 60

Settling Flux Atmospheric Dep.

  • Atm. Dep.
  • Sed. Traps
  • L. Méjanelle, UPMC
slide-56
SLIDE 56

Archive sédiment aire de la cont aminat ion Thau 1800 - 2005

10 20 30 40 50 60 70 80

Prof ondeur (cm)

1800 1840 1880 1920 1960 2000 5 10 15

Année

1940 ± 5 1987 ± 3 ∑ PCB7 (µg.kg-1 p.s. )

k = - 0, 034 an t 1/ 2= 20, 6 an

  • 0,6
  • 0,4
  • 0,2

0,0 1985 1990 1995 2000 2005 2010

ln(Ct / C0)

Tendance 1985 - 2005

  • J. Tronczynski BE_LBCO
slide-57
SLIDE 57

Threshold effect concentrations of PCB in Mediterranean Sea Sediments

  • Unknown for other matrixex

(water, plankton, fish…).

  • Unknown for other chemicals.
  • Need of intercalibration between

laboratories.

  • Need of long time-series.

(Gómez-Gutiérrez et al.

  • Environ. Internal. 2007)
slide-58
SLIDE 58

Net air-water exchange flux [pg m-2 d-1] Net air-water exchange flux [pg m-2 d-1] Wet deposition flux [pg m-2 d-1] Wet deposition flux [pg m-2 d-1] Dry deposition flux [pg m-2 d-1] Dry deposition flux [pg m-2 d-1]

Atmospheric Deposition of PCBs to European MarineWaters (PCB 153)

  • Need for models that couple atmospheric

processes, oceanic circulation, coastal inputs and trophic webs (Jurado et al. Environ. Sci. Technol. 2004 Jurado et al. Environ. Sci. Technol. 2005.)

slide-59
SLIDE 59

PBDE and PAH atmospheric deposition

100 200 300 Aug 08-Sep 03 Sep 03-15 Sep 15-29 Sep 29-Oct 15 Oct 15-Nov 05 Nov 05 -12 Nov 12-20 Nov 20-Dec 03 Dec 03-12 Dec 12-Jan 02 Jan 02-15 Jan 15-Feb 02 Feb 02-18 Feb 18-Mar 06 Mar 06- Apr 02 Apr 02-15 Apr 15-May 01 May 01-Jun 02 Jun 02-17 Jun 17-Jul 22 Jul 22-Aug 04 Aug 04-23 Aug 23-31 Aug 31-Sep 15 Sep 15-Oct 02 Oct 02-13 Oct 13-Nov 04 Nov 04-10 Nov 12-25 Nov 25-Dec 09 Dec 09-Jan 02 Jan 02-20 Jan 20-Feb 21 Feb 21-Apr 06 Apr 06-May 05 May 05- Jun BDE 47 BDE 100 BDE 99 BDE 153 BDE 183 BDE 209 SUM PAH Flux

pg m-2 d-1 ng m-2 d-1 2001 2002 2003

  • L. Méjanelle, UPMC

Atmospheric Deposition of Polybrominated Biphenyl Ethers and Polycyclic Aromatic Hydrocabons

slide-60
SLIDE 60

Persistent Organic Pollutants (POPs)

Lohmann, R., K. Breivik, J. Dachs, D. Muir. Environ. Poll. 2007

Legacy POPs Emerging POPs

slide-61
SLIDE 61

The anthropogenic chemosphere, last 30 years (except from combustion sources)

Muir & Howard. Environ. Sci. Technol. 40, 7157-7166, 2006.

slide-62
SLIDE 62

Potential POPs: Bioaccumulative and Persistent and with long-range transport potential

Muir & Howard. Environ. Sci. Technol. 40, 7157-7166, 2006.

slide-63
SLIDE 63

150 300 450 600 750 T3 T9 T11 T13 T15 T16 R6 R14 R18 Concentració (ng/L) Antiinflammatories Lipid regulators Antidepressants Antihistaminics Antibiotics B-blockers T12 R14 R17 T16 T15 T9 R1 T3 R18 T8 R4 R6 T7 T13 T11 T10 T5 T2

TORTOSA LLEIDA ZARAGOZA HUESCA MONZÓN SABIÑÁNIGO PAMPLONA LOGROÑO VITORIA TUDELA

T12 R14 R17 T16 T15 T9 R1 T3 R18 T8 R4 R6 T7 T13 T11 T10 T5 T2

TORTOSA LLEIDA ZARAGOZA HUESCA MONZÓN SABIÑÁNIGO PAMPLONA LOGROÑO VITORIA TUDELA

T12 R14 R17 T16 T15 T9 R1 T3 R18 T8 R4 R6 T7 T13 T11 T10 T5 T2

TORTOSA LLEIDA ZARAGOZA HUESCA MONZÓN SABIÑÁNIGO PAMPLONA LOGROÑO VITORIA TUDELA

Emerging (non-regulated) POPs: Pharmaceuticals in the Ebro River

Atenolol Sotalol Metoprolol Propranolol Erythromycin Azithromycin Sulfamethaxole Trimethoprim Ofloxacin Lansoprazole Loratadine Famotidine Ranitidine Carbamazepine Fluoxetine Paroxetine Clofibric acid Gemfibrozil Bezafibrate Pravastatin Mevastatin Ibuprofen Naproxen Ketoprofen Indomethacine Diclofenac Acetaminophen Mefenamic acid Propyphenazone b-blokers Antibiotics Antiulcer agents Psychiatric drugs Lipid regulator and cholesterol lowering statin drugs Analgesics and antiinflammatories Atenolol Sotalol Metoprolol Propranolol Erythromycin Azithromycin Sulfamethaxole Trimethoprim Ofloxacin Lansoprazole Loratadine Famotidine Ranitidine Carbamazepine Fluoxetine Paroxetine Clofibric acid Gemfibrozil Bezafibrate Pravastatin Mevastatin Ibuprofen Naproxen Ketoprofen Indomethacine Diclofenac Acetaminophen Mefenamic acid Propyphenazone b-blokers Antibiotics Antiulcer agents Psychiatric drugs Lipid regulator and cholesterol lowering statin drugs Analgesics and antiinflammatories

Barceló et al. Personal comunication

slide-64
SLIDE 64

Naiara Berrojalbiz, M. Carmen Valle, M. José Ojeda, Elena Jurado Silvia Lacorte, Damià Barceló

Department of Environmental Chemistry, IIQAB-CSIC, Barcelona, Catalunya, Spain

Laurence Méjanelle, Ioanna Bouloubassi

Université Pierre et Marie Curie, France.

José-Manuel Zaldivar, Dimitar Marinov…

Institute for Environment and Sustainability, JRC, Ispra, Italy.

Carlos Duarte, Susana Agústí

Institut Mediterrani d’Estudis avançats, IMEDEA-CSIC, Mallorca, Spain.

Jacek Tronczinski

IFREMER, France.

Collaborators

Funded by:

  • Spanish Ministry of Education and Science (projects MIMOSA, AMIGOS).
  • European Commission (projects THRESHOLDS, AIRWIN)
  • ….
slide-65
SLIDE 65

Colloque Euro-Méditerranée – 20-21/11/2007 Etat initial Voies d’apports ponctuel et diffus . Cours d’eau . Atmosphère . Agglomérations . Epaves . Trafic maritime Compréhension des phénomènes Dynamique des contaminants Monitoring Hot-spots Bancarisation Appropriation des résultats pour la gestion Conséquences économiques Contaminants émergents, screening Réponse des écosystèmes Transfert dans la chaine trophique Connaissance des forçages physiques et chimiques Observation (réseaux), expérimentation, modélisation Approche intégrée (géographique, pluridisciplinaire) et écosystémique (end to end) Tendances

slide-66
SLIDE 66

24/01/2008

1

Colloque Euro-Méditerranée – 20-21/11/2007

1 1 -

  • Réseau d’observation de la contamination

Réseau d’observation de la contamination chimique des eaux côtières méditerranéennes chimique des eaux côtières méditerranéennes Approche coordonnée et pérenne de la surveillance de la contamination chimique du milieu marin côtier Se baser sur l’expérience acquise par le PAM/MEDPOL, la CIESM (mussel watch radionucléides) et les projets Mytilos et Mytimed Compléter la couverture de Méditerranée dans le sud-est du bassin Actions possibles

  • Harmonisation et mise en réseau des bases de données
  • Zooms sur les hot spots
  • Campagnes récurrentes
  • Extension de la liste des substances analysées
slide-67
SLIDE 67

24/01/2008

2

Colloque Euro-Méditerranée – 20-21/11/2007

2 2 -

  • Impact des grandes métropoles côtières

Impact des grandes métropoles côtières méditerranéennes sur l’environnement marin méditerranéennes sur l’environnement marin Fraction importante et en augmentation de la population côtière Les métropoles sont souvent associées à une activité industrielle et portuaire => forte pressions (rejets, artificialisation…) Multiples usages du milieu marin Connaissance des écosystèmes et des pressions. Méthodologie de gestion et de remédiation pour préserver la qualité du milieu Méditerranée occidentale (Barcelone, Marseille, Naples, Tunis, Alger ? ) + bassin oriental ? Proposition:

  • Organisation d’un atelier spécifique afin de préciser les objectifs et le

périmètre du projet

slide-68
SLIDE 68

24/01/2008

3

Colloque Euro-Méditerranée – 20-21/11/2007

3 3 -

  • Programme de campagnes hauturières pour établir un

Programme de campagnes hauturières pour établir un état de référence ( état de référence (baseline baseline) pour la chimie et la biologie au ) pour la chimie et la biologie au large en Méditerranée large en Méditerranée

Collecte systématique de données à l’échelle du bassin : surtout données physiques. Quelques projets sur les éléments biogènes majeurs (C, N, P) Contaminants chimiques et biodiversité au large : peu de données homogènes sur la Méditerranée Manque réel de données sur les substances émergentes (colonne d’eau sédiments, biota) Hétérogénéité des données => difficultés pour établir un état de la biodiversité Propositions

  • Mise en place d’une action concertée. Processus de labellisation des

campagnes

  • Campagne pilote en Méditerranée occidentale ?
slide-69
SLIDE 69

Colloque Euro-Méditerranée – 20-21/11/2007

4 - Building of a project

  • n the Response of Mediterranean Ecosystems

to Changes of Climatic Forcings and Anthropogenic Pressure

Component of a large multidisciplinary Mediterranean Experiment (hydrology cycle, aerosols, marine ecosystems,…) supported by the INSU (Institut National des Sciences de l’Univers) spanning over the next decade

Colloque International EuroMéditerranée – Toulon, 20-21 Septembre 2007

Built on knowledges and tools developped during on-going EU programs

  • SESAME (assessment and modelling of pelagic ecosystems)
  • HERMES (description of sensitive deep ecosystems)

Aims to define the present (reference) state and improve our predictive capabilities monitor the changes of physical and chemical forcings and

  • f marine ecosystems

to provide answers to socio-economic requests Propositions Set up an international group in order to discuss scientific priorities and to define the scope of the project in agreement to EU priorities Set a network of long-term marine observatories (from the coast to the deep sea) for monitoring changes in environnemental conditions and ecosystems

slide-70
SLIDE 70

24/01/2008

5

Colloque Euro-Méditerranée – 20-21/11/2007

5 - Projet méditerranéen sur la biodiversité côtière (cartographie et stratégie de préservation) Méditerranée : hot spot pour la biodiversité Nombreuses lacunes sur la connaissance des habitats (notamment dans les parties sud et est) Intérêt d’une approche globale sur le bassin pour établir une stratégie de préservation et contribuer à la définition d’outils communs Propositions

  • Identification des principaux hot spots
  • Constitution d’un « référentiel » en base de données cartographique
  • Sélection de sites « témoins » pour suivre l’évolution temporelle des

peuplements

slide-71
SLIDE 71

24/01/2008

6

Colloque Euro-Méditerranée – 20-21/11/2007

I dea for Project 6 : I dea for Project 6 : SCREENI NG OF EMERGENT POLLUTANTS I N SEDI MENTS SCREENI NG OF EMERGENT POLLUTANTS I N SEDI MENTS FROM HOT SPOTS OF THE MEDI TERRANEAN COAST FROM HOT SPOTS OF THE MEDI TERRANEAN COAST

Last decades: Characterization of persistent organic pollutants (PAHs, PCBs and

  • rganochlorine

pesticides) and heavy metals in the Mediterranean Coast (sediments and organisms): MEDPOL PROGRAM 30000 substances (production> 1 ton/ year) Non-regulated pollutants (pesticides, personal care products, surfactants, pharmaceutical products, …) access to the marine environment (direct effluents, river discharges,…): more than 80 pharmaceutical products and metabolites has been detected in rivers, ground waters and wastewater effluents(Heberer, 2002b).

Colloque Euro Colloque Euro-

  • M

Mé é diterran diterrané ée e « « Construire ensemble les r Construire ensemble les ré éponses scientifiques aux d ponses scientifiques aux dé éfis pos fis posé és par la mer M s par la mer Mé é diterran diterrané ée e» » Toulon Toulon -

  • 20 et 21 novembre 2007

20 et 21 novembre 2007

Fate, Distribution and Effects NOT EVALUATED I N THE MEDI TERRANEAN SEA.

Spanish I nstitute

  • f Oceanography
slide-72
SLIDE 72

24/01/2008

7

Colloque Euro-Méditerranée – 20-21/11/2007

I dea for Project : I dea for Project : SCREENI NG OF EMERGENT POLLUTANTS I N SEDI MENTS SCREENI NG OF EMERGENT POLLUTANTS I N SEDI MENTS FROM HOT SPOTS OF THE MEDI TERRANEAN COAST FROM HOT SPOTS OF THE MEDI TERRANEAN COAST Objective:

To develop a pilot study in sediments from several hot spots to screen the presence of regulated and non-regulated pollutants (emergent pollutants).

Study Area: areas with a great anthropogenic influence (bays, river mouths,…), as consequence of urban and/ or industrial wastewater effluents, agricultural activities,… Relevance: the determination of non-regulated pollutants levels complete the available information about regulated ones to discuss accurately the observed effects on biomarkers. I dentification and quantification of non-regulated pollutants in hot-spots: first step to assess the possible effects of these pollutants in the marine environment.

Colloque Euro Colloque Euro-

  • M

Mé é diterran diterrané ée e « « Construire ensemble les r Construire ensemble les ré éponses scientifiques aux d ponses scientifiques aux dé éfis pos fis posé és par la mer M s par la mer Mé é diterran diterrané ée e» » Toulon Toulon -

  • 20 et 21 novembre 2007

20 et 21 novembre 2007

Spanish I nstitute

  • f Oceanography
slide-73
SLIDE 73

24/01/2008

8

Colloque Euro-Méditerranée – 20-21/11/2007

E zio Amato

ICRAM

Istituto Centrale per la Ricerca Scientifica e Tecnologica Applicata al Mare

e.amato@icram.org

7 7 – – Sphipwrecks Sphipwrecks and and ordnances

  • rdnances lying

lying on

  • n the

the seabed seabed