
SLIDE 1
Discover theworld at Leiden University Discover theworld at Leiden University
At risk of poverty rates and poverty alleviation via T/ B-system s - - PowerPoint PPT Presentation
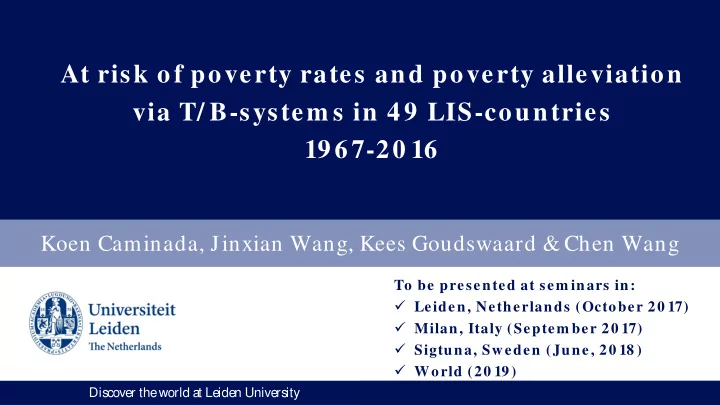
At risk of poverty rates and poverty alleviation via T/ B-system s in 4 9 LIS-countries 1967-20 16 Koen Caminada, Jinxian Wang, Kees Goudswaard & Chen Wang To be presented at sem inars in: Leiden, Netherlands (October 20 17) Milan,
Discover theworld at Leiden University Discover theworld at Leiden University
Discover theworld at Leiden University
Discover theworld at Leiden University
Must read (based on massive data collection) Thomas Piketty (2014), Capital in the Twenty- First Century Anthony Atkinson (2015), Inequality; What can be done? Joseph Stiglitz (2015), Rewriting the Rules of the American Economy. An Agenda for Growth and Shared Prosperity Angus Deaton (2013), The Great Escape OECD (2008), Growing Unequal? OECD (2011), Divided We Stand: Why Inequality Keeps Rising OECD (2015), In It Together: Why Less Inequality Benefits All highlights
Discover theworld at Leiden University
Discover theworld at Leiden University
Discover theworld at Leiden University
Discover theworld at Leiden University
Discover theworld at Leiden University
Discover theworld at Leiden University
around
around
around
around
around
Discover theworld at Leiden University
Koen Caminada Jinxian Wang Kees Goudswaard Chen Wang (project leader)
Assembled Datasets (URL: www.econom ie.leidenuniv.nl)
Discover theworld at Leiden University
Discover theworld at Leiden University
Discover theworld at Leiden University
Discover theworld at Leiden University
Discover theworld at Leiden University
Discover theworld at Leiden University
Discover theworld at Leiden University
Discover theworld at Leiden University
Discover theworld at Leiden University
Discover theworld at Leiden University
Discover theworld at Leiden University
Discover theworld at Leiden University
Discover theworld at Leiden University
Discover theworld at Leiden University
Discover theworld at Leiden University
Discover theworld at Leiden University
Discover theworld at Leiden University
Discover theworld at Leiden University
Discover theworld at Leiden University
Discover theworld at Leiden University
Discover theworld at Leiden University
Discover theworld at Leiden University
Discover theworld at Leiden University
Discover theworld at Leiden University
Discover theworld at Leiden University
Discover theworld at Leiden University
k
l
T B pri B pri Tl
− + +
Discover theworld at Leiden University
Discover theworld at Leiden University
Discover theworld at Leiden University
LIS Dataset Gross / net
Primary income (a) Gross income (b) Disposable income (c) Absolute (a-c) Relative (a-c)/a*100 Old-age/ Disability/ Survivor Sickness Family/ Children Education Unemployment Housing General/food/ medical assistance Other transfers Income taxes Residual
panel a: LIS English speaking countries Australia 2016 Gross 32,5 19,8 21,3 11,2 34% 6,9 0,0 4,1 0,2 0,7 0,4 0,0 0,3
0,1 Ireland 2010 Gross 46,4 16,1 16,6 29,8 64% 11,9 1,0 6,5 0,3 7,5 1,5 0,4 0,8
0,4 United Kingdom 2013 Gross 40,5 14,0 16,3 24,2 60% 14,8 0,0 5,5 0,1 0,4 3,1 1,6 1,3
United States 2016 Gross 33,9 21,3 24,3 9,7 28% 9,6 0,1 1,8 0,4 0,2 0,1 0,6
0,0 panel b: LIS Continental European countries Austria 2013 Gross 35,4 11,4 14,2 21,2 60% 18,6 0,4 2,7 0,2 2,0 0,2 0,3 0,0
France 2010 Mix 44,3 15,3 15,5 28,8 65% 20,4 3,6 0,0 2,6 1,8 0,6
0,0 Germany 2015 Gross 38,4 12,7 16,7 21,7 57% 20,7 2,2 0,2 2,1 0,2 0,2 0,0
0,0 Luxembourg 2013 Gross 37,6 10,7 16,4 21,1 56% 17,8 0,1 5,8 0,2 1,5 0,2 0,6 0,4
0,3 Switzerland 2013 Gross 23,9 5,3 14,8 9,1 38% 15,0 0,0 1,0 0,8 0,1 1,8
0,0 panel c: LIS Nordic countries Denmark 2013 Gross 33,4 4,9 12,4 21,0 63% 20,7 0,9 1,6 1,3 0,6 2,6 0,7
0,2 Finland 2013 Gross 36,0 9,9 14,0 22,0 61% 17,8 0,0 2,0 0,7 3,0 1,2 0,5 1,0
0,0 Iceland 2010 Gross 25,2 7,1 11,5 13,7 54% 12,2 0,1 2,1 0,0 2,1 1,4 0,1 0,0
0,1 Netherlands 2013 Gross 31,8 6,3 12,4 19,5 61% 19,0 0,4 1,0 0,5 1,7 1,2 1,7 0,7
Norway 2013 Gross 31,7 9,6 13,6 18,1 57% 17,1 1,3 1,6 0,3 0,6 0,2 0,3 0,6
panel d: LIS Southern European countries Greece 2013 Gross 42,7 14,9 20,1 22,5 53% 25,5 0,0 1,2 0,0 0,7 0,0 0,3
0,1 Spain 2013 Gross 43,3 20,3 22,7 20,6 48% 17,1 0,3 0,2 0,2 4,7 0,0 0,3
0,0 Poverty rates (PL60) Redistribution Absolute Fiscal Redistribution via Programs
Discover theworld at Leiden University
LIS Dataset Gross / net
Primary income (a) Gross income (b) Disposable income (c) Absolute (a-c) Relative (a-c)/a*100 Old-age/ Disability/ Survivor Sickness Family/ Children Education Unemployment Housing General/food/ medical assistance Other transfers Income taxes Residual
panel e: LIS Central Eastern European countries Czech Republic 2013 Gross 32,9 10,4 11,3 21,5 65% 19,6 1,4 0,3 0,3 0,2 0,8
Lithuania 2013 Gross 37,3 17,1 20,1 17,2 46% 16,0 0,3 1,8 0,1 0,8 0,0 1,2
Estonia 2013 Gross 36,3 20,6 23,0 13,3 37% 13,1 0,2 1,6 0,1 0,5 0,0 0,0
0,1 Poland 2016 Mix 43,5 14,0 14,5 29,0 67% 21,5 6,1 0,1 0,3 0,1 0,8 0,6
0,1 Slovakia 2013 Gross 30,7 11,5 13,8 16,9 55% 15,8 0,2 2,3 0,0 0,2 0,7
0,1 panel f: LIS BRICS Brazil 2013 Gross 40,5 23,8 24,9 15,6 39% 13,9 0,7 1,6 0,5
0,0 South Africa 2012 Gross 42,1 27,4 29,8 12,3 29% 8,1 6,4 0,2
0,0 panel g: Latin America Guatemala 2014 Gross 21,5 19,6 22,3
0,6 0,0 0,6 0,6
0,0 Panama 2013 Gross 34,6 27,6 29,2 5,4 16% 4,3 0,3 1,9 0,0 0,5 0,0
0,0 Peru 2013 Gross 33,2 29,5 29,9 3,3 10% 1,8 0,3 0,1 0,0 1,3 0,0
0,0 panel g: LIS others Israel 2016 Gross 33,4 22,8 25,0 8,4 25% 8,2 0,8 0,3 0,2 1,1
0,0 Mean (rescaling) 35,7 15,7 18,8 16,9 47% 13,6 0,3 2,4 0,3 1,4 0,6 0,7 0,5
0,0 Poverty rates (PL60) Redistribution Absolute Fiscal Redistribution via Programs
Discover theworld at Leiden University
29.1 31.9 34.2 5.1
16.1 15.7 17.5 1.4
13.1 (45%) 16.1 16.7 (51%) 3.6
15.6 19.5 20.4 4.8
9.9 13.0 14.3 4.3
0.2 0.3 0.1
1.9 2.3 2.4 0.5
0.6 0.4 0.3
1.0 1.7 1.5 0.5
0.1 0.7 0.6 0.5
0.2 0.4 0.5 0.3
1.6 0.6 0.7
0.1 0.1
Discover theworld at Leiden University
Discover theworld at Leiden University
Discover theworld at Leiden University